
Thief_Trader
@t_Thief_Trader

تریدر چه نمادی را توصیه به خرید کرده؟
سابقه خرید
تخمین بازدهی ماه به ماه تریدر
پیام های تریدر
فیلتر
نوع پیام
Thief_Trader
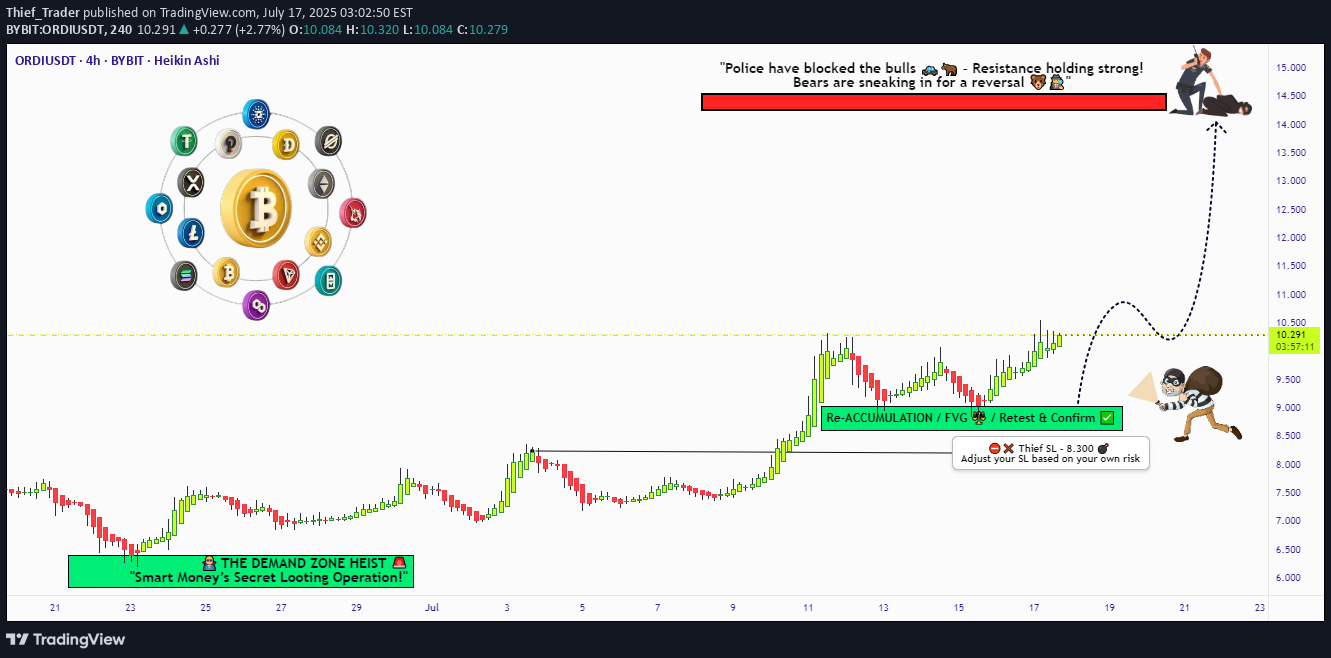
🚨 هشدار سرقت ORDI/USDT! 🚨 نقشه حمله صعودی ORDI/USDT (سبک معاملاتی دزدانه) 💰🎯 🌟 توجه دزدان دریایی بازار و غارتگران سود! 🌟 🔥 استراتژی معاملاتی دزدانه فعال شد! 🔥 📌 شرح ماموریت: بر اساس تحلیل نخبه دزدانه ما (اطلاعات سرقت فنی + بنیادی)، در حال طراحی یک سرقت صعودی از ORDI/USDT هستیم. هدف ما؟ غارت سود در نزدیکی منطقه مقاومت پرخطر قبل از اینکه "سد پلیس" (تله های خرسی و برگشت ها) شروع به کار کند! 🚨 تنظیمات معامله (برنامه سرقت روزانه/نوسانی): ورود (📈): "گاوصندوق باز است! Swipe غارت صعودی به هر قیمتی!" نکته حرفه ای: از سفارشات محدود خرید نزدیک به کف های نوسانی 15M/30M برای ورودی های عقب نشینی امن تر استفاده کنید. حرکت پیشرفته دزدانه: چندین سفارش محدود DCA را برای حداکثر اختفا لایه بندی کنید. حد ضرر (🛑): 8.300 (نزدیکترین کف نوسانی بدنه کندل 4H). بر اساس تحمل ریسک و حجم لات خود تنظیم کنید! هدف (🎯): 14.400 (یا اگر بازار خطرناک شد زودتر فرار کنید!). ⚡ راهنمای غارت سریع اسکالپر: فقط لانگ اسکالپ کنید! دزدهای پولدار؟ همه را وارد کنید! دزدهای بی پول؟ به معامله گران نوسانی بپیوندید و طرح را به آرامی اجرا کنید. از SL متحرک برای قفل کردن سود و فرار ایمن استفاده کنید! 💎 چرا ORDI/USDT؟ (اطلاعات سرقت بنیادی) ✅ حرکت صعودی در حال انجام است! ✅ روندهای کلان و سیگنال های بین بازاری به نفع صعود است! ✅ نوسانات ناشی از اخبار؟ انتظار حرکات بزرگ را داشته باشید! ⚠️ هشدار: پلیس های بازار (رویدادهای خبری) در پیش است! از معاملات جدید در طول اخبار پر تاثیر خودداری کنید! حد ضررهای متحرک = بهترین ابزار فرار شما! 💥 این سرقت را تقویت کنید! 👉 Hit لایک و فالو کنید تا تیم سرقت ما قوی تر شود! سرقت های سودآورتر به زودی! 🚀💰 🎯 نکته پایانی: این توصیه مالی نیست - فقط یک طرح استادانه دزدانه است! بر اساس ریسک و استراتژی خود تنظیم کنید! 🔥 آماده حمله هستید؟ بیایید مقداری سود بدزدیم! 🏴☠️💸 👇 کامنت بگذارید و طرح را تقویت کنید! 👇 (🔔 منتظر سرقت بعدی باشید!) 🚀🤫
Thief_Trader
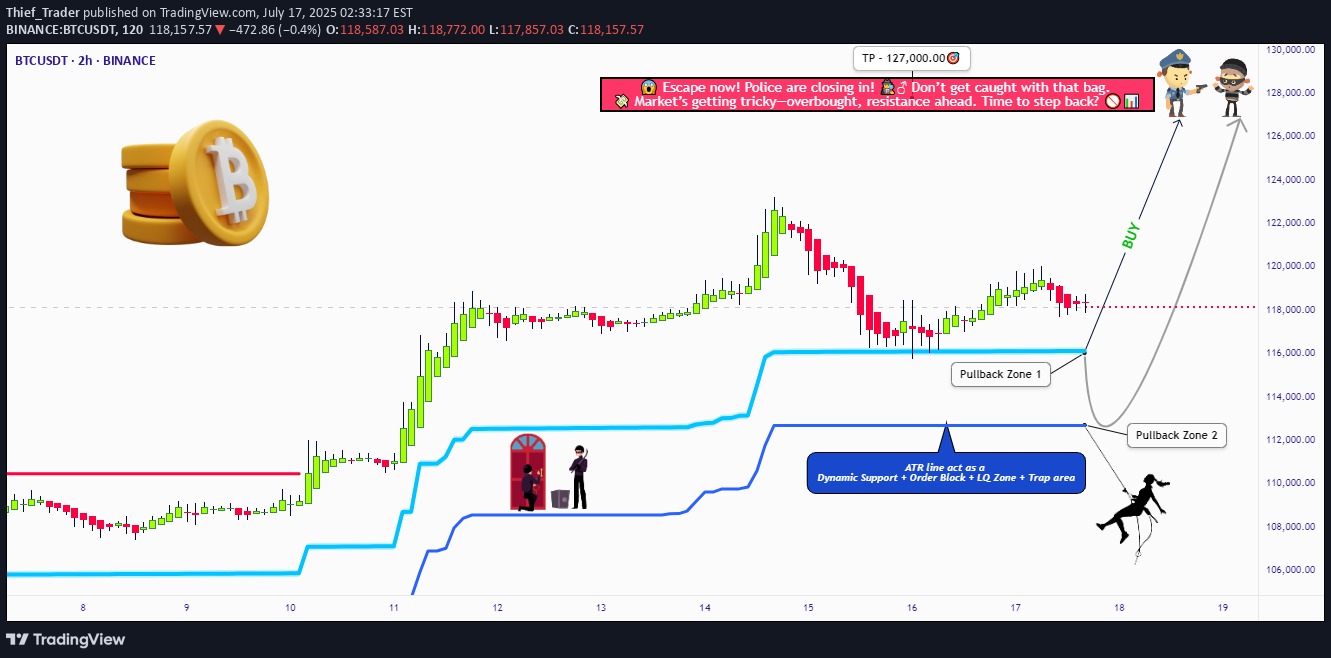
🏴☠️"Bitcoin در مقابل Tether" نقشه سرقت بازار کریپتو 🔥 | سبک ترید دزد (نوسانی/روزانه) 🌍 سلام سازندگان پول، هکرهای نمودار و دزدهای جهانی! 💰🤑💸 به نقشه سرقت جدید توسط دزد محبوبتان در این بازی خوش آمدید — این بار هدف قرار دادن بازار کریپتو "Bitcoin در مقابل Tether" مانند یک جنایتکار حرفهای روی نمودارها. 🎯📊 این یک تحلیل تکنیکال معمولی نیست — این یک سرقت استراتژیک است که بر اساس سبک ترید دزد™، ترکیبی از تحلیل تکنیکال + فاندامنتال عمیق، روانشناسی بازار و غرایز خام معاملهگر است. 💼 آماده سازی — برای سرقت آماده شوید 🎯 ما به یک عملیات صعودی نگاه میکنیم، آماده برای ورود به خزانه های با ارزش بالا در نزدیکی یک منطقه مقاومتی پرخطر و پربازده — مراقب باشید، این یک منطقه تله ولتاژ بالا است که فروشندگان حرفهای و دزدهای نزولی کمین خود را در آنجا قرار میدهند. ⚡🔌 این طرح شامل ورود لایهای به سبک DCA است که هدف آن حداکثر سود با ریسک کنترل شده است. هشدارهای نمودار روشن، ذهنیت آماده. 🧠📈🔔 🟢 ورود: "آغاز سرقت" 📍 منطقه-1 خرید: نزدیک 116200.00 پس از اصلاح MA 📍 منطقه-2 خرید: نزدیک 112600.00 اصلاح عمیق تر 🛠️ سبک ورود: سفارشات محدود + لایه بندی DCA 🎯 منتظر تاییدیه های تقاطع MA و مناطق واکنش قیمت باشید — بازار را تعقیب نکنید، آن را به دام بیاندازید. 🔻 حد ضرر: "برنامه ریزی مسیر فرار" ⛔ SL برای اصلاح-1: 113000.00 (کف نوسان 2 ساعته) ⛔ SL برای اصلاح-2: 110000.00 📌 قرار دادن SL بستگی به اندازه موقعیت و مدیریت ریسک شما دارد. ضرر را کنترل کنید; زنده بمانید تا روز دیگری سرقت کنید. 🎭💼 🎯 منطقه هدف: "نقطه برداشت پول" 💸 اولین TP: 127000.00 🏁 اگر مومنتوم اجازه می دهد، بگذارید سود ادامه یابد. هنگامی که به نفع شما حرکت کرد، از SL متحرک برای قفل کردن سود استفاده کنید. 👀 نکته اسکالپرها: فقط سمت خرید را بازی کنید. اگر سرمایه شما سنگین است، حرکات اولیه را انجام دهید. اگر سبک هستید، با گروه نوسان کنید. در قطار صعودی بمانید و از تله های فروش استقراضی اجتناب کنید. از SL متحرک تنگ استفاده کنید. 🔎 داستان پشت سرقت – چرا صعودی؟ "Bitcoin در مقابل Tether" مومنتوم صعودی ناشی از: 💹 جهش فنی از پشتیبانی major 🌏 احساسات اقتصاد کلان و ژئوپلیتیکی 📰 تغییر حجم + احساسات (ریسک پذیر) 📈 تایید شاخص بین بازاری 🧠 معامله گران باهوش در حال آماده شدن هستند، نه واکنش نشان دادن. از گله جلوتر باشید. 👉 برای بینش عمیق تر، به موارد زیر مراجعه کنید: ✅ گزارش های کلان ✅ COT Data ✅ همبستگی های بین بازاری ✅ چشم انداز شاخص خاص چین ⚠️ هشدار ریسک – رویدادهای معاملاتی و نوسانات 🗓️ انتشار اخبار می تواند به سرعت احساسات را تغییر دهد — ما توصیه می کنیم: ❌ از موقعیت های جدید در طول رویدادهای پرتاثیر اجتناب کنید 🔁 از SL های متحرک برای محافظت از سود استفاده کنید 🔔 همیشه اندازه موقعیت و هشدارها را عاقلانه مدیریت کنید ❤️ از گروه حمایت کنید | نقشه را تقویت کنید این تحلیل را دوست دارید؟ دکمه Boost را بزنید تا به تیم نیرو دهید. به جوخه دزد بپیوندید و مانند افسانه ها معامله کنید — هوشمندانه بدزدید، تیز معامله کنید. 💥💪💰 هر روز در بازار یک فرصت سرقت جدید است — اگر برنامه داشته باشید. منتظر نقشه های سرقت wild بیشتر باشید. 📌 این مشاوره مالی نیست. با مسئولیت خودتان معامله کنید. بر اساس استراتژی شخصی و سرمایه خود تنظیم کنید. شرایط بازار به سرعت در حال تغییر است — به روز باشید، هوشیار باشید.
Thief_Trader
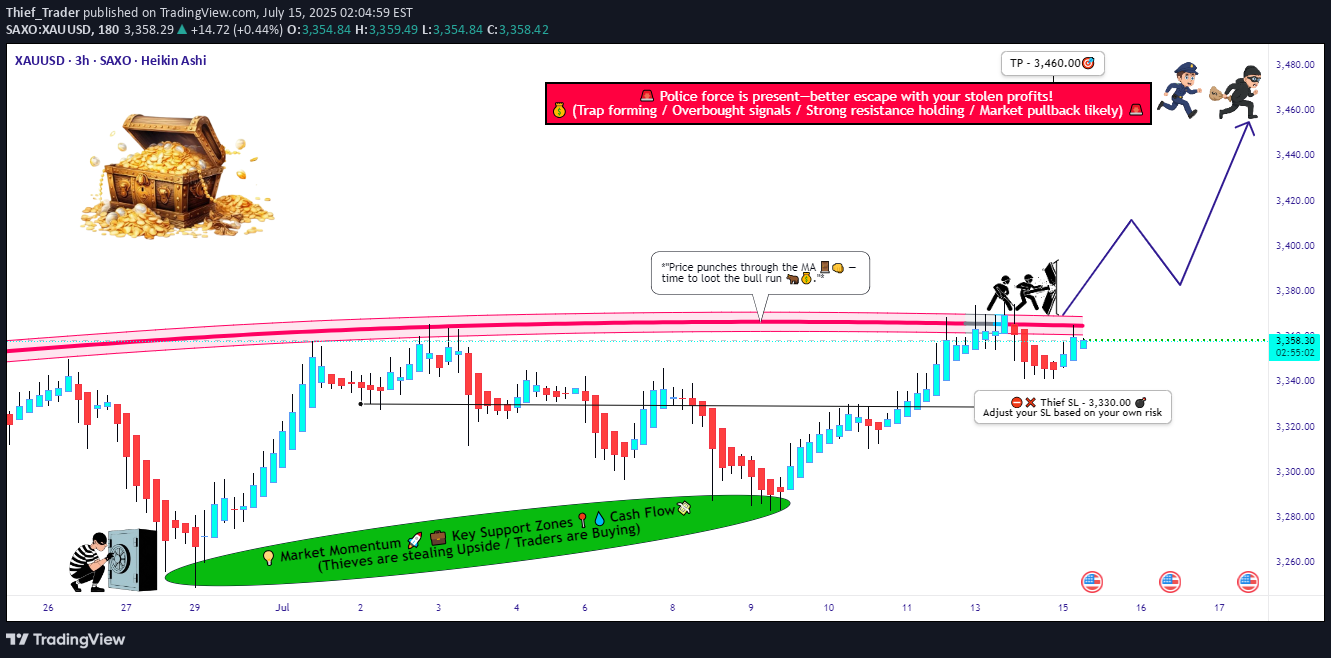
💰🚨 هشدار سرقت طلا! طرح اصلی XAU/USD (سبک معاملاتی دزد) 🎯 🔥 مانند یک حرفه ای پیپ ها را بدزدید - استراتژی شکست طلای با احتمال بالا! 🔥 🎯 استراتژی سرقت طلای Thief Trading (نوسانی/روزانه) 💸 👋 سلام بر دزدان دریایی بازار و ربایندگان سود! 🌍✨ بر اساس تحلیل 🔥Thief Trading Style🔥، ما در حال برنامه ریزی یک major سرقت در XAU/USD (طلا) هستیم. نقشه چیست؟ شکست را بخرید، قبل از رسیدن پلیس ها (مقاومت) فرار کنید! 🚔💨 📈 منطقه ورود: سرقت آغاز می شود! 🚀 "منتظر شکست MA باشید (3400) - سپس حمله کنید!" تایید صعودی: پس از شکست MA، در یک پولبک 15M/30M وارد شوید. ترفند دزد: از Buy Stop بالاتر از MA یا Buy Limit نزدیک کف های نوسانی برای بهترین ریسک به ریوارد استفاده کنید. استراتژی DCA/Layering: برای به حداکثر رساندن سود، چندین سفارش محدود را مستقر کنید. 🔔 یک هشدار تنظیم کنید! شکست را از دست ندهید - دزدها سریع حرکت می کنند! ⏳ 🛑 حد ضرر: از غارت خود محافظت کنید! 📍 محل قرارگیری SL دزد: 3330.00 (کف نوسانی 4H) - بر اساس ریسک و حجم لات خود تنظیم کنید. ⚠️ هشدار: اگر از Buy Stop استفاده می کنید، تا بعد از شکست، SL را تنظیم نکنید - مگر اینکه عاشق ضررهای غیر ضروری باشید! 🔥 🎯 هدف: با طلا فرار کنید! 🏴☠️ منطقه برداشت سود: 3460.00 (یا اگر خرس ها ظاهر شدند زودتر خارج شوید!) اسکالپرها: فقط در سمت LONG معامله کنید - از SL متحرک برای قفل کردن سود استفاده کنید. معامله گران نوسانی: سوار بر موج شوید، اما مراقب تله های مقاومت باشید! 📰 زمینه بازار: چرا این سرقت؟ روند خنثی (اما پتانسیل صعودی! 🐂) عوامل کلیدی: ژئوپلیتیک، داده های COT، روندهای کلان، تغییر احساسات 🚨 هشدار اخبار: از معاملات جدید در طول اخبار پر تاثیر اجتناب کنید - SL متحرک سود را نجات می دهد! 💥 این سرقت را تقویت کنید! (لایک و اشتراک برای پیپ های بیشتر!) 💖 Hit دکمه 👍 Boost را فشار دهید تا خدمه Thief Trading ما قوی تر شود! 🚀 برنامه های سرقت بیشتر به زودی - با ما همراه باشید! ⚠️ سلب مسئولیت (ایمن بمانید، دزدها!) این توصیه مالی نیست. تجزیه و تحلیل خود را انجام دهید و ریسک را مدیریت کنید. بازارها سریع تغییر می کنند! سازگار شوید یا گرفتار شوید. 🎯 معاملات خوبی داشته باشید، دزدان دریایی! بیایید مقداری طلا بدزدیم! 🏴☠️💛
Thief_Trader
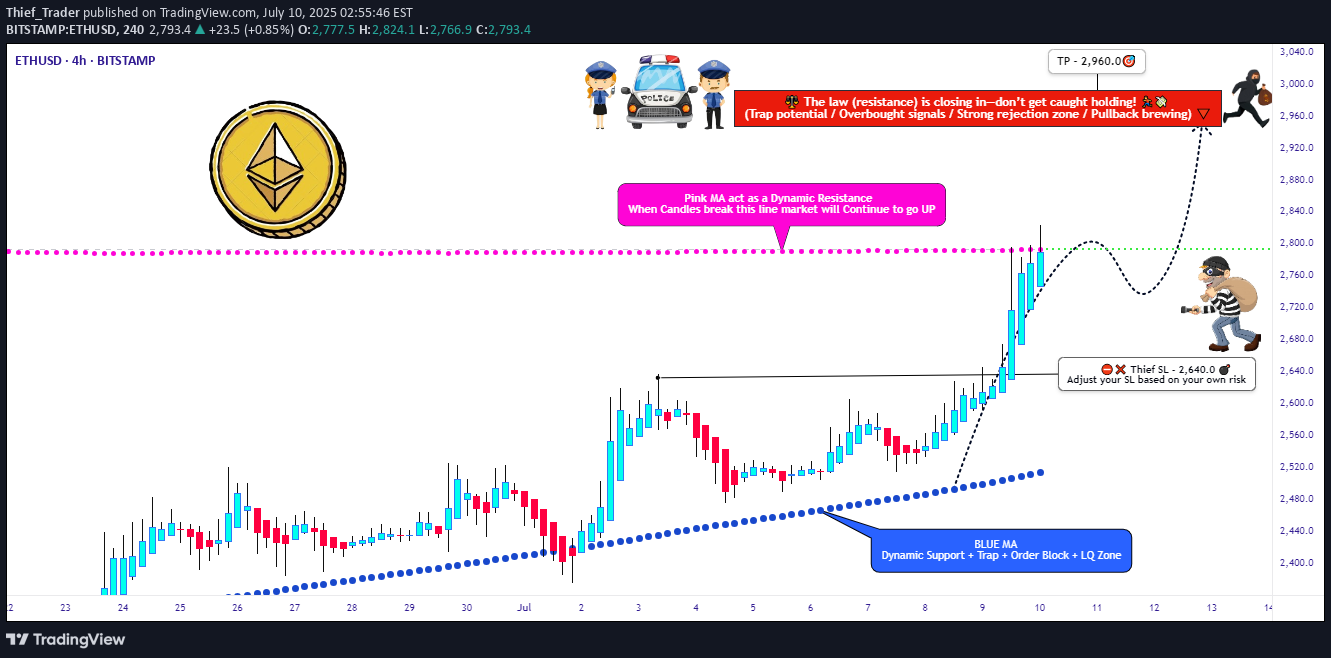
برنامه ETHEREUM برنامه HEIST: طرح معاملاتی به سبک دزد برای حداکثر دستاورد mode حالت: فعال شده | زمان سرقت گاوها 📢🌍 سلام سازندگان پول ، کلاهبرداری رمزنگاری و راهزنان نمودار! 🐱👤🤑💸 به شکست "سبک تجارت دزد" خوش آمدید-یک طرح بازار پرقدرت و پرقدرت بازار رمزنگاری شده بر روی اینتل عمیق فنی و اساسی است. این استراتژی متوسط شما نیست ... این یک مأمور تمام عیار در بازار ETH/USD است! 🧠 طرح جامع (ETH/USD - تجارت روز و نوسان) 🔎 بر اساس تجزیه و تحلیل حالت دزد ما - ترکیب احساسات بازار ، روانشناسی روند و عملکرد قیمت - برای سرقت صعودی رسیده است. ما در حال راه اندازی مغازه در تله های نقدینگی پرخطر و هدف قرار دادن بیش از حد نزولی هستیم. - استراتژی Entry - "طاق باز است ، زمان اعتصاب!" 💥 🟢 طولانی برو: Swipe در حرکت صعودی. ord تنظیم سفارشات محدودیت در مناطق کلیدی برگشتی (بالا/پایین چرخش/پایین از 15 متر یا 30 متر از بازه های زمانی). 💼 از DCA (سفارشات لایه بندی شده) برای ورودی های دقیق استفاده کنید. هرچه لایه های بیشتر باشد ، پشته غارت قوی تر می شود. از دست دادن مرحله - "قانون دزد: گرفتار نشوید" sls SLS را در بالا/پایین چرخش منطقی با استفاده از بازه زمانی 1H قرار دهید 💡 مطابق با اندازه لوط تنظیم کنید و چند مدخل را جمع می کنید خطر هوشمندانه ، دزدی هوشمندتر! 🎯target - "فرار را در 2850.0 انجام دهید یا در صورت نزدیک شدن پلیس زود زود پرش کنید!" tp tp در 2960.0 ، یا اگر زودتر شروع به تبدیل سایه کند (خروج قبل از اینکه علائم وارونگی ظاهر شود) زودتر است. کد Scalper - "فقط دستهای سریع!" نمایشنامه های سمت طولانی پوست سر 🧠 از SLS برای محافظت از سود سرقت شده استفاده کنید کیف پول؟ پیشرو حرکت کیسه های maller؟ با معامله گران نوسان همراه شوید و طرح را دنبال کنید. - زمینه بازاریابی - چرا این هیست ضد گلوله است heth/usd به دلیل: محرک های کلان و اساسی معیارهای زنجیره ای که تجمع را نشان می دهند تجزیه و تحلیل احساسات به سمت خرسهای بیش از حد متمایز تکیه می کند چرخش سیگنالینگ همبستگی Intermarket به Altcoins 🔗stay شارپ ، به روز کنید با: گزارش های COT ، تقویم کلان ، فیدهای خبری رمزنگاری ⚠ هشدار انتشار News - "سارقین از غافلگیر کننده ها متنفرند" - ورودی های جدید در طول major انتشار خبر از ضررهای متوقف شده برای قفل کردن سود استفاده کنید - مواضع را در طول سنبله های نوسانات کنترل نکنید برنامه را دوست دارید؟ سپس باند را تقویت کنید! 🎯TAP دکمه BOOST 🔥 🔥 و پشتیبانی از سبک تجارت دزد را نشان دهید! هرچه افزایش بیشتر باشد ، برنامه های بیشتری کاهش می یابد - بیایید جامعه ای از معامله گران هوشمند را که به طور قانونی بازار را سرقت می کنند ، بسازیم. ✍disclaimers - این تجزیه و تحلیل فقط برای اهداف آموزشی است - نه مشاوره مالی. - همیشه در قوانین مدیریت ریسک خود تجارت کنید. - شرایط بازار سریع تغییر می کند - سازگار ، تکامل می یابد و تجارت نمی کند. - برای طرح های بیشتر در اطراف است - The Heist بعدی همیشه در گوشه و کنار است. تا آن زمان ... قفل. بار غارت 🐱👤🤑💰
Thief_Trader
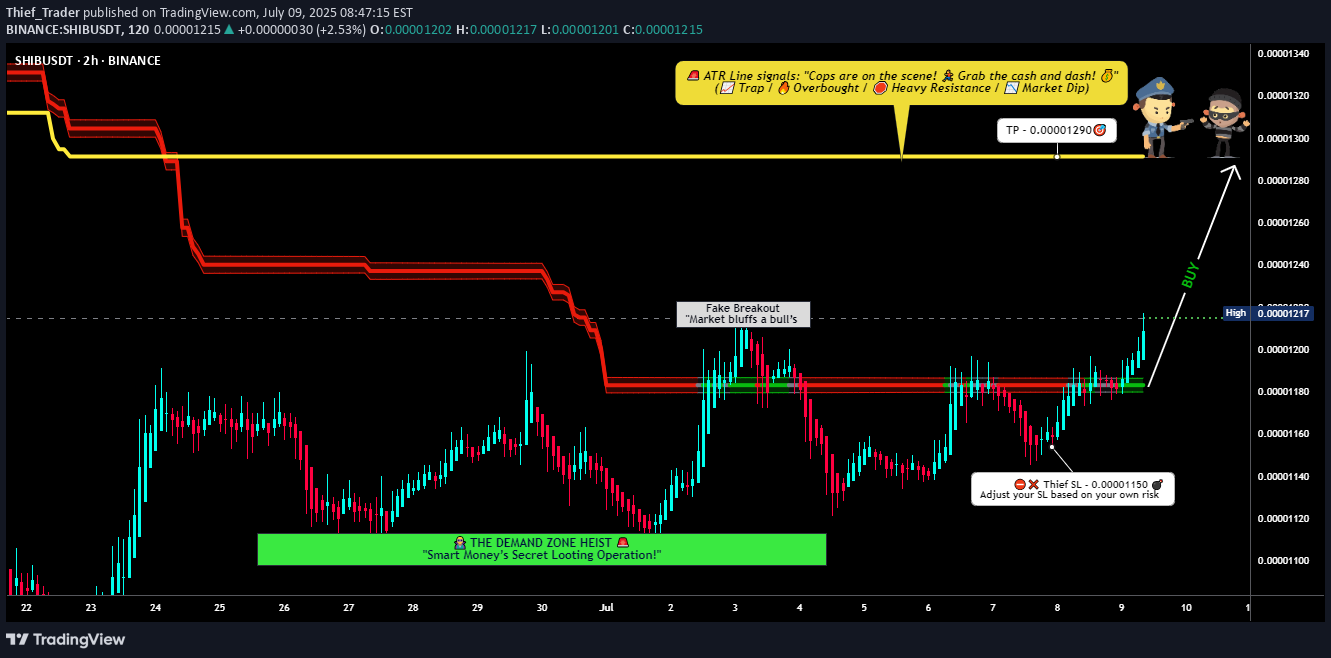
🏴☠️💸**نقشه سرقت SHIB: گاوها را بدوش، خرسها را گول بزن | استراتژی سبک معاملاتی دزد (نوسانی/اسکالپ)**💸🏴☠️🌍سلام! Hello! Marhaba! Bonjour! Ola! Hallo!🌍💰خطاب به همه دزدان دریایی بازار، جویندگان سود و دزدان خاموش... خزانه باز است!💰این یک ماموریت ویژه بازار برای SHIB/USD (شیبا اینو) است، بر اساس «سبک معاملاتی دزد» بدنام — روشی که برای دزدکی وارد شدن، به دست آوردن سود و ناپدید شدن با سبک طراحی شده است. 💼✨🧠پشتیبانی شده توسط ترکیبی تند از تحلیل تکنیکال، بنیادی، درون زنجیرهای و احساسات، این استراتژی برای معاملهگران نوسانی و روزانه که آماده نفوذ به مناطق پرنوسان و فرار با سود هستند، طراحی شده است.🎯نقشه سرقت:ما در حال هدف قرار دادن یک شکست پرخطر و پربازده هستیم و چشمان خود را به منطقه تله پلیس ATR دوختهایم، جایی که بازارسازان اغلب معامله گران را فریب داده و به دام می اندازند. تمرکز ما؟ نقطه شیرین جایی است که تثبیت به پایان می رسد، شکست های جعلی شروع می شود و معکوس های واقعی شروع به کار می کنند. ⚠️🐍📥ورود (شروع دزدی):"خزانه باز است!"با استفاده از دستورات محدود خرید در پایین ترین سطح نوسانات یا مناطق حمایت، دزدکی وارد شوید—برای گرفتن عقب نشینی ها، نمودار 15 دقیقه ای یا 30 دقیقه ای را انتخاب کنید.ما در حال چیدن سفارشات مانند یک دزد حرفه ای با استفاده از DCA (روش لایه بندی) برای کاهش ریسک ورود هستیم. 📊💼🔎 منطقه ورود: ورودی های بازار یا محدود نزدیک به پایین ترین سطح ساختار—دقیق باشید، نه حریص.🛑حد ضرر (دریچه فرار):از پایین ترین سطح نوسان 2 ساعته در حدود 0.00001150 به عنوان سیگنال فرار خود استفاده کنید.مدیریت ریسک زره شماست: SL را بر اساس حجم لات، تعداد سفارش و قرار گرفتن در معرض معامله تنظیم کنید.🔒نکته دزد: هرگز بدون برنامه فرار خود معامله نکنید!📈هدف (منطقه Safe):🎯 هدف اصلی: 0.00001290اختیاری: از SL متحرک استفاده کنید و با داغ شدن سرقت، سود را افزایش دهید.اسکالپرها - فقط در سمت بلند سرقت شرکت کنید! اگر یک کیسه بزرگ سرمایه بسته اید، زودتر بپرید. اگر نه، با تیم نوسانی سوار شوید. 🚁💸📊سوخت بنیادی دزد:SHIB حرکت صعودی به دلیل تغییرات در احساسات کلان، چرخش بازار، انباشت نهنگ ها و حجم زنجیره ای flow در حال افزایش است.قبل از بارگیری کیف های خود، گزارش های کلان مرتبط، بینش های بین بازاری و معاملات آتی رمزنگاری data را بررسی کنید. 🧠📈🔗🛎️ هشدارهای سرقت – Safe هوشیار بمانید!:🚨 در طول انتشار اخبار major، نوسانات می تواند منفجر شود. گیر نیافتید!❌ از ورودی های جدید در طول اخبار خودداری کنید✅ از توقف های متحرک برای قفل کردن سود در موقعیت های موجود استفاده کنید💖این نقشه را دوست دارید؟ از خدمه پشتیبانی کنید:💥برای زنده نگه داشتن و توطئه کردن خدمه معاملاتی دزد، دکمه تقویت را فشار دهید!ما به طور مرتب نقشه های سرقت تازه را منتشر می کنیم - به ما کمک کنید عشق را گسترش دهیم، خدمه را رشد دهیم و به سرقت بردن سود از نویز را ادامه دهیم. 🚀📌سلب مسئولیت: این تحلیل فقط برای اهداف آموزشی است - نه مشاوره مالی. همیشه DYOR انجام دهید و بر اساس مشخصات ریسک شخصی خود تنظیم کنید.📌منتظر ماموریت های سرقت بیشتری باشید. بیایید از بازار پیشی بگیریم – یک معامله در یک زمان.🤑🐱👤💎 #سبک_معاملاتی_دزد #سرقت_SHIB #استراتژی_رمزنگاری #سرقت_بازار #حرکات_پول_هوشمند
Thief_Trader
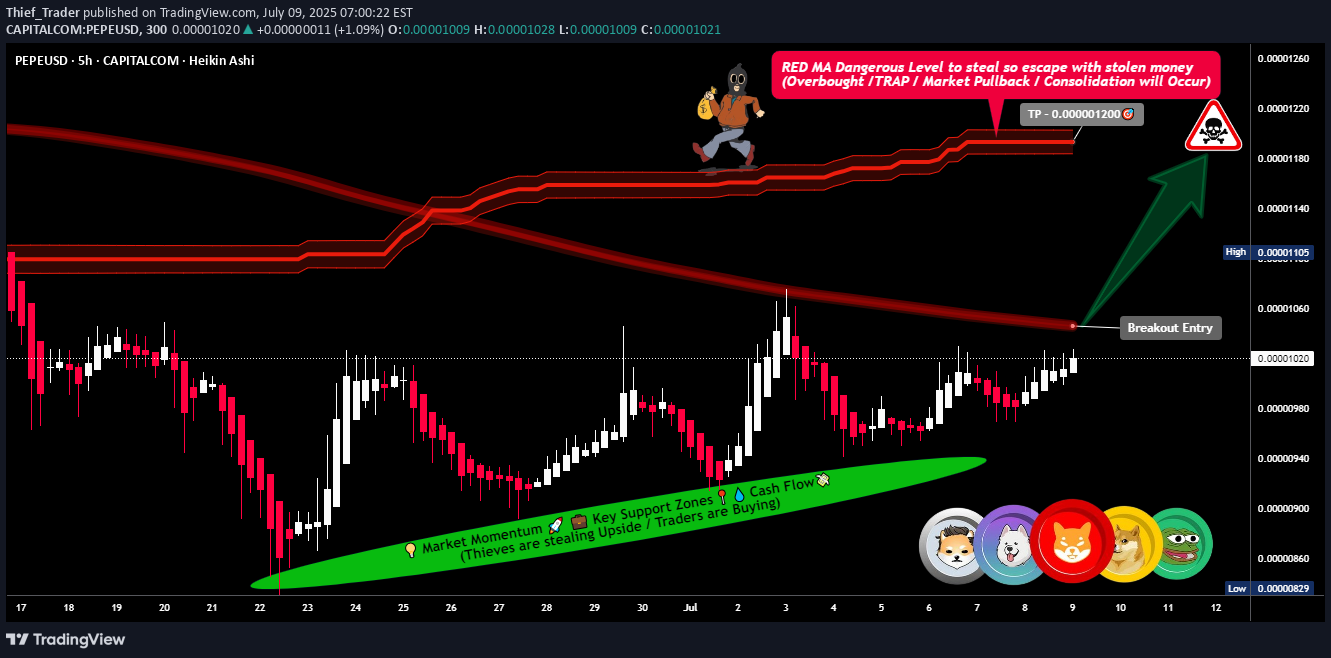
🔥🚨 سارقان وال استریت: طرح سرقت رمزنگاری Pepe/USD 🚨🔥 مجموعه تجاری "سبک دزد" نهایی که حتی وال استریت حسادت می کند -یک دفترچه بازی پرخطر و پرخطر برای غیرقانونی های بازار- 🌍 سلام Global Money Grabbers! هلا | اولا | Bonjour | هالو | Marhaba | namaste به منطقه تجارت دزد خوش آمدید - جایی که شورشیان هوشمند قیمت را تعقیب نمی کنند ، آنها آن را به دام می اندازند ، آن را سرقت می کنند و با سود خود فرار می کنند. 🏴☠ 💸 مأموریت: پپه/نفوذ بازار USD 🎯 هدف: به منطقه رمزنگاری PEPE/USD که در آن خرس های بزرگ می خوابند نفوذ کنید - و در منطقه خطر که در آن بیشتر معامله گران وحشت و خروج می کنند ، حمله می کنند. این جایی است که ما شکوفا می شویم. 🔍 تنظیم تجارت: طرح Heist بازار: پپه/دلار بازی: ورود طولانی (تاکتیک واژگونی به سبک دزد) منطقه: مقاومت در برابر داغ قرمز معکوس شد (با نام مستعار منطقه تله سود) strategy استراتژی ورود: منتظر شکستن از طریق Red متوسط دیوار در حال حرکت در 0.00001060 باشید - این سیگنال شماست که طاق باز است. برنامه اجرا: سفارشات توقف را درست بالاتر از سطح شکست قرار دهید. اعزام سفارشات محدودیت در 15 دقیقه/30 دقیقه نوسان یا تله های ادغام. از سبک ورود DCA/لایه بندی استفاده کنید - مانند یک دزد واقعی ، هرگز به یکباره همه چیز را نمی روید. ⚙ هشدارها را در مناطق برک آوت تنظیم کنید - سارقان هرگز از فرصت نمی خوابند! 🛑 تاکتیک های از دست دادن را متوقف کنید (خروج مخفیک): SL اولیه: دقیقاً زیر نوسان اخیر در نمودار 5H (حدود 0.00000960) تنظیم کنید. قبل از رها کردن آن SL صبر کنید - خیلی زود گرفتار نشوید. مدیریت ریسک وسیله نقلیه فرار شماست. آن را خراب نکنید. 🎯 اهداف: خروج اولیه: 0.00001200 خروج اولیه اختیاری: اگر گرما روشن است ، کیف را بگیرید و ناپدید شوید. 🏃♂ همیشه SL خود را دنبال کنید تا از غارت خود محافظت کنید. 💡 نکات مربوط به Scalping & Swing Heist: اسکالپرها: فقط سوار طولانی waves شوید. سارقان نوسان: تله های خود را تنظیم کرده و صبور باشید - حرکات بزرگ زمان می برد. کیف پول های بزرگ: شیرجه وارد شوید. کیف پول های کوچک: با محافظت و دقت سوار شوید. 🔎 بینش بازار (Drop Thief Intel): PEPE/USD در حال چشمک زدن سیگنال های صعودی در سراسر است: تجزیه و تحلیل در زنجیره محل قرارگیری شاخص های معکوس احساسات مجموعه های اقتصادی کلان هم افزایی Intermarket تأییدات خود را قبل از بازیگری دریافت کنید - ما هوشمندانه و نابینا نیستیم. ⚠ اخبار و هشدار نقشه گرما: اخبار با تأثیر بالا = چشمک زن red چراغ در اعلامیه های major از موقعیت های جدید خودداری کنید. در حال حاضر در بازی؟ برای تأمین سود خود در حین ایجاد هرج و مرج از SL استفاده کنید. 🚀 سرقت را تقویت کنید! Smash That Boost Button برای پیوستن به خدمه نخبگان Thief Traders برای تفریح و سود هر روز نمودارهای خود را می چرخانند. 💎📈 بمانید ، باهوش بمانید - این قمار نیست ، این یک جرم بازار سازمان یافته (نوع هوشمند) است. 🎭💰 بعدی که به زودی می آید - برای طرح های سرقت بیشتر دنبال کنید! 💣💼
Thief_Trader
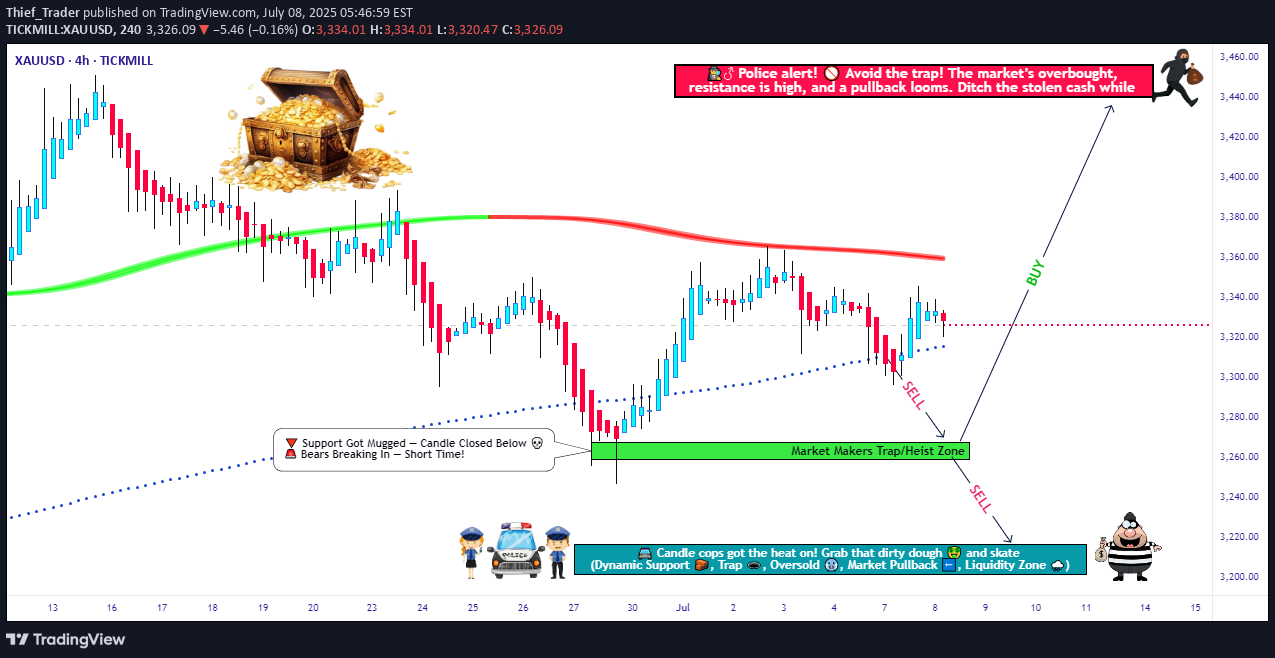
🏆 هشدار طلای طلا! 🏆 استراتژی راهزن Xau/USD (تجارت نوسان/روز) مانند یک حرفه ای پیپ ها را سرقت کنید! 💰🔓 برنامه RAID BULL در مقابل BEAR 🌟 سلام ، دزدان دریایی بازار! 🌟 "روند همدست شماست - زمان غارت!" Intel فنی و بنیادی دزد: Xau/USD (طاق طلا) سیگنال های نزولی چشمک می زند ، اما ما آماده هستیم تا به هر دو طرف حمله کنیم! طرح Heist را در زیر دنبال کنید 🎯 امتیازات Enry (از کجا اعتصاب کنید!) 🏴☠ حمله طولانی (سارقان صعودی): Break & Grab: بالاتر از 3450.00 (منطقه بازگردانی) را وارد کنید "منتظر شکستن ، سپس کمین!" 🐻 یورش کوتاه (راهزنان نزولی): حمله دزدکی حرکت 1: زیر 3300.00 بفروشید Sneak Attack 2: زیر 3260.00 بفروشید (دیوار پشتیبانی ترک خورده!) 🛑 STOP-LOSS (مسیرهای فرار) تجارت صخره ای: SL در 3230.00 (از غارت خود محافظت کنید!) Trade Bearish 1: SL در 3360.00 (گرفتار نشوید!) Trade Bearish 2: SL در 3280.00 (خطر = پاداش!) (تنظیم SL را بر اساس اشتهای ریسک و اندازه لوط خود تنظیم کنید!) 💰 انتفاعی (پول نقد و فرار!) سارقان صخره ای: TP در 3270.00 (یا زود فرار!) راهزنان نزولی (1): TP در 3270.00 Bearish Bandits (2): TP در 3210.00 (امتیاز بزرگ!) ⚠ هشدار: تله های بازار پیش رو! اخبار = منطقه خطر! trate از معاملات جدید در طول اخبار با تأثیر بالا خودداری کنید. Trailing SL = ماشین فرار شما! سود را قفل کنید و از معکوس های خودداری کنید. 📰 پشتیبان گیری بنیادی (چرا این هیست کار می کند) حرکت نزولی که توسط روندهای کلان ، داده های COT و احساسات ایجاد می شود. تیز بمان - بازاریابی سریع تغییر می کند! 💥 این هیست را تقویت کنید! 💥 مانند و به اشتراک گذاری برای تقویت خدمه دزدان دریایی ما! 🚀 هشدار بیشتر = سود بیشتر! 🚨 بعدی که به زودی می آید ... با ما همراه باشید! 🚨
Thief_Trader
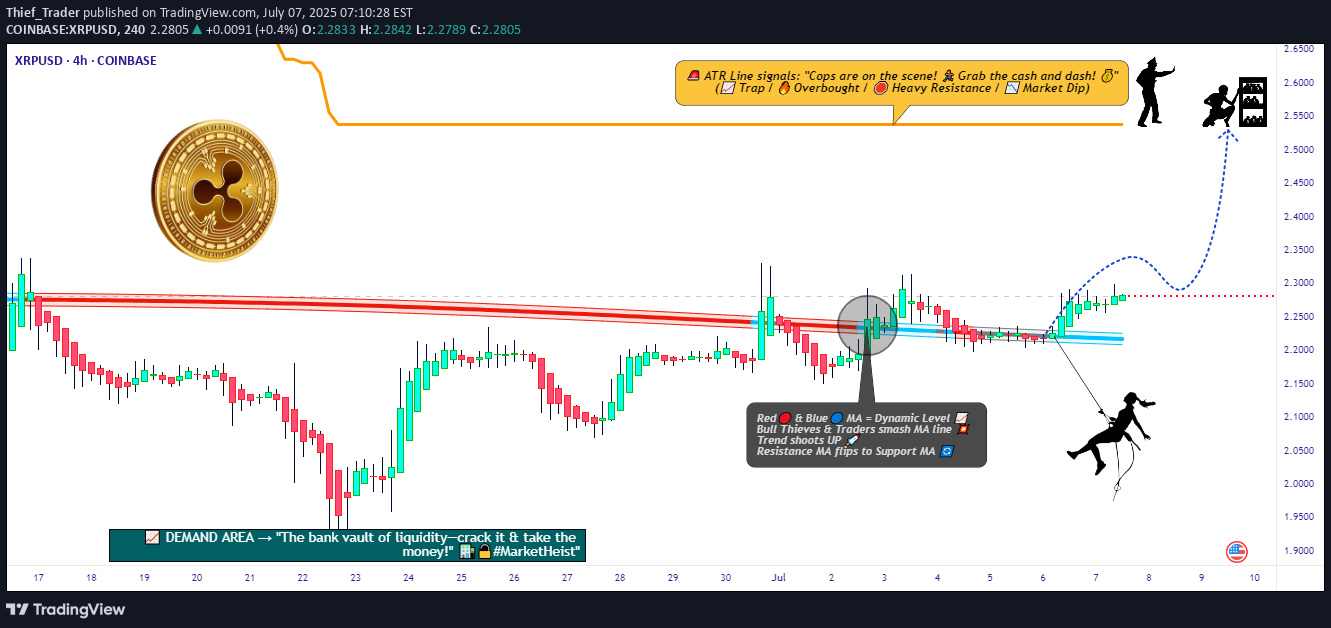
🚨 XRP/USD Heist Alert: Grab Fourish Loot قبل از فرار! (سبک تجارت دزد) 🌟 تبریک ، دزدان دریایی بازار و مهاجمان سود! 🌟 (hola! oi! bonjour! hallo! marhaba!) strategy استراتژی تجارت دزد فعال! 🔥 بر اساس تجزیه و تحلیل فنی بی رحمانه + بنیادی ، در اینجا نحوه عملکرد ما از XRP/USD (Ripple در مقابل دلار) آورده شده است. طرح ورودی طولانی نمودار را دنبال کنید-هدف ما منطقه ATR زرد پرخطر (بیش از حد ، ادغام ، وارونگی بالقوه) است. مراقب تله ها باشید! خرس ها و پلیس ها در اینجا کمین می کنند ، اما ما هوشمندانه اعتصاب می کنیم. 🏴☠ ورود: "Cracked Vault - Bullish Loot بازی رایگان است!" خرید سفارشات محدودی را ترجیح دهید (30-30 دقیقه بازه زمانی در نزدیکی پایین/ارتفاع نوسان). پرخاشگر؟ Swipe فوراً - فقط به پلیس (تله نقدینگی) توجه کنید. 🛑 از دست دادن را متوقف کنید (غارت خود را ذخیره کنید!): سارقان نوسان: 4 ساعت ویک اخیر (2.1500 دلار). تاکتیک های خطر: SL را بر اساس اندازه تجارت ، سفارشات و روده های خود تنظیم کنید. 🎯 اهداف: اصلی گرفتن: 2.5400 دلار (یا در صورت محو شدن حرکت زودتر فرار کنید). پوست سر: فقط طولانی! SL خود را دنبال کنید - هیچ حریصی نگهدارنده نیست! 💣 رانندگان کلیدی (چرا این هیست کار می کند): دمیدن BULLISH MOMINATUM (اصول اولیه ، تختخواب ، زنجیره ای data را بررسی کنید تا به Klick 🔗 بروید). اخبار اخبار: از معاملات تازه در طول اخبار با تأثیر بالا خودداری کنید-موقعیت های باز محافظت شده با توقف های دنباله دار! 💥 این هیست را تقویت کنید! Hit 👍 مانند ، 🔔 دنبال کنید ، و 💬 اظهار نظر کنید تا به برنامه سرقت بعدی ما سوخت. با هم ، ما پول نقد بازار را سرقت می کنیم. مجرد روز 📢 هشدار نهایی: بازارها سریع تغییر می کنند. قبل از رسیدن پلیس ، تیز بمانید ، سازگار شوید و پول نقد کنید. 🤑 با ما همراه باشید. 🐱👤🚀
Thief_Trader
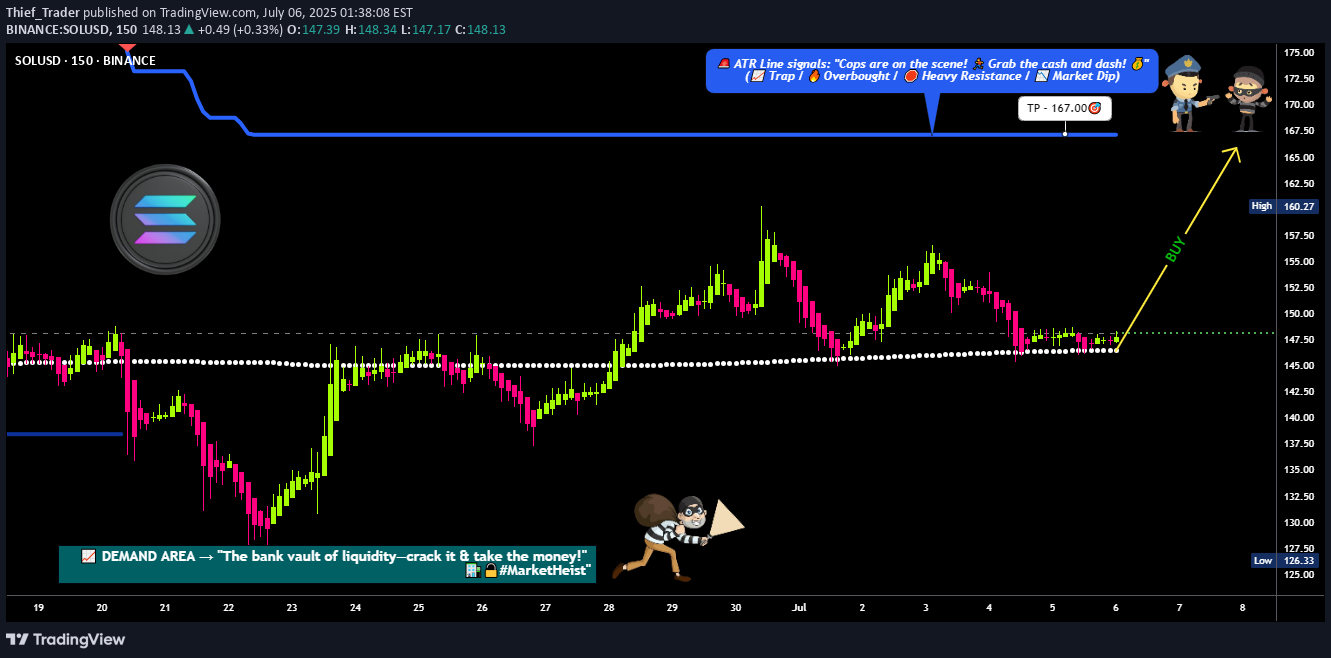
🔥🚨 "SOLANA هشدار Heist: برنامه نهایی حمله صعودی (شکست یا جعلی؟)" 🌍👋 تبریک ، دزدان دریایی بازار و راهزنان سود! (انگلیسی ، اسپانیایی ، پرتغالی ، فرانسوی ، آلمانی ، عربی - ما پول صحبت می کنیم.) 💎 استراتژی مبتنی بر سبک تجارت دزد (پرخطر و پرخاشگر بالا-روند را انتخاب کنید یا در ادغام گرفتار شوید!) 🎯 مأموریت: Sol/USD (Solana در مقابل دلار) Crypto Heist 🐂 Direction: طولانی (اما مراقب تله ها باشید - بسته ها و خرس ها در این نزدیکی هستند!) 🚀 منطقه فرار: خط ATR (منطقه سودآوری پرخطر) ⚠ هشدار: بیش از حد؟ وارونگی؟ خط پلیس در مقاومت؟ زودتر سود کسب کنید! 📈 ورود: "The Breakout Heist شروع می شود!" ماشه: منتظر باشید تا شمع نزدیک به 148.50 (MA) باشد ورودی جایگزین: توقف بالاتر از MA را بخرید یا محدودیت خرید در بازپرداخت (15M-30m TF) 🛎 هشدار را تنظیم کنید! شکست را از دست ندهید - آنها سریع اعتصاب می کنند. 🛑 ضرر را متوقف کنید: "گرفتار نشو!" Thief SL: 136.00 (2H ساختار قبلی نوسان کم) (تنظیم بر اساس خطر و اندازه لوط شما!) ⚠ هشدار: اگر این را نادیده بگیرید ، قمار می کنید - از دست دادن شما ، نه مال من. 🎯 هدف: "غارت و گزاف گویی!" 🎯 167.00 (یا اگر روند تضعیف شود زودتر فرار کنید!) 🧨 SCALPERS: فقط بازی طولانی - استفاده از دنباله دار برای قفل کردن سود! 📢 اخبار و هشدار خطر 🚨 از معاملات جدید در طول اخبار با تأثیر بالا خودداری کنید! (نوسانات هیست ها را می کشد. در صورت تبدیل بازار از توقف های دنباله دار برای محافظت از سود استفاده کنید. 💥 این هیست را تقویت کنید! (تقویت بیشتر = حملات سود بیشتر!) 👉 مانند ✅ | دنبال کنید 🚀 | به اشتراک گذاشتن 💬 نظر خود را در مورد تله یا تله نزولی نظر دهید؟ 🚀 بعدی که به زودی می آید ... با ما همراه باشید ، راهزنان! 🤑
Thief_Trader
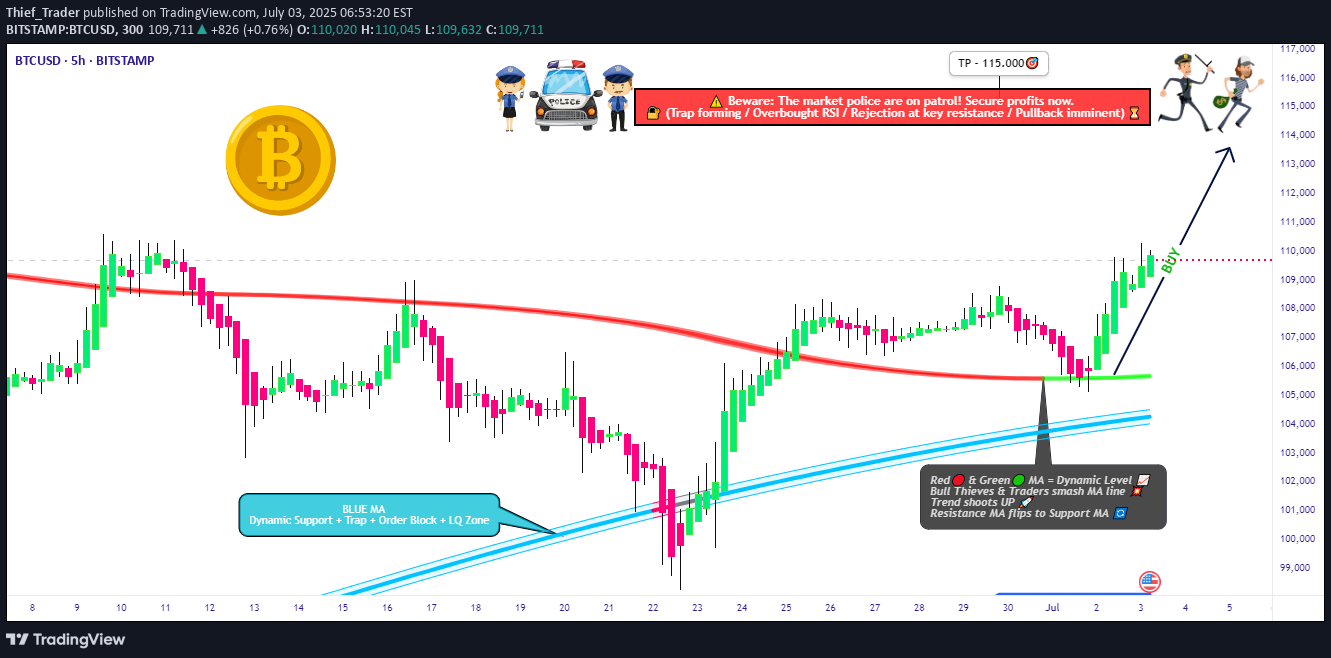
🔓 BTC/USD Crypto Vault نقض: استراتژی دزد برای سرقت طولانی (نوسان/تنظیم روز) 🌟hi! هلا اولا بنجور هالو مارهبا! 🌟 سازندگان و سارقان پول عزیز ، 🤑💰💸✈ 🚨 به مأموریت برک آوت به سبک Thief بعدی ما خوش آمدید-این بار که طاق قدرتمند BTC/USD را هدف قرار می دهد. با استفاده از یک fusion از دقت فنی و بینش سطح کلان ، ما یک طرح ورود طولانی را برای یک هیست سودآور ترسیم می کنیم. 🔑 برنامه ورود "طاق باز است!" 💥 با قیمت فعلی خرید کنید یا محدودیت خرید را در نزدیکی پایین نوسان (15 تا 30 دقیقه ورودی بازپرداخت بازپرداخت) قرار دهید. ما در حال ورود به زمان با مخفیک هستیم - دقیق از وحشت. set تنظیم ضرر را متوقف کنید مجموعه SL در نزدیکی نوسان اخیر کم است (مرجع 4H TF: 104.000 ~). بر اساس اندازه موقعیت ، اشتها و تاکتیک های چند منظوره تنظیم کنید. 🎯 هدف سود را بگیرید در صورت غرفه اقدام به قیمت ، 115.000 - یا زودتر از آن خارج شوید. وارد شوید ، بیرون بروید. کارایی کد است. 👀 اعلامیه پوست سر فقط سمت طولانی کار کنید. اگر کیف شما سنگین است ، فوراً اعتصاب کنید. اگر سبک است ، با سارقین نوسان سوار شوید. برای محافظت از کیف خود از SLS دنباله دار استفاده کنید. 📈 چرا ما صعودی هستیم حرکت بازار به نفع گاوها: مناطق بیش از حد به عنوان فریبنده عمل می کنند تله های نزولی آماده تلنگر تلاقی های کلیدی از احساسات ، تختخواب ، زنجیره ای و تجزیه و تحلیل کلان ➡ حامی پشتیبانی کامل در دسترس است. 📢 یادداشت خطر - تیز بمانید Major رویدادهای خبری = افزایش نوسانات ⚠ در طول اخبار از ورودی ها خودداری کنید. دنباله برای محافظت از سود در حال توقف است. راب هوشمند. 💖 خدمه را تقویت کنید اگر این طرح با مأموریت شما هماهنگ باشد ، hit این دکمه تقویت شده است. این تیم را سوخت می کند و با هم ، ما مانند pros سود می بریم. یک بار یک هیست. 💪🎉 🧠 آماده بمانید - برنامه Next به زودی کاهش می یابد. تا آن زمان ، Rob Safe ، Rob Smart. 🐱👤
سلب مسئولیت
هر محتوا و مطالب مندرج در سایت و کانالهای رسمی ارتباطی سهمتو، جمعبندی نظرات و تحلیلهای شخصی و غیر تعهد آور بوده و هیچگونه توصیهای مبنی بر خرید، فروش، ورود و یا خروج از بازارهای مالی نمی باشد. همچنین کلیه اخبار و تحلیلهای مندرج در سایت و کانالها، صرفا بازنشر اطلاعات از منابع رسمی و غیر رسمی داخلی و خارجی است و بدیهی است استفاده کنندگان محتوای مذکور، مسئول پیگیری و حصول اطمینان از اصالت و درستی مطالب هستند. از این رو ضمن سلب مسئولیت اعلام میدارد مسئولیت هرنوع تصمیم گیری و اقدام و سود و زیان احتمالی در بازار سرمایه و ارز دیجیتال، با شخص معامله گر است.