
RB_T
@t_RB_T

تریدر چه نمادی را توصیه به خرید کرده؟
سابقه خرید
تخمین بازدهی ماه به ماه تریدر
پیام های تریدر
فیلتر
نوع پیام
RB_T
اتریوم: سیگنال ۴ ساعته محقق شد؛ شکست قیمتی در نمودار روزانه!
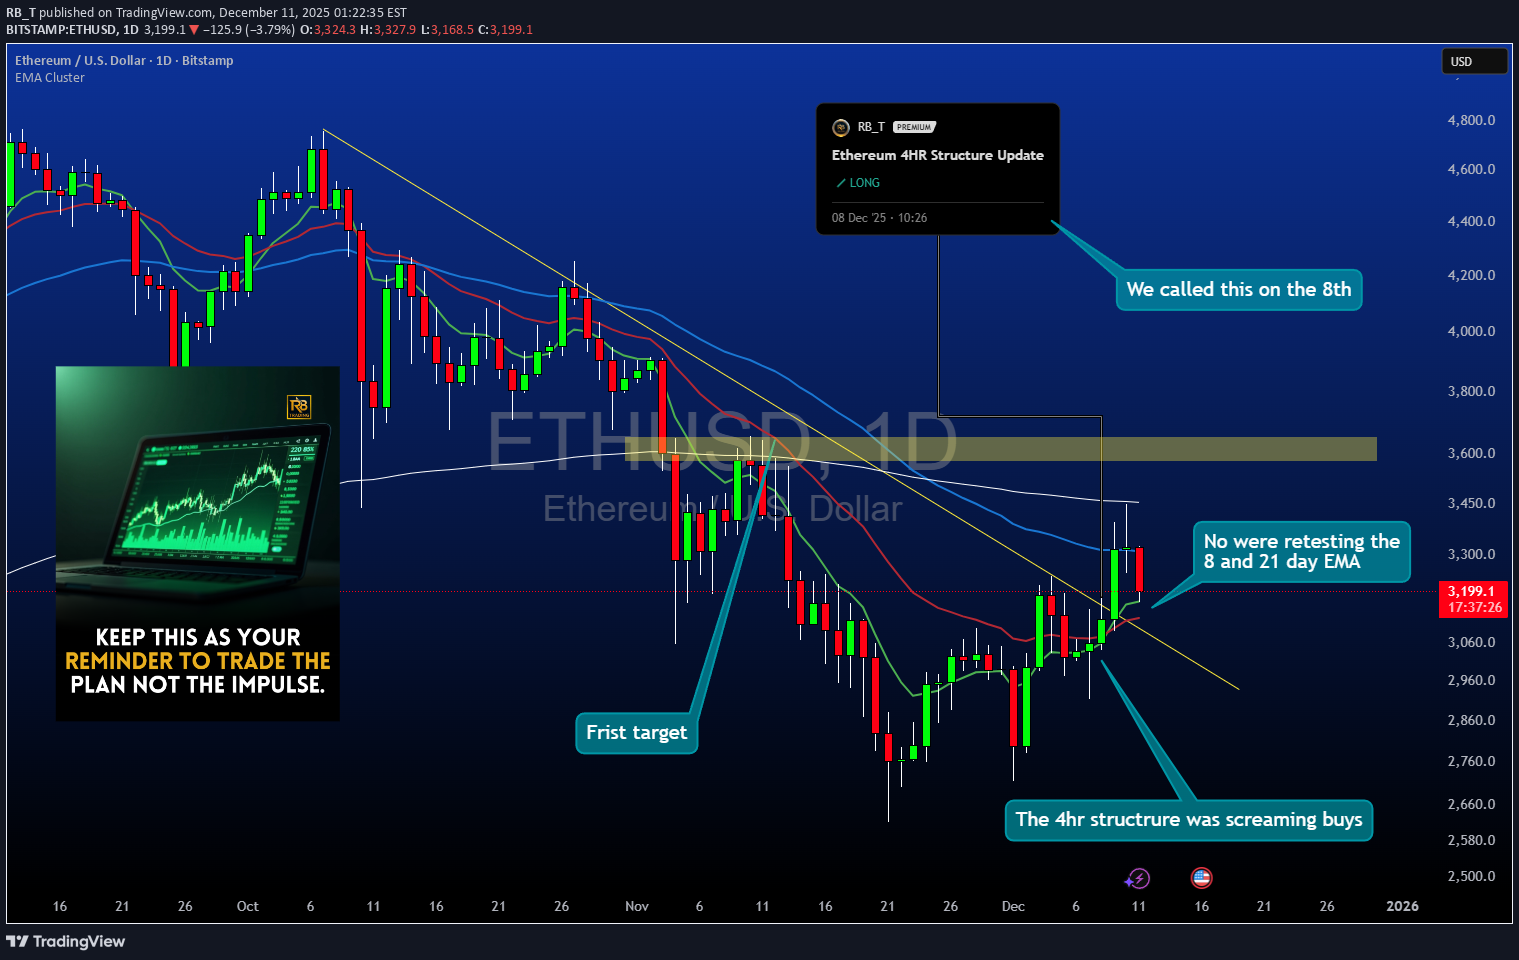
Ethereum Technical Breakout: 4-Hour Setup from December 8th Now Validated on Daily Chart Our December 8th technical call on Ethereum based on 4-hour chart structure has materialized into a clean daily timeframe breakout. This analysis reviews the original setup, examines the price action that followed, and assesses the current structural picture as ETH pushes into higher territory with confirmed momentum. 🎯 Original Setup Recap (December 8th): What We Identified: On the 4-hour chart, Ethereum was showing: Consolidation after a pullback to key support Higher lows forming during the correction phase Volume compression indicating accumulation Momentum indicators resetting from overbought conditions Critical support holding at structural levels The Call: Long position anticipation based on 4-hour structure suggesting the correction was nearing completion and continuation was probable. The setup offered defined risk below support with upside targets at previous resistance zones. Why It Mattered: The 4-hour timeframe captures intraday structure while filtering out noise from lower timeframes. When 4H patterns align with broader trend direction, they often precede significant multi-day moves that eventually appear on daily charts. 📈 What Happened Next: Price Action Validation: Following the December 8th structural read, Ethereum: Held the identified support zone without breaking down Began forming higher highs and higher lows on the 4-hour chart Broke above intermediate resistance levels with increasing volume Momentum indicators shifted from neutral to bullish Daily chart structure began reflecting the 4H anticipation The Breakout: What started as a 4-hour setup has now translated into a clean daily chart breakout. This progression from lower timeframe structure to higher timeframe confirmation is textbook technical development - the 4H provided the early signal, the daily now provides the broader validation. 📊 Daily Chart Breakdown: Current Structure: Switching to the daily timeframe reveals: Clean breakout above resistance: Previous consolidation highs have been cleared decisively Volume confirmation: Breakout occurred with expansion in volume, not on declining participation Momentum shift: Daily momentum oscillators flipping bullish after extended reset period No immediate overhead resistance: Path to next major level is relatively clear Why Daily Matters: When a 4-hour setup evolves into a daily breakout: Institutional participation typically increases (larger players operate on daily+ timeframes) The move gains credibility beyond short-term speculation Probability of continuation increases as higher timeframe traders enter Support levels become more significant (daily structure holds better than intraday) Key Observations: Breakout candle characteristics: Strong close, minimal upper wick, suggesting buying conviction Support conversion: Previous resistance now becomes support if price retests Trend alignment: Daily now confirms what 4H structure was telegraphing weeks ago 🎯 From 4-Hour Call to Daily Confirmation: The Progression: December 8th (4H): Structural setup identified - accumulation phase near support Initial Response: Price respected support, began building higher lows Intermediate Action: 4H breakout triggered, resistance levels tested Current State: Daily chart validates with clean breakout above consolidation Why This Sequence Matters: This is how professional technical analysis works: Lower timeframes provide early positioning opportunities Risk is defined based on structure (not arbitrary stops) Higher timeframes eventually confirm or reject the thesis Confirmation on daily adds conviction for position management Key Lesson: The 4-hour chart gave entry opportunity with tight risk. The daily chart now provides the validation that the trade thesis was correct. Traders who entered on 4H structure now have daily confirmation supporting continued upside. 📈 What the Daily Breakout Suggests: Bullish Implications: Next resistance target: Previous cycle highs now become the next logical objective Momentum continuation: Daily breakout with momentum often sustains for multiple sessions Support buffer: If price retraces, the breakout level should provide support Trend clarity: Daily chart removes ambiguity - structure is now clearly bullish Fibonacci Extensions: From the correction low to breakout high, Fibonacci extension targets suggest: 1.272 extension: First projected resistance 1.618 extension: Major target zone where profit-taking typically occurs 2.0 extension: Extended target if momentum remains strong These aren't guarantees but mathematical projections based on the measured move from consolidation. 🧠 Psychology of Early Entry vs. Breakout Chasing: December 8th Entry (4H Structure): Entry felt uncomfortable (price had just pulled back) Risk was defined and relatively tight Reward-to-risk was favorable (3:1 or better to first targets) Required patience through consolidation period Chasing Now (Post-Daily Breakout): Entry feels "safer" (price is rising, daily confirms) Risk has expanded significantly (stop would be much wider) Reward has compressed (already moved toward targets) Late entry often leads to getting shaken out on first retracement The Professional Approach: Buy structure on 4H when risk is defined. Use daily confirmation to hold position or add selectively, not to initiate at worse risk/reward. 📊 Current Trade Management Framework: For Those In From December 8th: Profit Taking Strategy: First reduction: At previous major resistance (book partial profits) Second reduction: At Fibonacci 1.618 extension (lock gains) Final portion: Trailing stop or 2.0 extension (maximize upside) Stop Management: Move stops to breakeven after daily breakout confirmed Trail stops below daily swing lows as new structure forms Give daily structure room - don't tighten stops based on 4H noise Position Psychology: Daily confirmation means the trade thesis was correct. Avoid the temptation to overtrade or add aggressively here. The best risk/reward was on December 8th current management is about optimization, not aggressive scaling. 📅 What's Next? Bullish Scenario: Daily breakout continues with momentum Price targets Fibonacci extensions sequentially Minor retracements find support at breakout level Volume remains elevated on green candles, diminishes on red Retest Scenario: Price pulls back to test breakout level as new support This would be healthy consolidation, not failure 4H chart may provide re-entry or add opportunity Daily structure remains intact unless breakout level fails Invalidation: Daily close back below breakout level Volume deterioration suggesting exhaustion Momentum divergence appearing on daily chart Fundamental shifts in crypto market conditions ⚠️ Risk Considerations: What Could Go Wrong: Crypto Volatility: Ethereum can experience 10-20% pullbacks even during bullish trends. Daily breakouts don't eliminate volatility - they suggest directional bias but not linear price action. Market-Wide Weakness: If Bitcoin enters correction or broader crypto sentiment shifts negative, individual coin technicals become secondary to market-wide flows. False Breakout: Daily breakouts can fail. If price closes back below the breakout level with volume, the technical picture changes and positions should be reassessed. Regulatory/Fundamental Events: Crypto markets remain sensitive to regulatory news, exchange issues, and macroeconomic factors that can override technical structure. 🏆 Key Trading Lessons from This Setup: ✅ Lower timeframes identify structure early: The 4H chart provided the early read when risk was defined ✅ Higher timeframes provide confirmation: Daily breakout validates the 4H thesis was correct ✅ Best entries feel uncomfortable: December 8th near support felt uncertain - that's when risk/reward was optimal ✅ Structure over emotion: The technical setup suggested bullish resolution despite uncertainty ✅ Patience pays: Allowing the 4H structure time to develop into daily confirmation requires discipline ✅ Manage, don't chase: Use daily confirmation for position management, not aggressive late entries 📌 Summary: Then (December 8th): 4-hour chart showing structural setup Support holding, accumulation visible Entry opportunity with defined risk Now (Current): Daily chart confirms with clean breakout Momentum supporting continued upside Original thesis validated by higher timeframe Next: Monitor daily structure for continuation Manage positions based on daily swing points Watch for retest of breakout as potential support ⚠️ Important Disclaimers: This analysis is for educational purposes and reflects a technical progression from 4-hour structure to daily confirmation. It is not financial advice or a recommendation to buy or sell Ethereum or any cryptocurrency. Cryptocurrencies are highly volatile and speculative. Daily breakouts can fail, and past performance of similar setups does not guarantee future results. The December 8th call was based on structure visible at that time - subsequent price action could have invalidated the thesis. Ethereum carries specific risks including regulatory uncertainty, technological vulnerabilities, market manipulation, and extreme volatility. Position sizing must account for potential 20-30% drawdowns even during bullish trends. This review examines what happened after a technical call, not a prediction of future price movement. Markets change, structure fails, and no technical pattern guarantees success. Always conduct independent research, manage risk appropriately, and never invest more than you can afford to lose. All cryptocurrency trading involves substantial risk of loss. ✨ Community Discussion: Did you catch the December 8th setup on the 4H chart? How do you use multi-timeframe analysis in your trading? Share your approach to transitioning from lower to higher timeframe confirmation. 📜 Read the structure. Trust the process. Manage the risk.
RB_T
Ethereum 4HR Structure Update
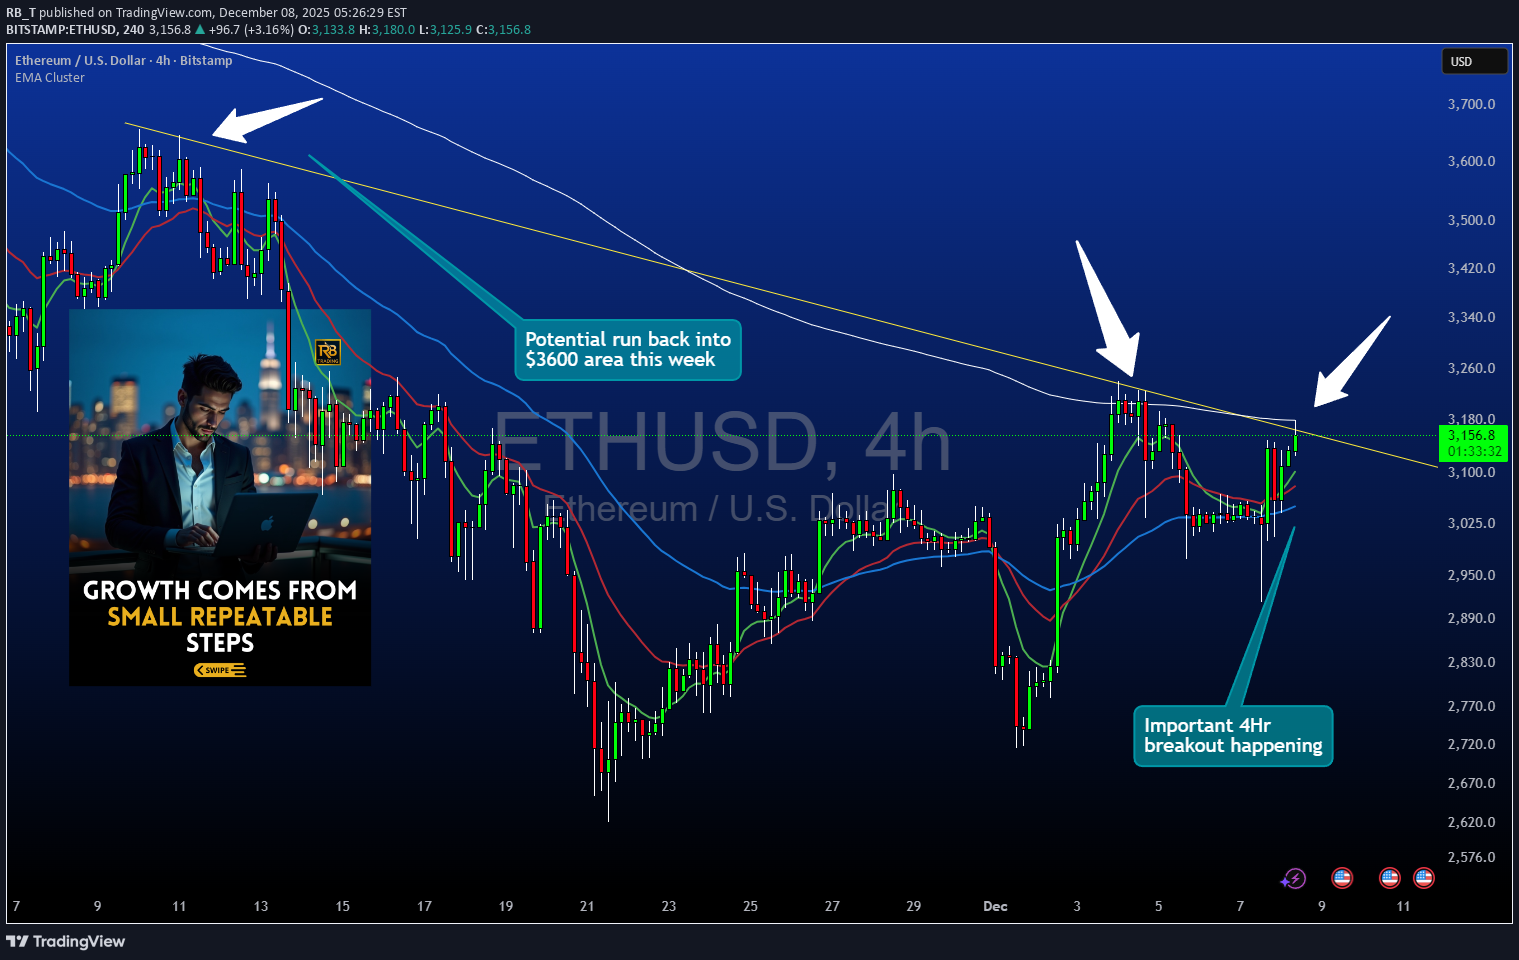
این ایده بر روی Ethereum در نمودار 4 ساعته تمرکز دارد. قیمت به خط روند نزولی نزدیک می شود که به عنوان مقاومت پویا عمل کرده است. قبل از در نظر گرفتن هر گونه تنظیمات طولانی، یک شکست و بسته تایید شده بالاتر از این خط روند ضروری است. سطوح و ساختار کلیدی • تمرکز اصلی خط روند نزولی است که هر جهش اخیر را محدود کرده است • بستن شمع کامل بالای خط روند قبل از برنامه ریزی برای ورود ضروری است • ناحیه مرجع صعودی برای این ایده نزدیک به 3600 است که در آن واکنش های قبلی رخ داده است • ابطال ها در زیر 2950 قرار می گیرند که نشان دهنده شکست در زیر پایه ساختاری اخیر است منطق ورود این تنظیم بر اساس تایید است تا پیش بینی. • در حالی که قیمت زیر خط روند باقی می ماند، هیچ ورودی نباید گرفته شود • یک بسته صعودی قوی در خارج از خط روند مورد نیاز است • بسته شدن ضعیف یا عبور از خط روند بدون تایید بدنه واجد شرایط نیست • این ایده تنها زمانی معتبر است که خط روند به طور واضح بر مبنای بسته شدن نقض شود چرا نزدیک مهم است بسته شدن خارج از خط روند نشان می دهد که فعالان بازار به جای آزمایش کوتاه، قیمت را بالاتر از ساختار نزولی پذیرفته اند. این به فیلتر شکست های کاذب کمک می کند و اتکا به نوسانات درون باری را کاهش می دهد. پارامترهای ریسک توقف ها زیر 2950 ارجاع شد زیرا move در زیر آن ناحیه نشان دهنده عدم پشتیبانی ساختاری اخیر است. منطقه 3600 به عنوان اولین نقطه مرجع صعودی بر اساس واکنش های قبلی در نمودار 4 ساعته استفاده می شود. یادداشت ها این ایده رفتار ساختاری را ارزیابی می کند و عملکرد آینده را پیش بینی نمی کند. کاربران باید سطوح را تایید کنند و قبل از انجام هر معامله، برنامه مدیریت ریسک خود را اعمال کنند.
RB_T
خیز بزرگ BNB: آیا بسته شدن هفتگی بالای ۸۷۵ دلار، مسیر ۱۱۰۰ دلار را باز میکند؟
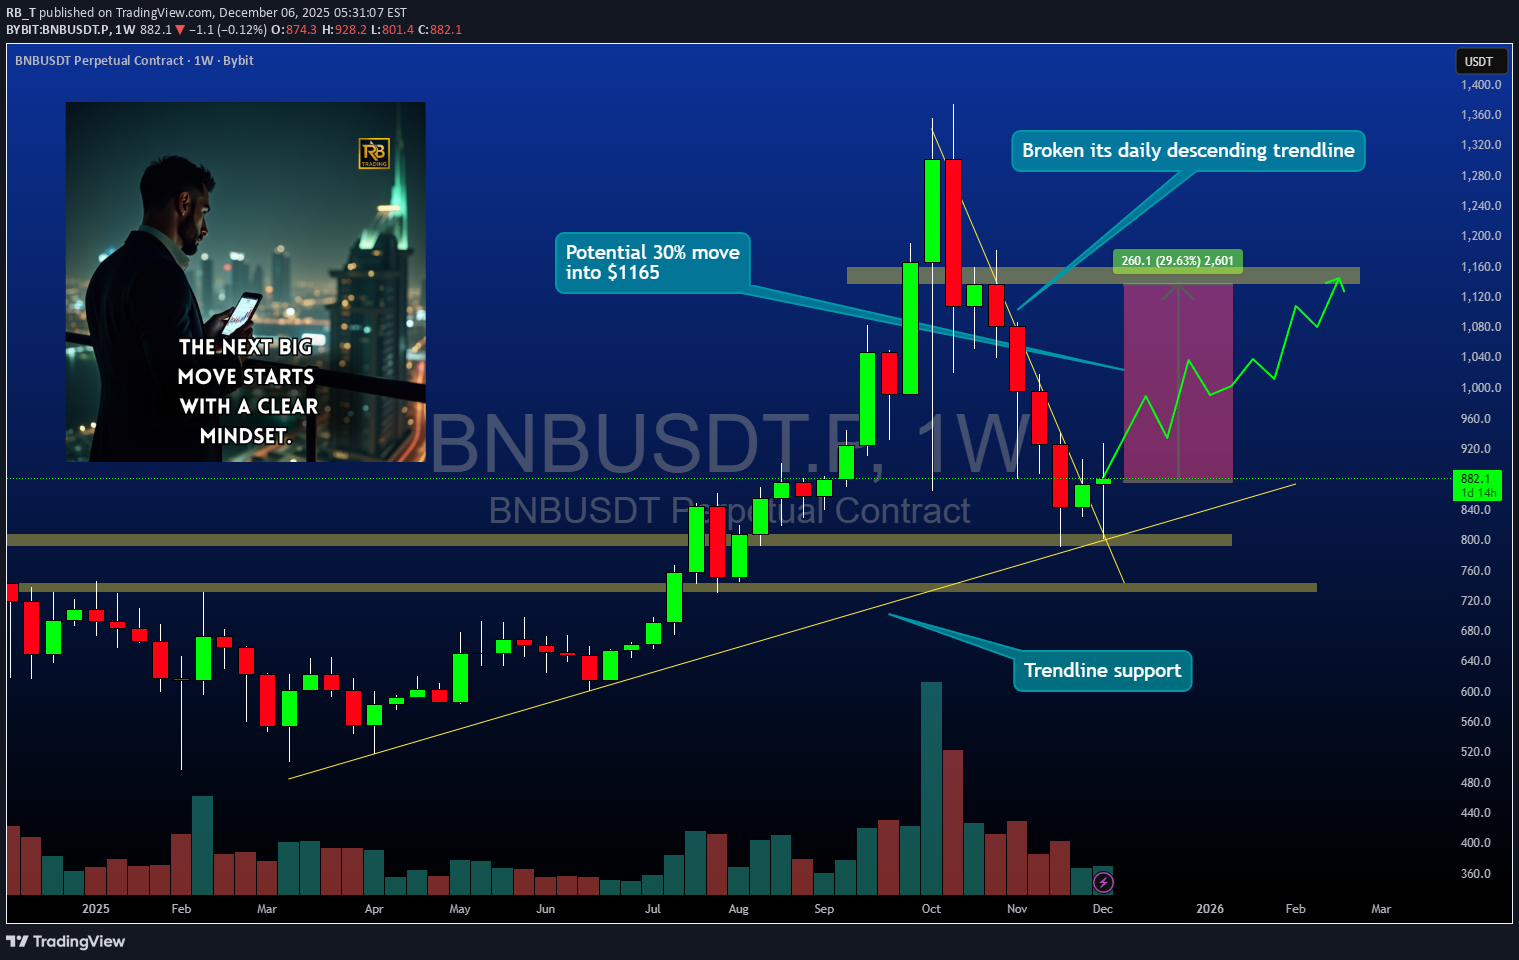
BNB Weekly Reversal Setup: $800 Demand Zone Confirmed, Sunday Close Above $875 Opens Path to $1138 Binance Coin has successfully held a critical demand zone at $800 and is now approaching a pivotal weekly candle close. A Sunday close above $875 would flip the weekly structure bullish and open a clear path to $1138 as the first major target, with potential continuation to previous cycle highs. This analysis breaks down why the $875 weekly close matters and how to approach this setup with spot allocation. 🎯 Setup Overview: Current Status: $800 demand zone held successfully Critical Trigger: Sunday weekly close above $875 First Target: $1138 (major resistance zone) Extended Target: Previous cycle highs Strategy: Tier 1 spot buy on confirmed weekly close Position Type: Spot only NO leverage recommended 📊 What's Happening Right Now: The $800 Demand Zone: BNB tested and held a massive demand zone at $800 an area where significant buying activity has historically occurred. This level represents: Previous consolidation support High-volume accumulation zone Psychological round number Multiple prior tests that held as support The fact that price bounced from $800 rather than breaking through signals strong hands are defending this level. The Weekly Candle Setup: BNB is currently forming a weekly candle that could close above $875 on Sunday. This isn't just any level it represents the pivot point between continuation of consolidation versus breakout to higher targets. Why Sunday's Close Matters: Weekly closes carry far more weight than daily closes in crypto. They represent sustained positioning across an entire week of trading, filtering out intraday manipulation and noise. A close above $875 would confirm: Demand zone at $800 was the low Buyers have control on the weekly timeframe Structure is shifting from consolidation to expansion 📈 Why $875 Is The Critical Level: Technical Significance: $875 sits at the intersection of multiple technical factors: Weekly resistance that capped prior attempts 50% retracement of recent decline Breakout level from current consolidation range Momentum shift threshold on weekly indicators Structural Flip: Below $875: Price remains in consolidation, neutral structure Above $875 (weekly close): Bullish structure confirmed, targets open Historical Behavior: BNB has shown respect for weekly closes throughout its history. When it breaks key levels on the weekly timeframe and holds them through the Sunday close, sustained moves typically follow. 🎯 The Target Structure: First Target: $1138 Represents next major resistance zone ~30% upside from $875 trigger level Previous consolidation area that will attract profit-taking Logical zone for first position reduction Extended Target: Previous Cycle Highs If $1138 breaks cleanly, path opens to prior all-time high zones ~50-60% additional upside potential from $1138 Requires sustained bullish momentum and favorable crypto market conditions Final target for remaining position Why These Levels: Based on: Historical support/resistance zones Volume profile analysis showing concentration at these prices Fibonacci extension projections Previous cycle behavior patterns 🛡️ The Tier 1 Spot Buy Strategy: What Is a "Tier 1" Buy: This represents a high-conviction allocation one of your primary positions rather than a small speculative bet. Tier 1 positions get larger capital allocation because they meet multiple criteria: Strong technical structure (demand zone held) Clear trigger (weekly close above $875) Defined risk (invalidation below $800) Favorable reward (30%+ to first target) The Sunday Close Rule: Entry trigger: Sunday weekly candle close above $875 If BNB closes at $876+ on Sunday: Execute spot buy If BNB closes at $874 on Sunday: No entry, wait for next opportunity This removes emotion—the market either triggers the setup or it doesn't Why This Discipline Matters: Entering before the weekly close risks buying a level that fails. Entering after confirmation means you might pay $5-10 more, but you have objective validation that the structure has flipped. This is the difference between gambling and strategic positioning. ⚠️ Why SPOT ONLY - NO LEVERAGE: Crypto Volatility Is Extreme: BNB can drop 15-20% in a single day even during bull markets. Leverage amplifies this into account-ending losses. Spot positions can weather volatility; leveraged positions cannot. Weekly Timeframe = Long Hold: From $875 to $1138 could take weeks or months. Leverage costs accumulate, and funding rates can erode position value even if directionally correct. Sleep-at-Night Capital: Spot allocation allows you to hold through inevitable pullbacks without liquidation risk. If BNB dips to $850 after entry at $880, spot holders are fine—leveraged traders are liquidated. Preservation Over Greed: The target offers 30-50%+ gains on spot. That's excellent risk-adjusted return without needing leverage multiplication. Protecting capital always supersedes maximizing gains. 📊 Technical Confluence: Demand Zone at $800: High-volume accumulation zone that has held multiple tests. This level represents where institutional and whale accumulation likely occurred. Weekly Structure: Higher lows forming on the weekly chart. A close above $875 would establish a higher high, confirming uptrend structure. Momentum Indicators: Weekly momentum oscillators (RSI, MACD) are turning bullish. A close above $875 would confirm the momentum shift. Volume Behavior: The bounce from $800 occurred with increasing volume, suggesting accumulation rather than dead-cat bounce behavior. 🧠 Trader Psychology: Why Most Will Miss This: Waiting for "Better" Prices: Many will wait for a pullback to $850 after the $875 break. By then, momentum has shifted and risk/reward has compressed. The best entry is at the trigger, not after confirmation proves correct. Fear of Being Early: What if Sunday closes at $873? Then you don't enter—simple. But fear of "what if it fails" prevents traders from having a plan for "what if it works." Wanting Certainty: No setup is guaranteed. But a weekly close above $875 after holding $800 demand offers high-probability structure. Waiting for 100% certainty means waiting forever. Leverage Temptation: "If I use 3x leverage, I can make 90% instead of 30%!" This thinking blows up accounts. The patient spot holder survives to compound gains over time. 📈 Why BNB for Spot Portfolio: Utility and Ecosystem: Native token of Binance, the world's largest crypto exchange Used for trading fee discounts (real utility, not speculation) Powers Binance Smart Chain (BSC) ecosystem Regular token burns reduce supply over time Market Position: BNB consistently ranks in top 5 cryptocurrencies by market cap. Established network effects and institutional recognition provide relative stability compared to smaller-cap alts. Exchange Token Premium: During bull markets, exchange tokens often outperform as trading activity increases. More volume = more BNB usage for fees = increased demand. Risk Factors: Centralization concerns (Binance-controlled) Regulatory scrutiny of Binance exchange Price correlates heavily with Binance's business success Broader crypto market conditions affect all assets 📅 Timeframe and Expectations: Entry Timing: Decision point: Sunday's weekly candle close. No entry before confirmation, regardless of how price behaves during the week. Target Timeline: $1138 could take 4-8 weeks if momentum sustains Previous highs could take 3-6 months if bullish cycle continues This is a position trade, not a swing trade Volatility Tolerance: Expect 10-15% pullbacks even if the setup works. Spot positions can hold through these; it's why leverage is inappropriate for this timeframe. 🏆 Professional Position Management: Entry Execution: Wait for Sunday close above $875 (no guessing, no front-running) Execute spot buy Monday morning Stop loss below $800 (demand zone invalidation) Position Sizing: Tier 1 allocation: 3-5% of portfolio for high-conviction crypto position Size according to distance to stop ($875 entry - $800 stop = $75 risk) Calculate position size so $75/coin = 1-2% total portfolio risk Profit Taking: First reduction (1/3): $1138 target hit Second reduction (1/3): $1300-1400 if momentum continues Final position (1/3): Previous highs or trailing stop This staged exit removes emotion and locks gains progressively. 📊 Risk Management Framework: Stop Loss Placement: Below $800 demand zone. If this level breaks on a weekly close, the bullish thesis is invalidated and the position must be exited. Risk Per Position: Entry at $875, stop at $800 = $75 risk per coin If you can tolerate $1000 portfolio risk, buy ~13 BNB ($875 × 13 = $11,375 position) If BNB hits stop at $800, loss = $75 × 13 = $975 (acceptable risk) Reward Calculation: To $1138: $263 gain per coin × 13 coins = $3,419 profit (3.4:1 reward/risk) To $1400: $525 gain per coin × 13 coins = $6,825 profit (6.8:1 reward/risk) This is why leverage isn't needed—spot returns are excellent with defined risk. ⚠️ What Could Go Wrong: Sunday Close Below $875: Setup doesn't trigger. No entry, no risk, wait for next opportunity. This is a feature, not a bug. False Breakout: Weekly close above $875 but fails the following week. Stop loss at $800 protects capital with controlled loss. Broader Crypto Weakness: If Bitcoin or Ethereum enter bearish trends, BNB will likely follow regardless of its individual structure. Binance-Specific Events: Regulatory actions against Binance exchange, leadership changes, or business disruptions could cause rapid price declines. Demand Zone Break: If price closes below $800 on weekly basis, the entire bullish thesis fails and position should be exited immediately. 📌 Key Takeaways: ✅ $800 demand zone held: Multiple tests defended successfully—strong hands accumulating. ✅ Sunday close above $875 is the trigger: Objective, emotion-free entry rule. Market either confirms or doesn't. ✅ $1138 first target offers 30% upside: Favorable reward with defined $75 risk to $800 stop. ✅ Tier 1 allocation appropriate: High-conviction setup deserves meaningful position size with proper risk management. ✅ SPOT ONLY absolutely no leverage: Volatility, timeframe, and risk management all dictate spot allocation for this setup. ⚠️ Important Disclaimers: This analysis is for educational purposes and reflects a technical view based on demand zones, weekly timeframe structure, and risk/reward analysis. It is not financial advice or a recommendation to buy or sell BNB or any cryptocurrency. Cryptocurrencies are highly speculative and volatile. BNB can decline 20-30% even if the weekly close trigger occurs. The $800 demand zone could fail, invalidating the entire setup. Binance Coin carries specific risks related to Binance exchange operations, regulatory scrutiny, and centralization concerns. Position sizing must account for these crypto-specific and platform-specific risks. The Sunday close rule is a disciplined approach, not a guarantee of success. Market conditions can change rapidly, and technical setups can fail even with proper structure. Only invest capital you can afford to lose completely. Crypto allocation should represent high-risk portion of a diversified portfolio. Never use leverage on volatile assets unless you fully understand and accept the risk of total loss. Always conduct independent research and consider consulting a financial professional. All cryptocurrency investing involves substantial risk of loss. ✨ Sunday Decision Point: Will BNB close above $875 this Sunday? If so, are you prepared with your spot buy plan? Share your thoughts on the setup in the comments. 📜 Wait for structure. Execute with discipline. Spot only.
RB_T
اتریوم بالای 3000 دلار تثبیت شد: مسیر صعودی تا 7160 دلار آغاز شده است؟
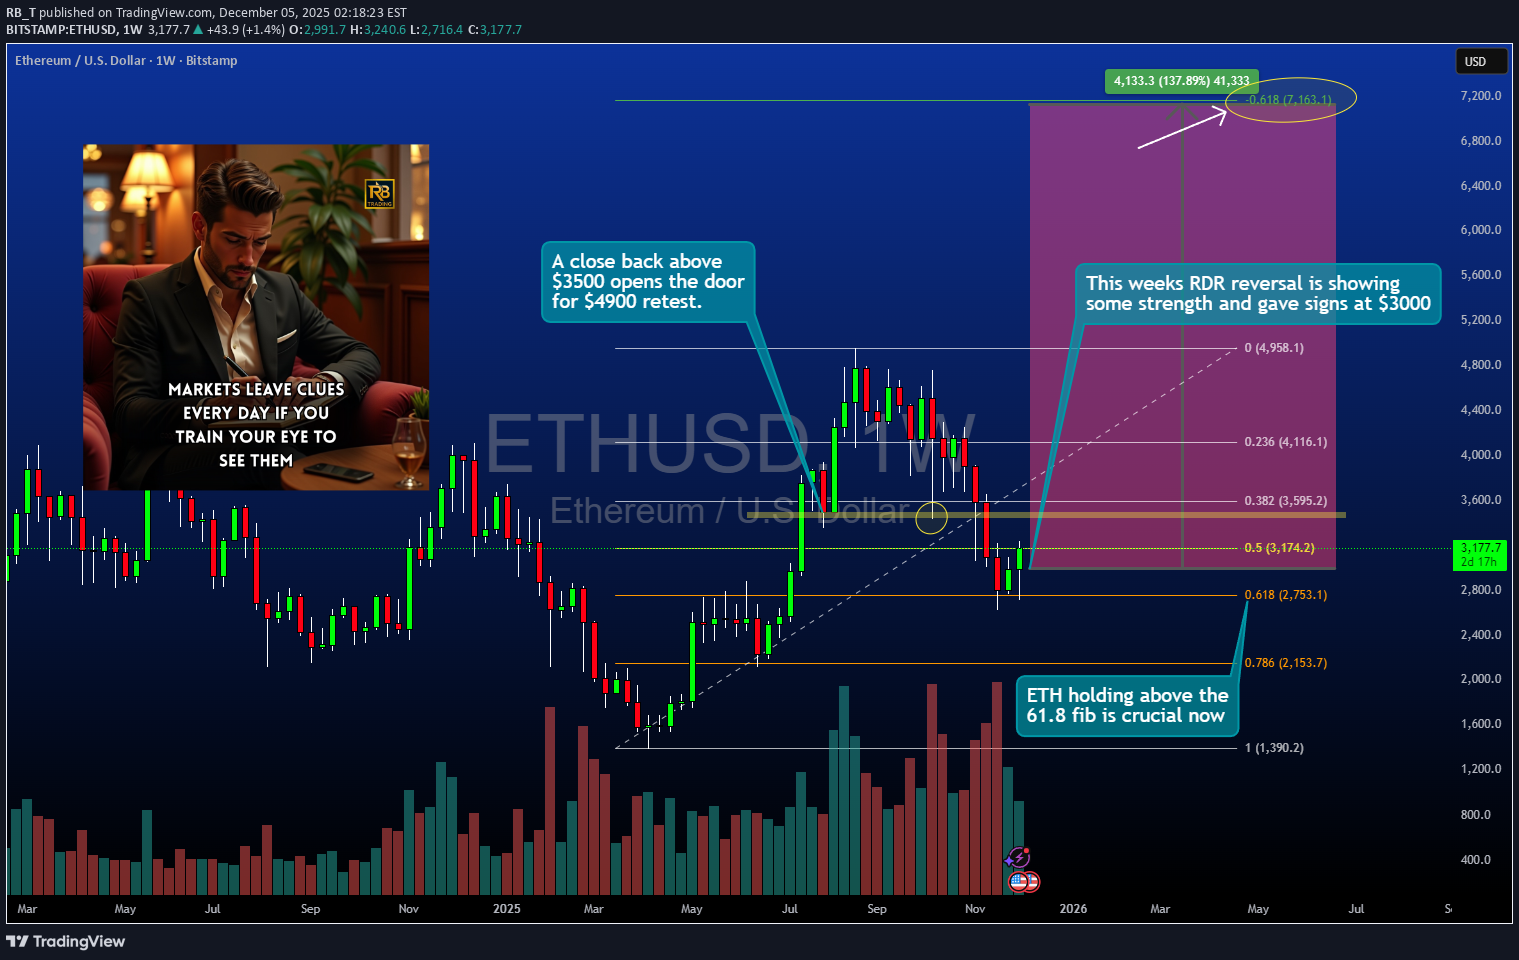
Ethereum Structural Reversal Complete: Weekly Candle Confirms $3000+ Hold, Targeting $4900 with $7160 Extension Ethereum has completed a significant structural reversal with weekly candle confirmation above the critical $3000 psychological level. The 0.618 Fibonacci retracement has held on the weekly timeframe, creating a multi-month setup targeting previous highs at $4900, with extended targets reaching the 1.618 Fibonacci extension at $7160. 🎯 Setup Overview: Current Status: Weekly bullish reversal confirmed above $3000 Critical Level: $3500 close needed to confirm continuation Intermediate Target: $4900 (previous cycle highs) Extended Target: $7160 (1.618 Fibonacci extension) Position Type: Spot portfolio addition for long-term hold 📊 What Just Happened: The Weekly Flip: Ethereum's weekly candle closed decisively above $3000, marking the first sustained hold above this psychological level after months of consolidation and testing. This isn't a wick or a brief spike it's a confirmed close on the weekly timeframe, which carries significantly more weight than intraday or daily moves. The 0.618 Support: The 0.618 Fibonacci retracement level (calculated from cycle lows to previous highs) has held throughout the recent consolidation period. This golden ratio level marks where deep corrections in bull markets typically find support before resuming uptrends. Momentum Shift: Weekly momentum indicators have flipped from bearish to bullish. The reversal isn't just price it's confirmed by: Volume expansion on the breakout Momentum oscillators crossing into bullish territory Market structure shifting to higher lows 📈 Why $3500 Is The Key Level: The Gate to Higher Prices: A weekly close above $3500 would accomplish several technical objectives: Break above intermediate resistance that capped prior rallies Confirm the $3000 level as support rather than temporary bounce Open clear path to retest previous highs at $4900 Signal institutional accumulation phase is complete Historical Context: $3500 previously acted as both support (before the decline) and resistance (during recovery attempts). A clean break and hold above this level represents role reversal—former support becomes resistance becomes support again. Why Weekly Matters: Daily closes can be manipulated or result from short-term volatility. Weekly closes represent sustained conviction from market participants and institutional positioning that persists across multiple trading sessions. 🎯 The Target Structure: Phase 1: $4900 (Previous Highs) Represents the prior cycle peak ~62% upside from current $3000 level Major psychological resistance where profit-taking will occur First logical target for position reduction Phase 2: $7160 (1.618 Fibonacci Extension) Long-term extension target based on geometric progression Represents 138% upside from $3000 Aligns with potential new cycle highs Final target for remaining position Why These Targets: Not arbitrary price predictions geometric extensions based on: Historical price structure Fibonacci ratios that have guided ETH throughout its history Measured moves from confirmed support levels Previous cycle behavior patterns 📊 Technical Confluence: Weekly 0.618 Fibonacci: This deep retracement level held as support, indicating strong hands accumulated the pullback. When 0.618 holds, the probability of continuation to previous highs increases significantly based on historical crypto cycles. $3000 Psychological Level: Round numbers matter in crypto. $3000 represents a major psychological threshold that attracts both retail and institutional attention. Holding above this level shifts sentiment. Volume Confirmation: The move above $3000 occurred with increasing volume, suggesting accumulation from larger players rather than retail FOMO. Sustainable moves require volume validation. Market Structure: Higher lows are now establishing on the weekly chart. This is textbook uptrend structure after a corrective phase completes. 🛡️ Spot Portfolio Addition Strategy: Why "Spot" Matters: This isn't a leveraged trade or short-term speculation. This is spot accumulation for a multi-month to multi-year position. Key differences: No liquidation risk Can weather volatility without forced exits Designed to capture structural moves, not daily swings Appropriate for long-term asymmetric bet on crypto adoption Position Sizing: Crypto allocation should be sized according to: Personal risk tolerance (typically 5-10% of portfolio max) Ability to withstand 30-50% drawdowns without panic Long-term conviction in Ethereum's utility and adoption Understanding this is a high-risk, high-reward allocation Entry Approach: Primary entry: Current $3000+ zone (confirmed support) Additional entry: Pullback to $3200-3300 if opportunity presents Final add: On confirmed break above $3500 (momentum confirmation) This staged approach improves average entry while maintaining conviction. 📈 Why Ethereum for Long-Term Hold: Fundamental Backdrop: Ethereum 2.0 transition to proof-of-stake complete Growing DeFi ecosystem with real utility NFT and tokenization infrastructure Institutional adoption increasing (ETFs, corporate treasury) Deflationary tokenomics post-EIP-1559 Market Position: ETH represents the second-largest cryptocurrency by market cap with established network effects, developer activity, and institutional recognition. Risk Acknowledgment: Crypto remains highly speculative and volatile. Regulatory uncertainty, technological risks, and market sentiment shifts can cause dramatic price swings unrelated to technical structure. 🧠 Why Most Will Miss This Setup: Fear from Past Pain: Many traders were hurt during the drawdown from previous highs. That emotional scar makes re-entry uncomfortable precisely when risk/reward is most favorable. Waiting for "Confirmation": By the time $4000 or $4500 "confirms" the move, the best risk/reward is gone. Entry at $3000 with $2700 stop offers far superior asymmetry than entry at $4000 with $3500 stop. Disbelief After Consolidation: Long consolidation periods create disinterest. When breakouts finally occur, many aren't watching anymore yet these are often the highest-probability setups. Recency Bias: Recent sideways action makes traders assume more sideways action. Weekly timeframe reversal suggests the character of price action is changing. 📊 Fibonacci Extensions Explained: Why They Guide Long-Term Moves: Fibonacci extensions (1.272, 1.618, 2.618) project where impulse waves typically complete based on the size of previous moves. The $7160 target (1.618 extension) isn't random—it's a mathematical projection. Historical Validation: Throughout crypto history, major bull moves have repeatedly respected these extension levels. Bitcoin, Ethereum, and other major assets have demonstrated this pattern across multiple cycles. How to Use Them: Identify completed corrective structure (0.618 support held) Measure from correction low to breakout high Project extensions for potential targets Use these as profit-taking zones, not guaranteed destinations 📅 Timeframe Expectations: Multi-Month Position: From $3000 to $4900 could take 3-6 months depending on momentum and broader crypto market conditions. This isn't a swing trade—it's a position trade. From $4900 to $7160: If achieved, this extension could take 6-12+ months and likely requires favorable macroeconomic conditions and continued crypto adoption narratives. Volatility Acceptance: Expect 15-25% pullbacks even within a bull move. Spot positions can weather this; leveraged positions cannot. This is why spot allocation matters. ⚠️ Risk Factors: Crypto Volatility: 30-50% drawdowns are normal in crypto, even during bull markets. Position sizing must accommodate this reality without forcing emotional exits. Regulatory Uncertainty: Government actions on crypto regulation, particularly in major markets like the US and EU, can cause rapid sentiment shifts. Macro Environment: Crypto correlates with risk assets. Fed policy, recession fears, and liquidity conditions affect crypto prices significantly. Technical Failure: If Ethereum closes back below $2700 on a weekly basis, the 0.618 support thesis breaks and the bullish structure is compromised. This requires disciplined reassessment. $3500 Rejection: Price could fail at $3500 and consolidate longer before attempting higher targets. Patience required if this scenario plays out. 🏆 The Long-Term Investor Approach: They Buy Structure, Not Hype: The weekly 0.618 hold + $3000 breakout provides objective structure. No need for hopium just probability-based positioning. They Size Appropriately: 5-10% crypto allocation allows exposure to asymmetric upside while containing downside to manageable levels if thesis fails. They Think in Cycles: Crypto moves in multi-year cycles. Current positioning is for the next expansion phase, not next week's price action. They Scale Out at Targets: Reduce 1/3 at $4900 (books significant profit, removes emotion) Reduce 1/3 at $5800-6000 (locks more gains if extension occurs) Final 1/3 at $7160 or trailing stop (maximizes upside while protecting capital) 📌 Key Takeaways: ✅ Weekly confirmation matters: Daily noise is filtered out; weekly close above $3000 signals structural change. ✅ 0.618 support held: This Fibonacci level has historically marked the end of corrections in crypto bull markets. ✅ $3500 is the gateway: Close above this level opens clear path to retest $4900 highs with minimal resistance. ✅ $7160 represents geometric extension: Not speculation mathematical projection based on Fibonacci ratios that have guided ETH historically. ✅ Spot allocation appropriate: Long timeframe, high volatility, and asymmetric potential make this a spot hold, not a leveraged trade. ⚠️ Important Disclaimers: This analysis is for educational purposes and reflects a technical view based on weekly timeframe structure, Fibonacci analysis, and crypto market cycles. It is not financial advice or a recommendation to buy or sell Ethereum or any cryptocurrency. Cryptocurrencies are highly speculative and volatile. Price can drop 30-50% in days regardless of technical structure. The $7160 target represents a mathematical extension, not a guaranteed destination. Regulatory risk, technological vulnerabilities, and market manipulation are inherent to crypto markets. Past cycle behavior does not guarantee similar patterns will repeat. The 0.618 support could fail. If Ethereum closes below $2700 on a weekly basis, the bullish thesis is compromised and requires immediate reassessment. Only invest capital you can afford to lose completely. Crypto allocation should be sized as high-risk, high-reward portion of diversified portfolio. Consider consulting a financial professional and understand the technology and risks before investing. All cryptocurrency investing involves substantial risk of loss. ✨ Join the Discussion: Are you accumulating Ethereum at these levels? How do you approach spot crypto allocation in your portfolio? Share your perspective in the comments. 📜 Buy structure. Think in cycles. Hold with conviction.
RB_T
نقشه راه بیت کوین: بازی فیبوناچی ساعتی برای رسیدن به اهداف قیمتی دقیق!
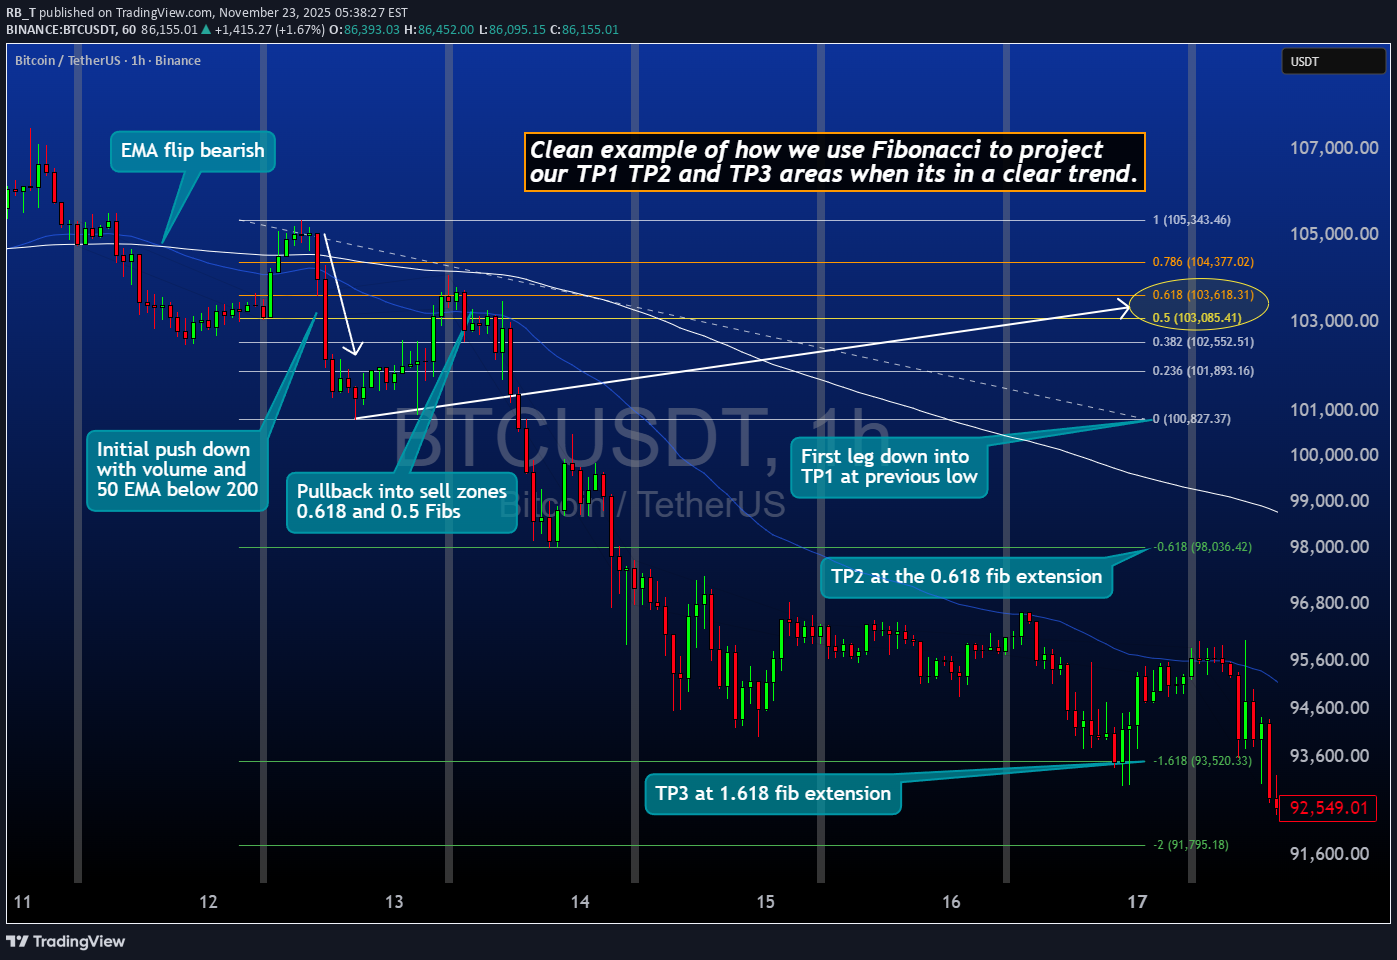
نمونهای واضح از اینکه چگونه در روندی مشخص، از فیبوناچی برای ترسیم مناطق حد سود (TP1، TP2 و TP3) استفاده میکنیم. ✓ پولبک با ساختار بازار همتراز میشود. ✓ موج محرک (Impulse leg) لنگر فیب را تثبیت میکند. ✓ سطوح امتدادی (Extensions) دقت هر هدف را مشخص میکنند. ✓ روند دستنخورده باقی میماند در حالی که فروشندگان سطوح را در مینوردند. تحلیلی عالی از اینکه چگونه قیمت به مناطق فیبوناچی در تایمفریمهای پایینتر واکنش نشان میدهد.
RB_T
تحلیل تکنیکال اتریوم: آیا حمایت 0.786 کف جدید است؟ (نشانه خستگی در شاخص DeM)
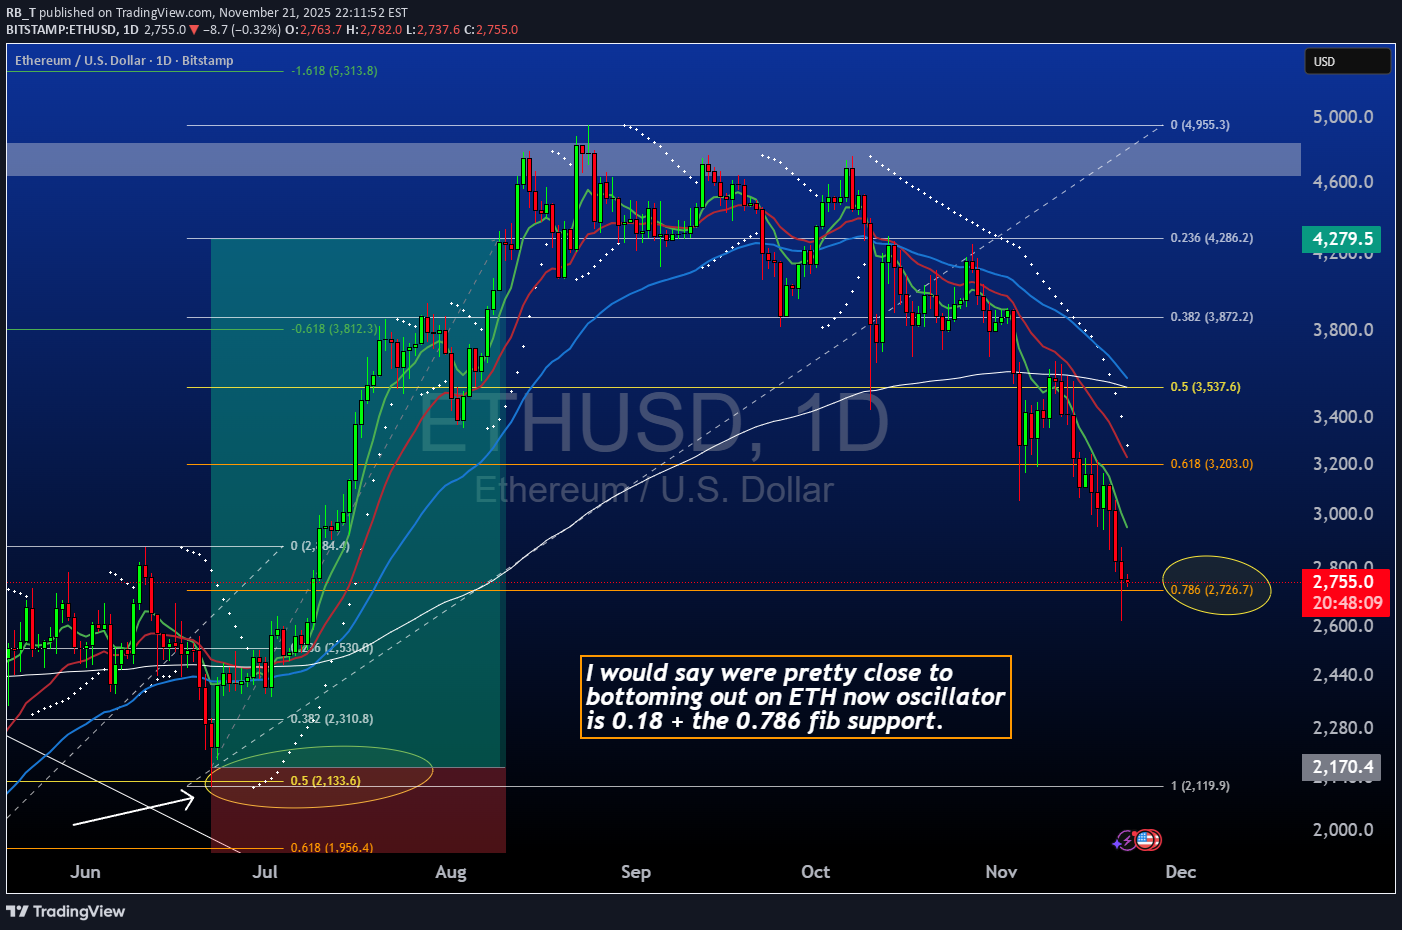
<۰> در حال فشار آوردن به یک خوشه حمایتی <۱> است که از کف نوسانی جولای ۲۰۲۵ تشکیل شده و قرائتهای اندیکاتور RB DeM بالاخره در حال رسیدن به محدوده اشباع هستند. مقدار DeM که نزدیک ۰.۱۸ قرار دارد، با اصلاح (ریتریسمنت) ۰.۷۸۶ کل حرکت صعودی جولای همسو میشود و این یک ناحیه واکنش با احتمال بالا ایجاد میکند. ✓ اندیکاتور RB DeM نشاندهنده اشباع <۲> ✓ قیمت در حال لمس فیبوناچی ۰.۷۸۶ از چرخه جولای ۲۰۲۵ ✓ ساختار در حال نزدیک شدن به سطحی است که معمولاً بازیگران بزرگ مجدداً بارگیری میکنند. اگر خریداران از این ناحیه دفاع کنند، چرخش بعدی به سمت بالا میتواند به سرعت شکل بگیرد. من منتظرم که ستاپهای نوسانی RB من <۳> به محض تغییر مومنتوم، فعال شوند. تحلیل کامل چند-تایمفریم و ستاپهای هفتگی در خبرنامه من موجود است. <۴> در پروفایل.
RB_T
$AAPL needs to clear 225-226
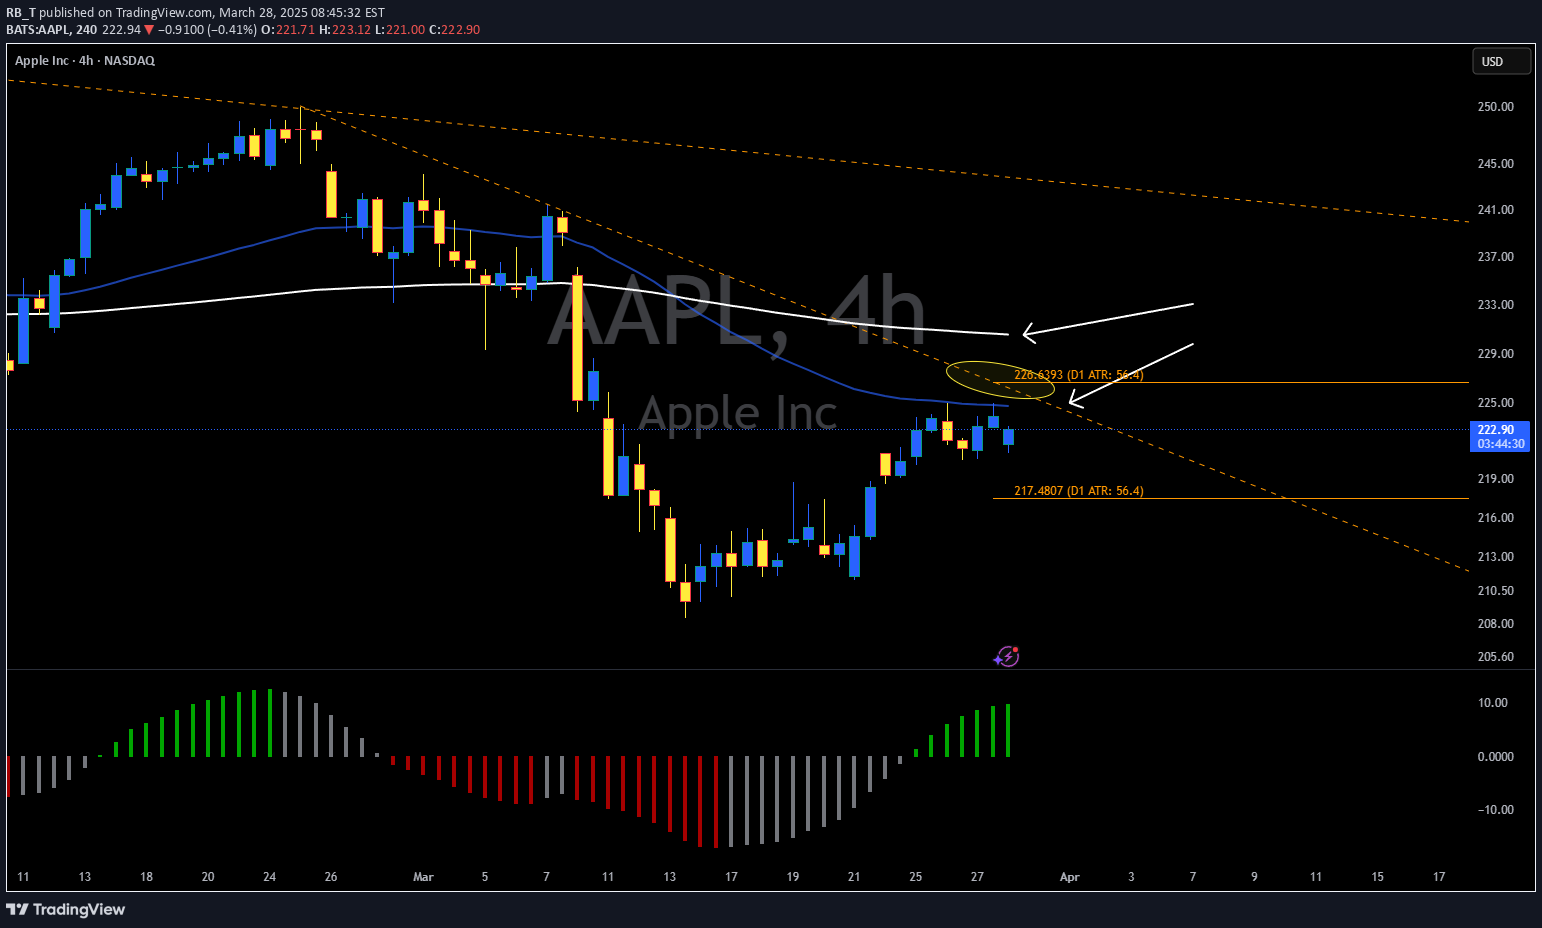
AAPL باید 225-226 را پاک کند تا گاوها واقعاً روز را به بازی خود برسانند
RB_T
What stocks are you looking to trade this week ?
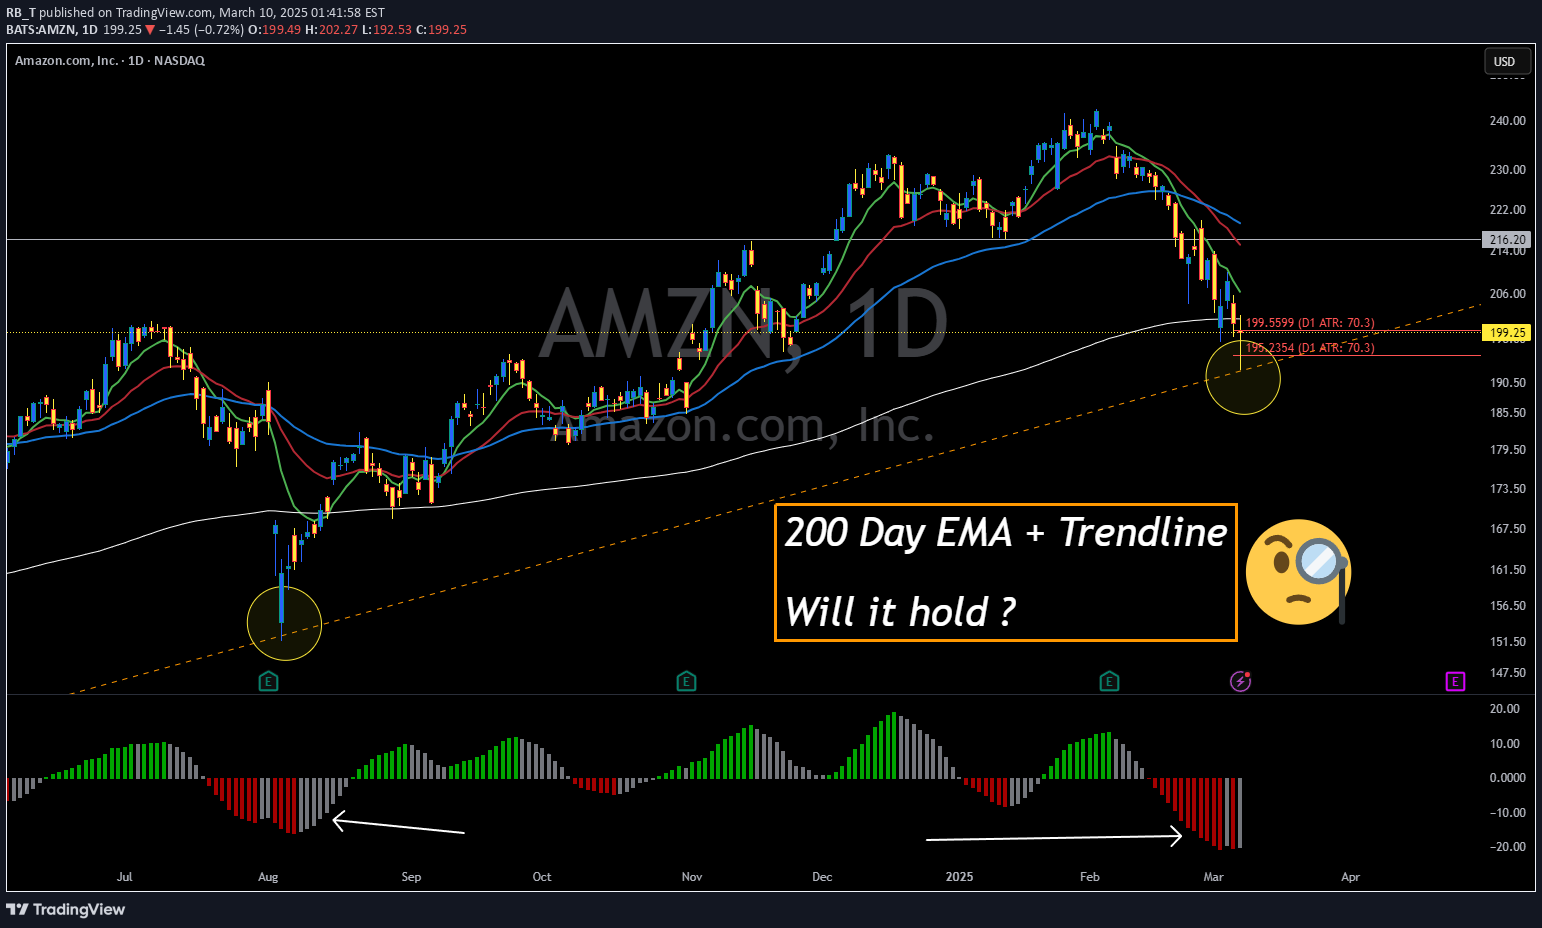
amzn - منطقه کلیدی برای تماشای! 👀 amzn در حال حاضر در یک منطقه جامد برای حرکات بالقوه است. ✅ سطح پشتیبانی قوی نگه داشتن ثابت ✅ صعود ممکن است زیرا بازار به اخبار واکنش نشان می دهد ✅ ایده آل برای نوسان معامله گران به دنبال سرمایه گذاری این هفته به دنبال تجارت چه سهام هستید؟
سلب مسئولیت
هر محتوا و مطالب مندرج در سایت و کانالهای رسمی ارتباطی سهمتو، جمعبندی نظرات و تحلیلهای شخصی و غیر تعهد آور بوده و هیچگونه توصیهای مبنی بر خرید، فروش، ورود و یا خروج از بازارهای مالی نمی باشد. همچنین کلیه اخبار و تحلیلهای مندرج در سایت و کانالها، صرفا بازنشر اطلاعات از منابع رسمی و غیر رسمی داخلی و خارجی است و بدیهی است استفاده کنندگان محتوای مذکور، مسئول پیگیری و حصول اطمینان از اصالت و درستی مطالب هستند. از این رو ضمن سلب مسئولیت اعلام میدارد مسئولیت هرنوع تصمیم گیری و اقدام و سود و زیان احتمالی در بازار سرمایه و ارز دیجیتال، با شخص معامله گر است.