تحلیل تکنیکال RB_T درباره نماد ETH : توصیه به خرید (۱۴۰۴/۹/۲۰)

اتریوم: سیگنال ۴ ساعته محقق شد؛ شکست قیمتی در نمودار روزانه!
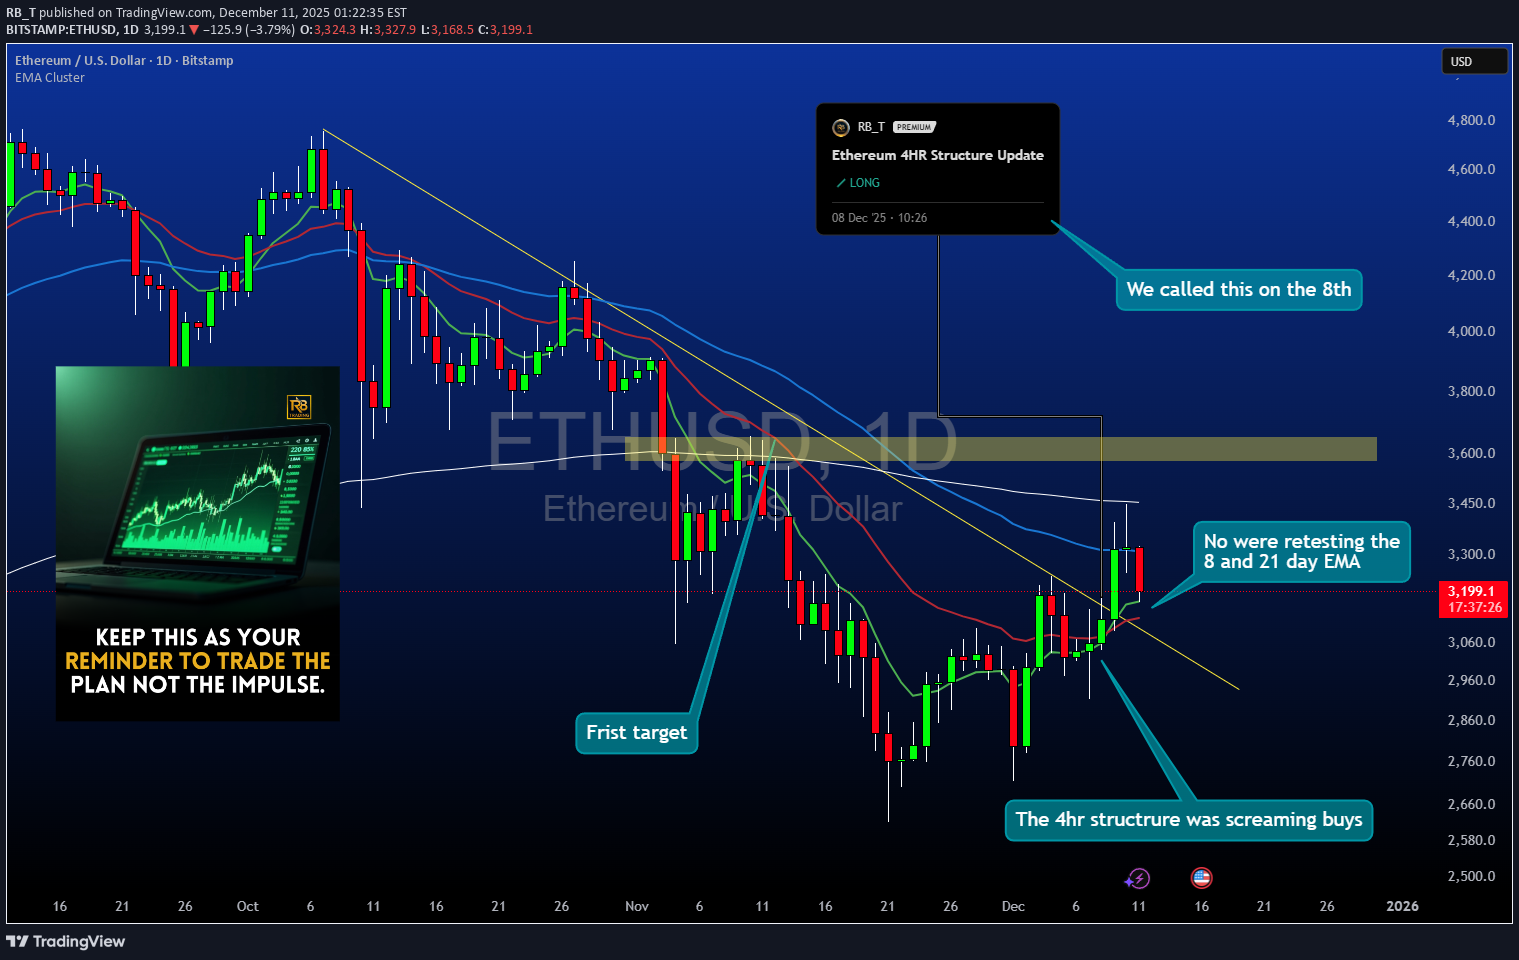
Ethereum Technical Breakout: 4-Hour Setup from December 8th Now Validated on Daily Chart Our December 8th technical call on Ethereum based on 4-hour chart structure has materialized into a clean daily timeframe breakout. This analysis reviews the original setup, examines the price action that followed, and assesses the current structural picture as ETH pushes into higher territory with confirmed momentum. 🎯 Original Setup Recap (December 8th): What We Identified: On the 4-hour chart, Ethereum was showing: Consolidation after a pullback to key support Higher lows forming during the correction phase Volume compression indicating accumulation Momentum indicators resetting from overbought conditions Critical support holding at structural levels The Call: Long position anticipation based on 4-hour structure suggesting the correction was nearing completion and continuation was probable. The setup offered defined risk below support with upside targets at previous resistance zones. Why It Mattered: The 4-hour timeframe captures intraday structure while filtering out noise from lower timeframes. When 4H patterns align with broader trend direction, they often precede significant multi-day moves that eventually appear on daily charts. 📈 What Happened Next: Price Action Validation: Following the December 8th structural read, Ethereum: Held the identified support zone without breaking down Began forming higher highs and higher lows on the 4-hour chart Broke above intermediate resistance levels with increasing volume Momentum indicators shifted from neutral to bullish Daily chart structure began reflecting the 4H anticipation The Breakout: What started as a 4-hour setup has now translated into a clean daily chart breakout. This progression from lower timeframe structure to higher timeframe confirmation is textbook technical development - the 4H provided the early signal, the daily now provides the broader validation. 📊 Daily Chart Breakdown: Current Structure: Switching to the daily timeframe reveals: Clean breakout above resistance: Previous consolidation highs have been cleared decisively Volume confirmation: Breakout occurred with expansion in volume, not on declining participation Momentum shift: Daily momentum oscillators flipping bullish after extended reset period No immediate overhead resistance: Path to next major level is relatively clear Why Daily Matters: When a 4-hour setup evolves into a daily breakout: Institutional participation typically increases (larger players operate on daily+ timeframes) The move gains credibility beyond short-term speculation Probability of continuation increases as higher timeframe traders enter Support levels become more significant (daily structure holds better than intraday) Key Observations: Breakout candle characteristics: Strong close, minimal upper wick, suggesting buying conviction Support conversion: Previous resistance now becomes support if price retests Trend alignment: Daily now confirms what 4H structure was telegraphing weeks ago 🎯 From 4-Hour Call to Daily Confirmation: The Progression: December 8th (4H): Structural setup identified - accumulation phase near support Initial Response: Price respected support, began building higher lows Intermediate Action: 4H breakout triggered, resistance levels tested Current State: Daily chart validates with clean breakout above consolidation Why This Sequence Matters: This is how professional technical analysis works: Lower timeframes provide early positioning opportunities Risk is defined based on structure (not arbitrary stops) Higher timeframes eventually confirm or reject the thesis Confirmation on daily adds conviction for position management Key Lesson: The 4-hour chart gave entry opportunity with tight risk. The daily chart now provides the validation that the trade thesis was correct. Traders who entered on 4H structure now have daily confirmation supporting continued upside. 📈 What the Daily Breakout Suggests: Bullish Implications: Next resistance target: Previous cycle highs now become the next logical objective Momentum continuation: Daily breakout with momentum often sustains for multiple sessions Support buffer: If price retraces, the breakout level should provide support Trend clarity: Daily chart removes ambiguity - structure is now clearly bullish Fibonacci Extensions: From the correction low to breakout high, Fibonacci extension targets suggest: 1.272 extension: First projected resistance 1.618 extension: Major target zone where profit-taking typically occurs 2.0 extension: Extended target if momentum remains strong These aren't guarantees but mathematical projections based on the measured move from consolidation. 🧠 Psychology of Early Entry vs. Breakout Chasing: December 8th Entry (4H Structure): Entry felt uncomfortable (price had just pulled back) Risk was defined and relatively tight Reward-to-risk was favorable (3:1 or better to first targets) Required patience through consolidation period Chasing Now (Post-Daily Breakout): Entry feels "safer" (price is rising, daily confirms) Risk has expanded significantly (stop would be much wider) Reward has compressed (already moved toward targets) Late entry often leads to getting shaken out on first retracement The Professional Approach: Buy structure on 4H when risk is defined. Use daily confirmation to hold position or add selectively, not to initiate at worse risk/reward. 📊 Current Trade Management Framework: For Those In From December 8th: Profit Taking Strategy: First reduction: At previous major resistance (book partial profits) Second reduction: At Fibonacci 1.618 extension (lock gains) Final portion: Trailing stop or 2.0 extension (maximize upside) Stop Management: Move stops to breakeven after daily breakout confirmed Trail stops below daily swing lows as new structure forms Give daily structure room - don't tighten stops based on 4H noise Position Psychology: Daily confirmation means the trade thesis was correct. Avoid the temptation to overtrade or add aggressively here. The best risk/reward was on December 8th current management is about optimization, not aggressive scaling. 📅 What's Next? Bullish Scenario: Daily breakout continues with momentum Price targets Fibonacci extensions sequentially Minor retracements find support at breakout level Volume remains elevated on green candles, diminishes on red Retest Scenario: Price pulls back to test breakout level as new support This would be healthy consolidation, not failure 4H chart may provide re-entry or add opportunity Daily structure remains intact unless breakout level fails Invalidation: Daily close back below breakout level Volume deterioration suggesting exhaustion Momentum divergence appearing on daily chart Fundamental shifts in crypto market conditions ⚠️ Risk Considerations: What Could Go Wrong: Crypto Volatility: Ethereum can experience 10-20% pullbacks even during bullish trends. Daily breakouts don't eliminate volatility - they suggest directional bias but not linear price action. Market-Wide Weakness: If Bitcoin enters correction or broader crypto sentiment shifts negative, individual coin technicals become secondary to market-wide flows. False Breakout: Daily breakouts can fail. If price closes back below the breakout level with volume, the technical picture changes and positions should be reassessed. Regulatory/Fundamental Events: Crypto markets remain sensitive to regulatory news, exchange issues, and macroeconomic factors that can override technical structure. 🏆 Key Trading Lessons from This Setup: ✅ Lower timeframes identify structure early: The 4H chart provided the early read when risk was defined ✅ Higher timeframes provide confirmation: Daily breakout validates the 4H thesis was correct ✅ Best entries feel uncomfortable: December 8th near support felt uncertain - that's when risk/reward was optimal ✅ Structure over emotion: The technical setup suggested bullish resolution despite uncertainty ✅ Patience pays: Allowing the 4H structure time to develop into daily confirmation requires discipline ✅ Manage, don't chase: Use daily confirmation for position management, not aggressive late entries 📌 Summary: Then (December 8th): 4-hour chart showing structural setup Support holding, accumulation visible Entry opportunity with defined risk Now (Current): Daily chart confirms with clean breakout Momentum supporting continued upside Original thesis validated by higher timeframe Next: Monitor daily structure for continuation Manage positions based on daily swing points Watch for retest of breakout as potential support ⚠️ Important Disclaimers: This analysis is for educational purposes and reflects a technical progression from 4-hour structure to daily confirmation. It is not financial advice or a recommendation to buy or sell Ethereum or any cryptocurrency. Cryptocurrencies are highly volatile and speculative. Daily breakouts can fail, and past performance of similar setups does not guarantee future results. The December 8th call was based on structure visible at that time - subsequent price action could have invalidated the thesis. Ethereum carries specific risks including regulatory uncertainty, technological vulnerabilities, market manipulation, and extreme volatility. Position sizing must account for potential 20-30% drawdowns even during bullish trends. This review examines what happened after a technical call, not a prediction of future price movement. Markets change, structure fails, and no technical pattern guarantees success. Always conduct independent research, manage risk appropriately, and never invest more than you can afford to lose. All cryptocurrency trading involves substantial risk of loss. ✨ Community Discussion: Did you catch the December 8th setup on the 4H chart? How do you use multi-timeframe analysis in your trading? Share your approach to transitioning from lower to higher timeframe confirmation. 📜 Read the structure. Trust the process. Manage the risk.