
PegasusTechCharts
@t_PegasusTechCharts

تریدر چه نمادی را توصیه به خرید کرده؟
سابقه خرید
تخمین بازدهی ماه به ماه تریدر
پیام های تریدر
فیلتر
نوع سیگنال
PegasusTechCharts
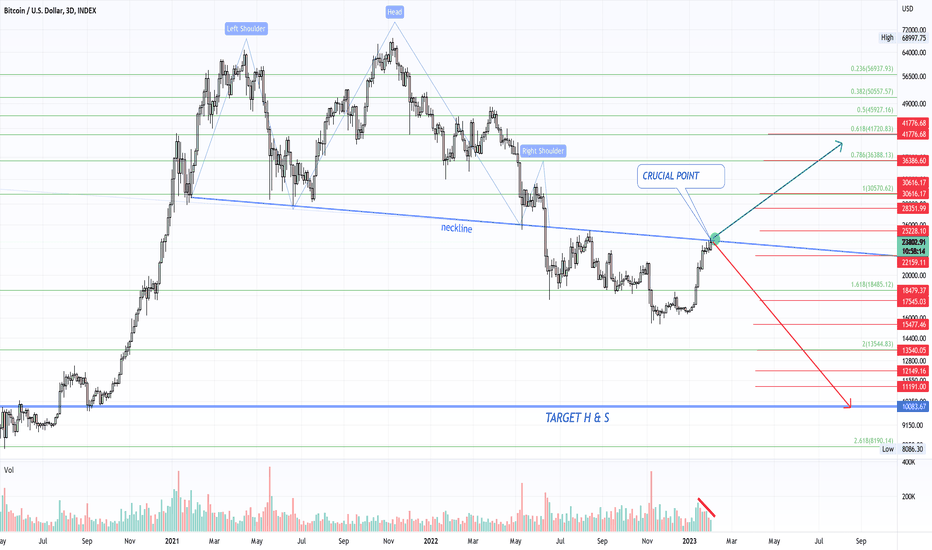
سلام دوستان، مدتی از آخرین ایده منتشر شده من گذشته بود، بنابراین اینجا یک یک جدید است! در اینجا می توانید ببینید که در این نمودار 3 روزه، یک شکل شانه سر شکل گرفته است خط گردن بلافاصله یک نقطه مهم است. همانطور که می بینید ما با حجم و قیمت اختلاف داریم. همچنین در چندین نوسانگر دیگر واگرایی وجود دارد. یک تصویر بیش از هزار کلمه می گوید، بنابراین همه آن را در نمودار می بینید هدف قیمت در حال حاضر 10000 دلار برای بیت کوین و key البته اینجا صبر است. افزایش نرخ بهره هنوز انجام نشده است و اقتصاد کلان بسیار بد به نظر می رسد. به نظر می رسد جنگ نیز در حال افزایش است و تنش های دیگری نیز در جهان وجود دارد. به عنوان مثال. چین / آمریکا، اسرائیل و ایران. قیمت مواد غذایی همچنان در حال افزایش است. قیمت مواد غذایی همچنان به شدت افزایش می یابد. به طور خلاصه، ما همه جا شاهد ناخوشی هستیم. ایده من این است که یورو و دلار و همچنین بازارها به طور کلی توسط مرکزی دستکاری می شوند. بانک ها. قیمت سهام در مقایسه با آنچه در جهان اتفاق می افتد بسیار بالا است و به طور معمول اصلاحات شدیدی در آن وجود خواهد داشت. SP-500 ایده من خیلی زود دوباره در مسیر نزولی قرار خواهد گرفت. تجارت مبارک و موفق باشید! سلب مسئولیت این دیدگاه من است، توصیه ای برای خرید یا فروش نیست. همچنین، همیشه تحقیقات خود را انجام دهید! --->> دوستان عزیز لطفا برای به روز رسانی من را دنبال کنید و با لایک از من حمایت کنید 👍 اگر دوست دارید این کار را ادامه دهم. با تشکر 💚
PegasusTechCharts
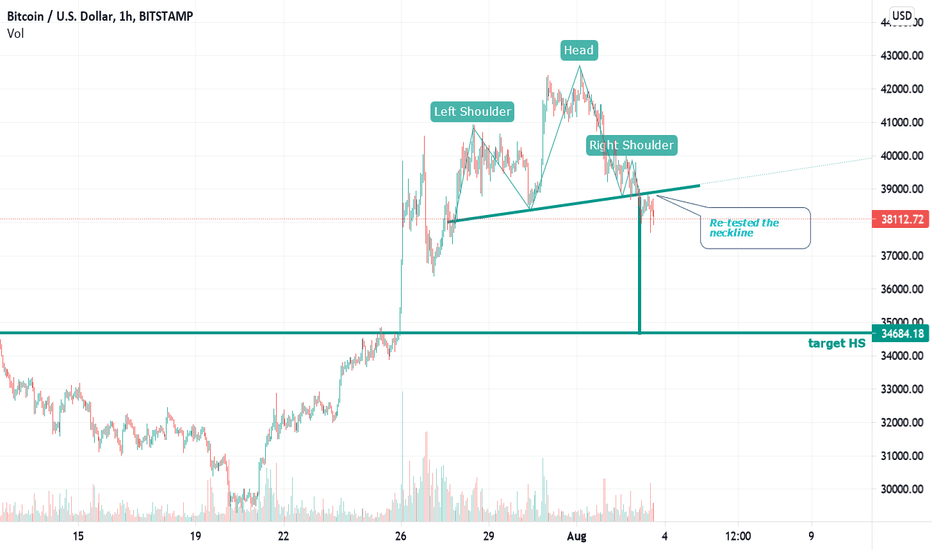
HS Formation دوستان عزیز یک به روز رسانی سریع اما مختصر در اینجا در نمودار ساعتی.Bitcoin به وضوح یک ساختار HS را تشکیل داده است و خط گردن این سازند قبلاً دوباره آزمایش شده است. هدف اکنون 34684 است و از آنجا دوباره دید که چگونه ساختار توسعه می دهد. همچنین حتماً بهروزرسانیهای قبلی من در Bitcoin را بررسی کنید زیرا به هم تعلق دارند. بقیه اهداف میان مدت را نشان می دهند.--- > در این بازار توصیه می کنم از استاپ های محکم استفاده کنید. <---لطفا نظرات و ایده های خود را در زیر به اشتراک بگذارید دوستان عزیز. نظر شما چیست و چرا آن را با یا بدون نمودار فکر می کنید. برای همه شما در تجارت آرزوی موفقیت می کنم! سلب مسئولیت این دیدگاه من است، توصیه ای برای خرید یا فروش نیست. همچنین همیشه تحقیق خود را انجام دهید!--->> دوستان عزیز لطفا برای به روز رسانی من را دنبال کنید و با لایک از من حمایت کنید 👍 اگر دوست دارید این کار را ادامه دهم. با تشکر 💚تشکیل کتف راست یک تشکل HS بزرگتر ممکن است که اتفاق بیفتد...دوستان عزیز 2 سناریو ممکن است اتفاق بیفتد. لطفا توجه داشته باشید که اینها فرضیه هستند! سناریوی 1 قیمت به خط گردن سبز در 39000 بازگشته و به سمت هدف 34379 ادامه می یابد. سناریوی 2 قیمت از خط گردن سبز عبور می کند و اولین ساختار HS را باطل می کند اما سپس شانه راست سازند HS نارنجی را تشکیل می دهد. 32125. جالب اینجاست که در سناریوی 1 این سطح فیبوناچی 0.618 و در سناریوی 2 سطح 0.786 است. اگر قیمت به زیر 0.786 برود ما به سمت پایین قبلی پیش رفت. این گاهی اوقات با تشکیل سازندهای HS اتفاق می افتد. شما می توانید آن را با 2 خط گردن که متقاطع هستند مشاهده کنید. پس دوباره اینها ایده های من هستند و البته ممکن است شکست بخورد همانطور که همه چیز ممکن است در TA. Bullish falling wedge شکست بخورد دوستان عزیز، من معامله را می بندم زیرا به نظر من BTC ابتدا Fiblevel 0.618 را مجدداً آزمایش می کند که دقیقاً هدف صعود است. گوه افتادن هدف 40580 و سطح توقف ضرر 37377 است. سپس ما یک سر و شانه نزولی جدید را شکل دادیم همانطور که در به روز رسانی های من مشاهده می شود تا کوتاه شود. دوستان عزیز، معامله طبق انتظار پیش می رود. اکنون باید ببینیم که چگونه تکامل می یابد. اکنون در حال تشکیل شانه راست این سازند HS هستیم. سبزی که کامل نبود باطل می شود اما این نارنجی شانس دارد. وقتی قیمت از 41-42600 بالاتر برود نارنجی باطل می شود زیرا شانه سمت راست نمی تواند بالاتر از سر باشد. شیوع با حجم خوب اتفاق افتاد. به طوری که همیشه آن را تایید کنید. دوستان عزیز موفق باشید و لطفا ایده خود را در اینجا به اشتراک بگذارید. موقعیت طولانی بسته دوستان عزیز، من موقعیت طولانی را بستم. حجم در حال کاهش است، قیمت در حال افزایش است. هدف تقریباً رسیده است. یک سناریوی احتمالی این است که ما شانه راست ساختار HS را تشکیل دهیم که در بهروزرسانیهای قبلی ذکر شد. اگر اینطور باشد، سازند HS هدفی در حدود 33000 دارد. من کوتاه نمیکنم BTC مگر اینکه زیر یقه را بشکنیم و دوباره آن را آزمایش کنیم. برای همه دوستان آرزوی موفقیت و تجارت شاد داریم! سطوح wedge را از دامنه معاملات هنوز معتبر است و در این بین می توانید در بازه های زمانی کوتاه تری معامله کنید، البته اگر زمان لازم برای نظارت بر آن را در روز دارید. در حال حاضر شاهد افزایش قیمت با حجم خوب هستیم، این الگوی HS را باطل نمی کند، اما همچنین سقوط کرد. در خط مستقیم زیر یقه. ایده من این است که قیمت حتی می تواند دوباره به بالای محدوده برود زیرا BTC در حال تشکیل یک گوه در حال سقوط است. برای شما دوستان عزیز سود بسیار خوبی داریم! گوه شکل گرفته است. اگر قیمت BTC به بالای 42600 برسد، شکل HS نامعتبر است و گوه نزولی صعودی از آخرین به روز رسانی وارد بازی می شود. سطوح ایده های دیگر در محدوده هنوز معتبر هستند تا زمانی که قیمت به سمت بالا یا پایین بیفتد. موفق باشید دوستان عزیز!
PegasusTechCharts
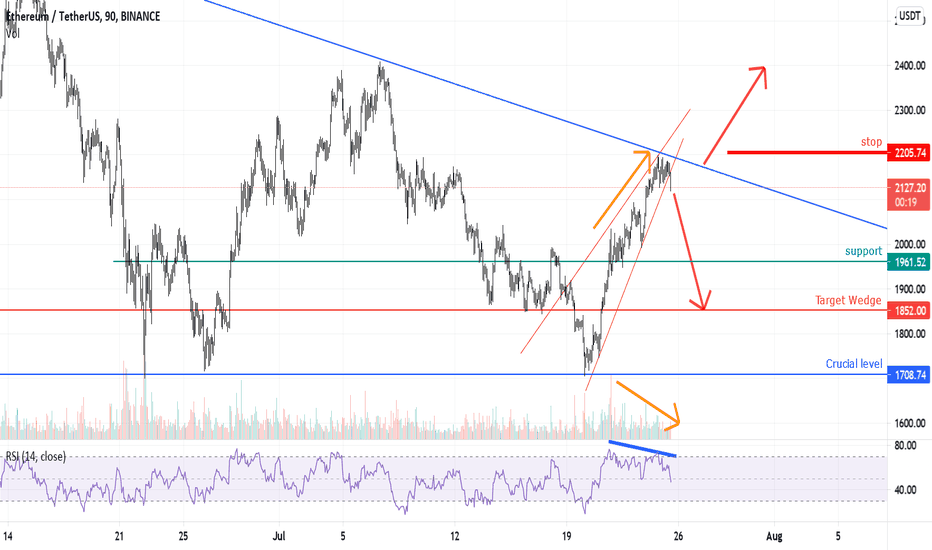
دوستان عزیز، اتریوم یک گوه صعودی نزولی تشکیل داده است و به سمت نزول حرکت کرده است. هدف گوه 1852 دلار است. اگر Ethereum به بالای 2205 برسد، این ضرر برای کوتاه مدت بود و به سطح بعدی 2400 دلار رفت. همچنین خط روند نزولی را می بینیم که به عنوان یک مقاومت قوی عمل می کند و برای یک سناریوی صعودی Ethereum باید این خط روند را بشکند. از طرف دیگر، اگر حمایت با کف سه گانه نگه ندارد Ethereum فرو می رود اما این فقط یک احتمال است که دیر یا زود می تواند اتفاق بیفتد. فقط همیشه برای یک برنامه B آماده باشید در صورت تغییر شرایط. در این بازار توصیه می کنم از توقف های محکم استفاده کنید. لطفاً نظرات و ایده های خود را در زیر به اشتراک بگذارید دوستان عزیز. نظر شما چیست و چرا آن را با یا بدون نمودار فکر می کنید. برای همه شما در تجارت آرزوی موفقیت می کنم! سلب مسئولیت این دیدگاه من است، توصیه ای برای خرید یا فروش نیست. همچنین همیشه تحقیق خود را انجام دهید!--->> دوستان عزیز لطفا برای به روز رسانی من را دنبال کنید و با لایک از من حمایت کنید 👍 اگر دوست دارید این کار را ادامه دهم. با تشکر 💚دوستان فقط خط روند آبی را نیز زیر نظر داشته باشند. شکستن این خط روند برای خرید آن به حجمی بیش از حد متوسط نیاز دارد. ایده آل این است که منتظر یک آزمون مجدد باشید. اگر این اتفاق بیفتد، سیگنال صعودی بسیار خوبی بود، اما ما باید همیشه از تله های گاو نر آگاه باشیم. تست مجدد با توقف محکم می تواند در این امر کمک کند. دوستان عزیز موفق باشید و برای همه شما سودهای بزرگ آرزو می کنم! خوشبختانه، ما یک توقف محکم داشتیم و این یک معامله با پتانسیل بود. چرا؟ زیرا تمام گوه های در حال افزایش در اواخر Bitcoin کاری را که قرار بود انجام دهند جز اکنون انجام دادند. اما در برابر دستکاری که اغلب با حجم کم اتفاق می افتد، هیچ کاری نمی توان انجام داد جز توقف ضرر شما. دوستان، من فعلاً موضعی نمی گیرم تا زمانی که وضعیت چگونه پیش می رود. من یک تعصب ندارم زیرا می توانیم در بازارهای گاو نر و نزولی سود به دست آوریم. آنچه ما در بازارهای سهام با بالاترین قیمتهای جدید مشاهده کردهایم، تنها ناشی از چاپ نامحدود دلار و یورو به تریلیونهاست که بخش بزرگی از آن به طور غیرمستقیم در بازارها تزریق میشود. تا زمانی که این روند ادامه داشته باشد، به نظر من، شانس سقوط واقعی بازار سهام صفر است. بازارهای کریپتو با بازارهای سهام متفاوت است، اما با تمام ساختوسازهای جدید در صندوقها، همبستگی آنها بیشتر و بیشتر میشود. پس این چیزی است که برای میان مدت و بلند مدت باید در نظر داشت. دوستان عزیز موفق باشید
PegasusTechCharts
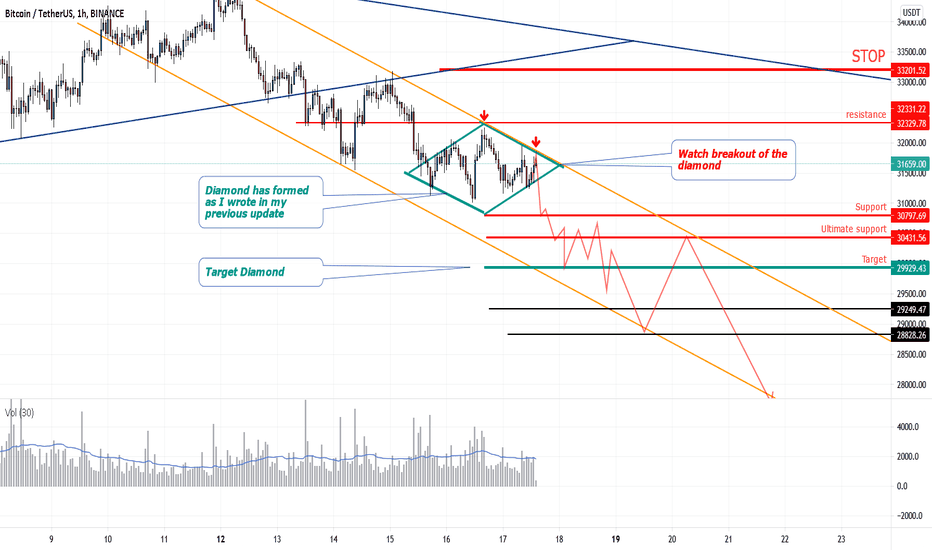
Bitcoin Diamond pattern formed. Watch the breakout!Diamond pattern formed as expected. Dear friends,As I wrote in my previous update, a diamond pattern has indeed been formed. Now look at the breakout. It is expected to be down but if not then the stop level is at 33200.I expect at least 25000 USD as a price target for Bitcoin but it could easily go lower based on the chart at that time. Step by step instead of too long targets. The price and market is dynamic so as a trader you need to adjust yourself continuously.The head and shoulder formations from previous analysis are all valid but they all points to the same target. So be sure to check out the previous updates as well.If you appreciate my work then it's nice to get a like and please follow me for new uodates. Please share your thoughts and idea's below dear friends. What do you think and why do you think it with or without a chart.I wish you all good luck with trading!Disclaimer This is my view, no advice to buy or sell. Also always do your own research!--->> Dear friends please follow me for updates and give me support with a like 👍 if you like me to continue this work. Thanks 💚Of course if the Diamond break to the upside, we possibly get a short pauze in the decline of Bitcoin. The chart will show the direction. Watch always for HH HL LH LL patterns for the trend. Important is that you look for this a t the right timeframe. For example; higher highs and higher lows on a 5 minute chart is not the same as on a 1 hour, 4 hour time frame. Good luck dear friends!Here you see the valid and already re-tested Head and shoulder pattern. What is happening now is that we are on the way to the target.So most patterns you see will be just continuation patterns. Even if not, they will probably just pause the declining price.I redrew the diamond a little bit. That's exactly how it is! Now we just have to wait and see what will happen and what direction the breakout will be. If it is upwards keep in mind a bull trap because we get to see those on a regular basis. Also the trend is still down by the LH and LL.Good luck dear friends!There is no breakout yet and look at the volume. It is declining while price rise.Bearish sign is this.Abreakout must be with good volume and a more than average candle.You can also see a bearish wedge on the right side of the triangle.UpdateDear Friends,The diamond from the previous uodate has broken out upwards but as I already wrote, this is probably a bull trap as we have seen so many. This is because the trend is still down. HH HL LL LH method 4 hour charts. New patterns are formed, a bearflag / bearish rising wedge and a triangle. On you to think about which direction it will go. Wish you all succes and good profits!Good evening dear friends,The diamond is now no longer important. The pattern has now been transformed into a bearflag. This happens constantly, patterns change.For example, a sysmetrical triangle can transform to a ascending triangle. A wedge to a trend channel. A failing head shoulder formation to a wedge etc. I trade what I see and not what I think. No biases, not bearish not bullish either. I don't care at all if it goes up or down as long as you follow the trend!Too many signals and too much information from different sources make it also difficult in special for new traders. However the market is complex and 50% thinks it goes up and 50 % thinks it goes down. That is why the price is in balance.So when does this trend change then? I have indicated that in the chart. When the level of 33129 is broken through with the close of a 4 hour candle things are going to look different. As long as that has not happened there is no rising trend. There can be a rising trend on a shorter time frame. For example on the 15 minute chart but I am talking about the 4 hour timeframe here.The shorter the time frame the more noise and the smaller the moves.Also the volume is low and cannot sustain a rising trend. For that, the volume has to grow while the price is rising. Everything can happen, we will just see what happens and then act as the chart show the direction itselfGood luck dear friends!Weekly candle Here is a weekly chart of Bitcoin. What do you guys think of this red weekly candle. It is a full candle with almost no wick. A wick below the candle is a rejected level.The monthly looks also the same.When in doubt about a trend, zoom out for another look io the price.The neckline of the HS formation and the lower trendline of the bearflag has been broken and the first target is now USD 30000.Good luck dear friendsWhat is next with Bitcoin?Bitcoin has reached our SHORT target and even went down to 29249 usd. Personally, I do not expect the trend to turn positive now. We will see that by the price movement. If Bitcoin sets a higher high then that could be the start of a short-term uptrend but again, I don't expect that.In short:If bitcoin manages to rise above 30000 then the next level is 30430 to max 31000. After that the trend should continue downwards.If bitcoin does not manage to break through the 30000 level then the decline will continue. Don't buy too soon friends because in my opinion the decline is not over yet.Do not forget that 16 months ago the price of one bitcoin was 3850 and this is not a type error;-) As an advice, always do your own research and never trade blindly on any idea!If you use a max risk of 1-2% with automatic stop loss then you have so much less risk to end with a liquidation or zero account. It is maybe not spectacular this 2% max risk but it protect your account! Good luck with trading dear friends and if you like my work please follow me and give me a like which is good for my motivation to continue this work!updateDear friends,This pullback was expected as the 29-30k level is a strong support level. The falling trendline is a strong resistance.Only on a breakout with volume and a pullback to test the red trendline is a LONG position recommended up to 36600. From there, another very heavy resistance awaits.However, I expect a deeper decline from the red descending trend line to at least 28810. Then we should see if this level is broken downwards and we enter a new analysis with much lower targets.If Bitcoin breaks out above the red trend line we can expect a rise to 36600. There I still expect a continuation of the decline again unless the price breaks through upwards there as well. Then the top of the range will come into view again. Eventually we will get another bull market if the price can break through the 42k level with high volume,We are not that far yet and it is also very questionable whether this will happen but the chart and the price dictate the direction. I am not a bull nor a bear just follow and anticipate what can happen. I have not a single bias or emotion if it goes up or down.Eventually we will get another bull market if the price can break through the 42k level with high volume,Good luck dear friends!Short update.Not much changed since the last update. The levels are still valid, the older analysis also.Bitcoin is forming now an inversed Head and shoulders but this is probably not working out because there is no volume anymore. Only with a break trough the blue trendline and a retest the situation improves for the very short time.So it looks like the trend will continue as it was untill we see a move with volume to the upside.Wish you all good trading dear friends!An updateDear friends,If Bitcoin goes through the 33600 then I expect at least a target of 36600 usd. Beware though because bull traps have been many and it could happen here too. The big boys make a game out of it to mislead every trader, therefore, also keep an eye on the trading volume.On a break down from the rising wedge I see the old low again as a target at 28800 but if Bitcoin goes below that, we will get an acceleration to 25000 as the first target. Note an uptrend there is a pullback, not a trend reversal.In short- Upon breakout of the orange trendline and ONLY after a re-test of this tread line LONG to 36600. Risk exists for a bulltrap.- Upon breakout of the wedge downwards AND the black trendline a continuation of the decline to the old low at 28800.Friends, do not go long before a re-test of broken trendline is my advice! The orange trandline is not yet broken but it is very close. Prices always re-test so no need for any fomo or emotions.Watch out for beartraps and that is why a re-test is the only way to play this more safe. Then there are many resistance levels to break as seen in the chart. Once a resistance is broken it become a support level and so the next resistance will be next target.First 33600 then 36600 then 41-42000. After that it will be a nice bullish scenario. But below 28800 we will see a very nasty dive. Just be aware of this!By the way, I have no bias, not bullish, not bearish. Just trade what you see and certainly not what you are thinking of. Succes dear friends!updateDear Friends,To buy or not to buy? That, of course, is entirely everyone's personal choice. In my analysis, my target was almost reached at 400 points. Since then we have again seen a similar price trend as we have seen recently.A divergence has now occurred on the 1 hour chart with the RSI in overbought condition. A pullback is to be expected now. We are also seeing a bearish rising wedge. Be aware that all previous wedges caused a pullback. Will it this time be different? My advice for now is patience until a pullback to at least the neckline of the inversed head and shoulders pattern, then a tight stop loss and target to 36600. Then as explained in the previous update see if this resistance is broken. If yes then Bitcoin will go to the next resistance.We are still in the trading range and will have to deal with complex rises and falls. That is the consequence of this long trading range which in my opinion in Wyckoff means a re-distribution and not an accumulation. Nevertheless there are movements which you can profit from but I only see a solid rise above 42000. One of the things we have seen also in the past is the bull and bear traps. Will it happen this time or not is difficult to say now but you can protect yourself with tight stops. About trends rising or falling an important thing to remember. Which timeframe do you use. On a 15 minute there can be a rising trend perfect to trade where it is on the 4 hour a clear downtrend. The best thing to do is keep it simple! Look at one higher time frame, what is the trend on this higher timeframe and than on the short timeframe wait for a counter trade. That is a pullback. This way you trade with the larger timeframe in your direction and buy pullbacks. That is a very good method only the timeframe sets to trade is personal. Do not forget that the smaller you go the more noise and the more you need constant for your pc to monitorLast but not least, I only give idea's here and not advice to trade because you always have to do your own analysis. Any idea can be helpfull in this but to many idea's will be confusing because at any moment there will be traders who are go for Long setups and others for short setups. Good luck dear friends!Update - Hello friends,Bitcoin is still moving upwards in the wedge with a target 36600. There was no pullback to the neckline yet and there is a bearish divergence so that can happen today. IF Bitcoin cross the level of 36600 then we will probably see the old level 41k however this tradingrange is getting weaker with time a lot of time passing nd there are a lot of resistances to take. Just use tight stops in this market to minimalize the risk for a sudden drop!Succes dear friends and if you like my work please give me a like or follow for updates!Dear friends,On the daily timeframe we see there is a wedge in combination with declining volume. That is a bearish sign. The neckline still need to be re-tested so that would come in not as surprise.
PegasusTechCharts
Bitcoin تاثیر بسیاری از شکلگیریهای سر و شانه! در اینجا ما به نمودار 90 دقیقهای Bitcoin دوستان عزیز نگاه میکنیم.Bitcoin باعث پایینتر شدن بالا و پایینتر دیگر شده است و بنابراین به احتمال بسیار زیاد به سمت پایینتر میرویم. کانال روند آبی روند دوست شماست و روند نزولی است! مسیر قرمز این است که چگونه می تواند پیش برود اما می تواند سریعتر نیز پیش رود. وحشت واقعی رخ داد تا زمانی که از پایین در 28805 افت نکنیم. من قطعاً این اتفاق را می بینم زیرا اکثر معامله گران فکر می کنند که پایین ترین نقطه آن است. من اینطور فکر نمی کنم، اما همانطور که قبلاً به آن عادت کرده اید، ترجیح می دهم پیش بینی های بلند مدت انجام ندهم زیرا به عنوان یک معامله گر نمی توانید کاری با آنها انجام دهید. فقط قدم به قدم و هر بار شرایط را مرور کنید. اگر Bitcoin نشانههای صعودی را نشان دهد و یک الگوی پایین را تشکیل دهد، زمان بیشتری برای طولانی شدن زمان کافی بود. فکر نکنید که Bitcoin در حال حاضر در حال حرکت است. ارزش کل بازار نیز در حال کاهش است که همه با هم نزولی است. هدف اول و هدف دوم 30500 و 30000 است. سپس به سمت هدف اصلی 28805 می رویم که حجم در حال کاهش است و فقط عمل نزولی قیمت را تأیید می کند. تحلیل های قبلی من با چندین شکل بزرگتر از شانه سر همگی هنوز معتبر هستند، اما در این نمودار می توانید عملکرد فعلی را بهتر دنبال کنید! هیچ پیش بینی طولانی مدتی وجود ندارد، اما آنچه را که می بینید به راحتی در ذهن شماست و هیچ درگیری ایجاد نمی کند، معامله کنید! لطفاً نظرات و ایده های خود را در زیر به اشتراک بگذارید دوستان عزیز . نظر شما چیست و چرا آن را با یا بدون نمودار فکر می کنید. برای همه شما در تجارت آرزوی موفقیت می کنم! سلب مسئولیت این دیدگاه من است، توصیه ای برای خرید یا فروش نیست. همچنین همیشه تحقیق خود را انجام دهید!--->> دوستان عزیز لطفا برای به روز رسانی من را دنبال کنید و با لایک از من حمایت کنید 👍 اگر دوست دارید این کار را ادامه دهم. با تشکر 💚Btc در بازه زمانی کوچکتر یک گوه افزایشی نزولی تشکیل می دهد. روند رو به پایین است. دوستان موفق باشید! تست یقه و سپس کاهش ;-)مهم!دوستان عزیز، می بینیم که Bitcoin یک گوه نزولی و همچنین یک مثلث در حال گسترش ایجاد کرده است. من فکر می کنم مثلث در حال گسترش می تواند به یک الگوی الماس تبدیل شود، اما هنوز خیلی زود است که بگوییم. با گذشت زمان روشن تر شد. اگر Bitcoin کانال روند را بشکند که می تواند یک هشدار باشد، اما برای تغییر روند نزولی باید به نمودار 4 ساعته نگاه کنیم و آخرین اوج باید حذف شود = 33300. پس از آن باید یک پایین تر باشد و این می تواند باشد. سیگنالی برای طولانی شدن باشد. پایین بودن پایین را می توان با یک کندل 4 ساعته صعودی، یک ته دوتایی و غیره تایید کرد. من انتظار ندارم اما فقط قیمت مشخص می کند. در تجارت موفق باشید! دوستان عزیز، ما همین حالا به جدیدترین پست ادامه می دهیم.
PegasusTechCharts
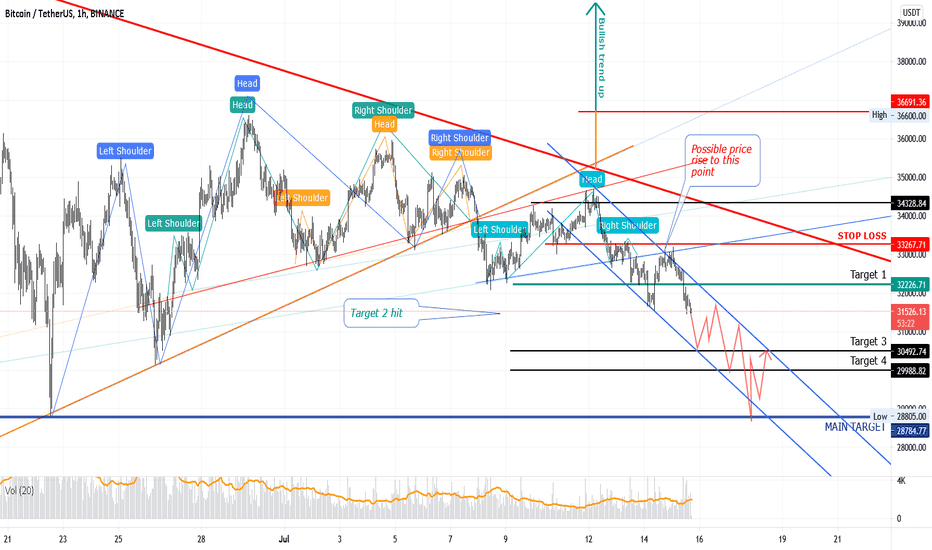
نمودار 30 دقیقه ای بیت کوین الگوهای جدید - آن را بررسی کنید! سلام دوستان و معامله گران عزیز، تحولات جدیدی در نمودار 30 دقیقه ای بیت کوین وجود دارد.Bitcoin قبلاً یک Bearflag تشکیل داده است و در این الگو حرکت می کند. ما همچنین شاهد تشکیل یک شکل Head shoulder هستیم. من انتظار دارم تا 33700 به عنوان بالاترین نقطه برای شانه راست باشد، پس از شکستن خط گردن، اهداف زیر را مشاهده می کنیم:314003050029400 تجزیه و تحلیل های قبلی من با چندین شکل بزرگتر سر شانه هنوز معتبر هستند! هیچ پیش بینی بلندمدتی وجود ندارد، اما آنچه را که می بینید معامله کنید برای شما آسان است و هیچ درگیری ایجاد نمی کند! لطفا نظرات و ایده های خود را در زیر به اشتراک بگذارید دوستان عزیز. نظر شما چیست و چرا آن را با یا بدون نمودار فکر می کنید. برای همه شما در تجارت آرزوی موفقیت می کنم! سلب مسئولیت این دیدگاه من است، توصیه ای برای خرید یا فروش نیست. همچنین همیشه تحقیق خود را انجام دهید!--->> دوستان عزیز لطفا برای به روز رسانی من را دنبال کنید و با لایک از من حمایت کنید 👍 اگر دوست دارید این کار را ادامه دهم. ممنون 💚میبینید که هر وقت قیمت بالا میره حجمش کم میشه. وقتی قیمت پایین می آید، حجم آن بالا می رود. اگر قیمت افزایش یابد، باید شاهد حجم باشیم تا آن را تایید کنیم، در غیر این صورت این حرکتی است که ادامه یافت. اگر این اتفاق بیفتد ما می حجم خوبی داشته باشیم و ابتدا برخی از سطوح شکسته شوند. ترجیحا با یک شمع روزانه حتی بهتر از 2 تا. موفق باشید دوستان عزیزم! توقف های خود را در جای خود فراموش نکنید ;-)Bitcoin یک پرچم کوچک کوچک جدید تشکیل داده است و اکنون در حال آزمایش خط روند پایین تر آن است. سازند HS در حال حاضر هنوز شکسته نشده است. حجم به دلیل کاهش حجم در هنگام افزایش قیمت نزولی است و بالعکس. فلش های قرمز را در نمودار ببینید و آن را با قیمت بالای آن مقایسه کنید. تصویر کلی Bitcoin بسیار نزولی به نظر می رسد، اما ما دیدیم که در نمودارهای دیگری که پست کرده ام. هنوز معتبر است! موفق باشید دوستان عزیز به روز رسانی بله، در واقع، دوباره یک گوه کوچک صعودی نزولی جدید. ما در حال حاضر 3 مورد از آنها را داریم و علاوه بر 3 مورد از آنالیز قبلی من، 2 ارسال HS اضافی را نیز می بینیم! 3 بزرگتر نیز معتبر است. اهداف اول در این نمودار 32226 - 31512 - 30492. + اهداف پست های قبلی. موفق باشید دوستان عزیز!هدف 1 برآورده شد و هدف 2 محقق شد! و در حال حاضر به هدف 3! روز بخیر دوستان عزیز! تشکیلات Last HS کمی دوباره ترسیم شده اند و هنوز کاملا معتبر هستند. درست مانند 3 تشکل اصلی HS از تجزیه و تحلیل های قبلی من.Bitcoin هنوز در یک کانال روند نزولی است. یقه HS آبی قبلاً مجدداً آزمایش شده است، یقه نارنجی نیز احتمالاً مجدداً آزمایش می شود. موفق باشید و همیشه با توقف ضرر معامله کنید. گوه صعودی نزولی جدید. ظهر بخیر دوستان عزیز! لطفا به نمودار نگاه کنید. Bitcoin یک گوه صعودی نزولی را تشکیل داد. IT همچنین در نقطه ای برای آزمایش مجدد خط گردن است. BTC در کانال روند نزولی حرکت می کند. شکستگی بالای خط روند قرمز احتمالاً باعث حرکت به سمت بالای کانال سبز می شود. اگر روی خط روند قرمز که حرکت مورد انتظار است جهش کند، به نزول خود ادامه داد. برای شما آرزوی موفقیت و سود داریم! پرچم خرس شکسته شده است. به روز رسانی اینجا از Bitcoin ما یک HS معکوس کوچک و یک الگوی روکش الماس را می بینیم. مراقب شکست باشید. تشکلهای HS بزرگتر هنوز در تحلیل قبلی من در جریان هستند. اگر خط روند سبز هدف شکسته باشد، احتمالا بالای کانال را سبز رنگ میبینیم. اما به حجم نگاه کنید! بدون حجم = بدون حرکت معتبر! مراقب سطوح باشید و برای شما دوستان عزیز آرزوی موفقیت دارم! روند نزولی ادامه دارد. همانطور که همه شما از تجزیه و تحلیل ها می دانید، من در مورد جهت BTC شکی ندارم، هنوز کوتاه است. هدف اول البته پایین ترین زمان قبلی در 28800 است و در آنجا می توان انتظار بازگشت قیمت را داشت اما اکنون هدف 25000 به سرعت نزدیک شده است. گرفتن چاقویی که در حال سقوط است می تواند منجر به ضرر بزرگ شود. قبل از رفتن طولانی شما نیاز به تایید دارید. در تجارت دوستان عزیز موفق باشید! مهم! دوستان عزیز، ما می بینیم که Bitcoin یک گوه نزولی و همچنین یک مثلث در حال گسترش ایجاد کرده است. من فکر می کنم مثلث در حال گسترش می تواند به یک الگوی الماس تبدیل شود، اما هنوز خیلی زود است که بگوییم. با گذشت زمان روشن تر شد. اگر Bitcoin کانال روند را بشکند که می تواند یک هشدار باشد، اما برای تغییر روند نزولی باید به نمودار 4 ساعته نگاه کنیم و آخرین اوج باید حذف شود = 33300. پس از آن باید یک پایین تر وجود داشته باشد و این می تواند باشد. سیگنالی برای طولانی شدن باشد. پایین بودن پایین را می توان با یک کندل 4 ساعته صعودی، یک ته دوتایی و غیره تایید کرد. من انتظار ندارم اما فقط قیمت مشخص می کند. در تجارت موفق باشید! دوستان عزیز، ما همین حالا به جدیدترین پست ادامه می دهیم.
PegasusTechCharts
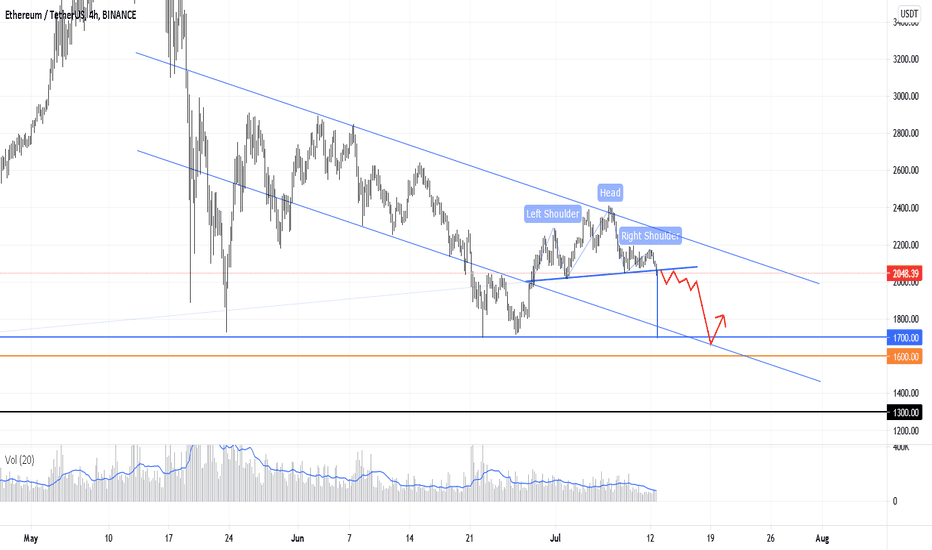
Ethereum HS Formation - Targets 1700 - 1600 - 1300 دوستان عزیز اتریوم یک شکل گیری سر شانه را تکمیل کرده است و ما به عنوان اولین اهداف 1700 - 1600 و 1300 می بینیم. گردن این سازند HS قبلا شکسته شده است و Ethereum در کانال روند به سمت پایین حرکت می کند. . معامله گران پس از تمام انحلال حساب ها در طول افت های خشونت آمیز بسیار محتاط شده اند و این باعث می شود شانس افزایش کمتر و کمتر شود. معمولاً قیمت پس از اولین کاهش به خط گردن باز می گردد. اکنون سؤال این است که آیا پس از رسیدن به اولین هدف متوقف می شود؟ اگر ETH کمتر از آن شود، یک سطح کلید مهم شکسته شده است و احتمالاً به زودی اهداف پایین تری را مشاهده کرد. لطفاً نظرات و ایده های خود را در زیر به اشتراک بگذارید دوستان عزیز. نظر شما چیست و چرا آن را با یا بدون نمودار فکر میکنید. برای همه شما در تجارت دوستان آرزوی موفقیت دارم! سلب مسئولیت: این دیدگاه من است، توصیه ای برای خرید یا فروش نیست. همچنین همیشه تحقیق خود را انجام دهید!--->> دوستان عزیز لطفا برای به روز رسانی من را دنبال کنید و با لایک از من حمایت کنید 👍 اگر دوست دارید این کار را ادامه دهم. با تشکر 💚دوستان عزیزم روز بخیر! من انتظار دارم یک آزمایش مجدد گردن در حال حاضر و سپس کاهش بیشتر. مراقب تله های گاو نر باشید در حال حاضر هیچ سناریوی صعودی، نه در Bitcoin و نه در Ethereum وجود ندارد. البته این می تواند تغییر کند اما پس از آن سطوح خاصی باید شکسته شوند. برای مثال شانه راست HS در Ethereum اما شکستن خط گردن با حجم بالا نیز یک سیگنال است. موفقیت و تجارت شاد .Ethereum خط گردن سر و شانه ها را شکسته و اکنون در حال آزمایش مجدد است. موقعیت های کوتاه در اطراف خط گردن با توقف در 2203 که بالای شانه راست است، کاری است که من شخصا باید انجام دهم. همچنین حجم را مجدداً یادداشت کنید زیرا آن را در Bitcoin و سایر alt سکه ها نیز سرو می کنیم. افزایش حجم با کاهش قیمت و بالعکس. رفتار نزولی شدید. روند فقط زمانی تغییر می کند که ما یک مقدار بالاتر و یک پایین بالاتر را تعیین کنیم. همچنین به پست های Bitcoin مراجعه کنید زیرا اگر Bitcoin پایین بیاید، بقیه موارد دنبال می شوند!Ethereum در راه رسیدن به هدف است:A به روز رسانی جدید یک به روز رسانی جدید. ما تقریباً به هدف پیشبینی شده رسیدهایم، اما اگر Ethereum از گوه سقوط خارج شود، هدف در یک مکث کوچک قرار میگیرد. موفق باشید دوستان عزیز! اکنون احتمالاً ابتدا مقاومت قوی را مجدداً آزمایش کرد، اگر معامله جدیدی وجود داشته باشد، آن را به عنوان یک ایده جدید پست کرد. با تشکر از دوستان عزیز!
PegasusTechCharts
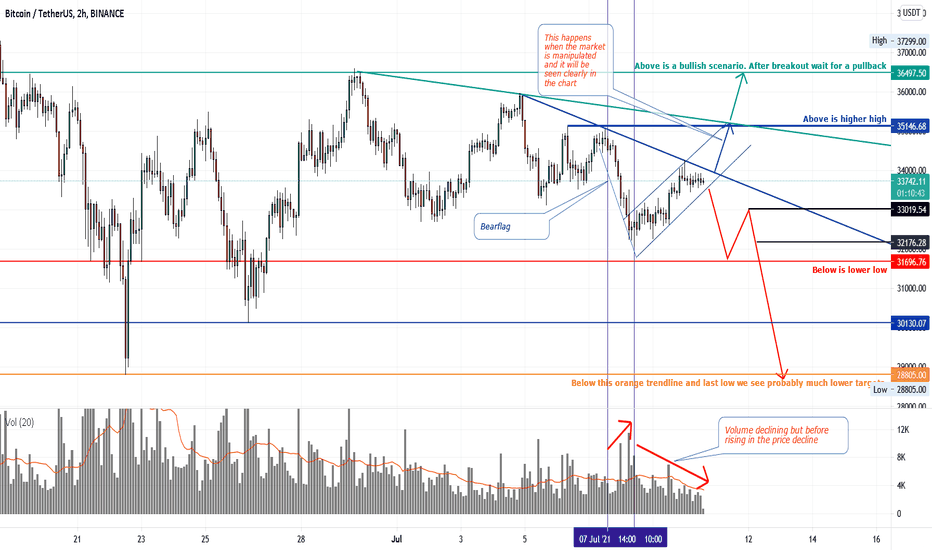
Bitcoin simple but powerful analysis with bullish bearish levelsDear friends,A different and very simple look at Bitcoin with the different bullish and bearish levels. Also posted so that you can follow it with the button in te screen to update the chart.This can be short but powerful. The simpler the better! Please note that my previous analyses are just still valid including the levels. This is just another simple view of Bitcoin, the other posts show the patterns etc.Above the green horizontal trend line there is a bullish scenario, below the orange trend line at 28805 a clear bear market with much lower levels. Above 35146 we have a higher high and below 32000 a lower low.We have the following bearish patterns (see it in my other posts)1. 3X HS formaties2 a larger bearflag3. A series of lower highs and lower lows.4 The red trendline connecting the lows which is extremely important was broken . 5. Once again declining volume with rising priceNote how during the decline the volume went up and during the last rise the volume went down. When you see something like that it is normally just bearish.A rise without volume will collapse under the force of gravity.Also take into account sudden interventions of whales and large funds. That is the only thing that can disturb the TA on the smaller timeframes.It now strongly looks like we are going to test the low again and maybe even drop below it. However, it is far too early now to judge that. The market is dynamic and anything can change. Therefore, step by step. No long term predictions that will be of little or no use to you at this time. After all, you want to make a profit now. It's good to have the fundamentals in your mind but it is important that it immediately not affect your trading from charts. If so, you won't be able to go on trading because of the many contradictions. As an advice, do not risk more than max 2% of your capital on the whole of your trades. The Crypto market moves together so 4 positions of 0.5 % risk is already the max of 2%! Of course many will not keep these numbers but is is a fact that without this you have a much higher chance of getting a zero account. The power of compounding smaller profits is the key for your total capital.Please share your thoughts and idea's below dear friends. What do you think and why do you think it with or without a chart.I wish you all good luck with trading guys!Disclaimer Traders this is my view, no advice to buy or sell. Also always do your own research!--->> Traders please follow me for updates and give me support with a like 👍 if you like me to continue this work. Thanks 💚A zoomed-in view. A zoomed-in view. An Important point is highlighted.ImportantDear Friends,Currently Bitcoin is still perfectly following the purple Rising wedge Beearflag. I expect it to break out downwards but only when the international markets reopen. If Bitcoin break upwards then that looks to me like yet another bulltrap! So beware of it because it happened several times and BTC is famous for it.When is it safe to go long? For that we first need to set a higher high and and higher low. So first of all above 35200. But then we need to set another higher low.In short.+34500 is a bullish signal but not to go long.+36000 is a clear improvement.+36800 The trend has reversed, after a re-test of 36800 Long positions are indicated but with a target of max 41-42000 USD.I don't expect BTC to go above +36800 and not even +36000 but if so we will follow charts. Why I don't expect it is because of the clear technical picture. The volume which is very low. There is absolutely no drive to be seen that people want to go full long. If there is a breakout upwards then as we have seen before it will come from a whale or large fund to manipulate again.Above 36800 with the close of at least a 4 hour candle is the signal and would mean we are heading towards 41000 /42000 again but unfortunately another huge resistance awaits there. Only above the trading range and after a pullback to retest it, the picture has changed completely to bullish and we can at least go to the old top. So step by step see what happens and don't act sooner or let yourself be lured into a trap is the message here.Happy trading dear friends and succes!UPDATEDear friends,I do not expect it but possible the price can still rise to a maximum of 34500 till 35200 usd. That does noet change the bearish picture at all and all the levels remain exactly the same.The volume has decreased again in the last rise so that is another bearish signal. All patterns are also still perfectly valid. Patience, patience, patience ;-)Tonight or tomorrow will bring clarity in my opinion. See you later friends!UpdateDear Friends,Bitcoin has already formed another bearish rising wedge. I think this time it is going down a little faster because of the price movements that were getting smaller and smaller. The volume is also ultra low so a rise has little support. The Rsi is not cooperating either.As I wrote earlier, a big move is coming and most likely not upwards. Here is also a chart showing a possible trajectory. Bitcoin should show movement but whether it happens right away we will have to wait and see. The chart here is how it could go and not a guarantee. The market is dynamic and if Bitcoin starts to rise again we will adjust the strategy as exactly described with the levels in the previous analyses still perfectly valid at this time!We will follow the chart and take it step by step without long term predictions which won't help you at this point anyway.Good luck and don't forget the stops dear friends!All the Head and shoulders patterns are still doing their job and still are valid.Bitcoin has formed a new minor bearflag and is now testing its lower trendline. The HS formation has not yet been broken at this time. Volume is bearish due to drop in volume when price rises and vice versa. See the red arrows in the chart and compare it to the price above it.The overall picture of Bitcoin looks very bearish but we have seen that in the other charts I have posted.My previous analyses with various larger head shoulder formations are all still valid!Good luck dear friendsUpdateYes indeed, again a new small bearish rising wedge. We have now 3 of them and we see also 2 extra HS fromations besides the 3 from my previous analyse! The 3 bigger also valid. First targets in this chart 32226 - 31512 - 30492. + Targets from previous posts.Good luck dear friends!Target 1 has been met and target 2 has been met! and now on to target 3! Good day dear friends!The Last HS formations are slightly redrawn and still perfectly valid. Just like the 3 major HS formations from my previous analyses.Bitcoin is still in a downward trend channel. The neckline of the blue HS has already been retested, that of the orange could possibly be re-tested as well.I expect a further decline and only at 33400 where the new stoploss lies will things improve. Good luck and always trade with a stop loss.New bearish rising wedge.Good afternoon dear friends!Please look at the chart. Bitcoin formed a bearish rising wedge. IT is also at the point for the re-tests of the neckline again. BTC moves in the downward trendchannel.A break above the red trendline will probably trigger a move to the upper side of the green channel. If it bounce on the red trendline which is the expected move it will continue to decline.Wish you succes and profits!The bearflagThe bearflag has been broken so normally continuation of the downtrend.Succes dear friends!Diamond/ Inv HSGoodevening dear friends!A small update here from Bitcoin We see a small Inverted HS and a Diamond topping pattern.Watch out for the breakout. The bigger HS formations are still in play from my previous analysis.If green trendline is broken target we see probably the top of the channel in green.But look at the volume! No volume = no valid move! Keep an eye on the levels and wish you succes dear friends!The downward trend continues.As you all know from the analyses, I have no doubt about the direction of BTC, it is still short. Very first target is of course the low of last time at 28800 and there you can expect a rebound of the price but now the target of 25000 is fast approaching. Catching a falling knife can result in a big loss. Before going long you need confirmation.Good luck with trading dear friends!Important!Dear friends, We see Bitcoin made a bearish wedge and also a expanding triangle. I think the expanding triangle could transform to a diamond pattern but it is still very premature to say. It will be more clear with time. If Bitcoin break the trendchannel that could be a warning but to change the downtrend we need to look at the 4 hour chart and the last high need to be taken out = 33300. After that there need to be a higher low and that would be the signal to go long. That lower low can be confirmed with a bullish 4 hour candlestick, a double bottom and so on. I do not expect it but only price will tell. Succes with trading!Dear friends,We continue the uodates now on the newest post.
PegasusTechCharts
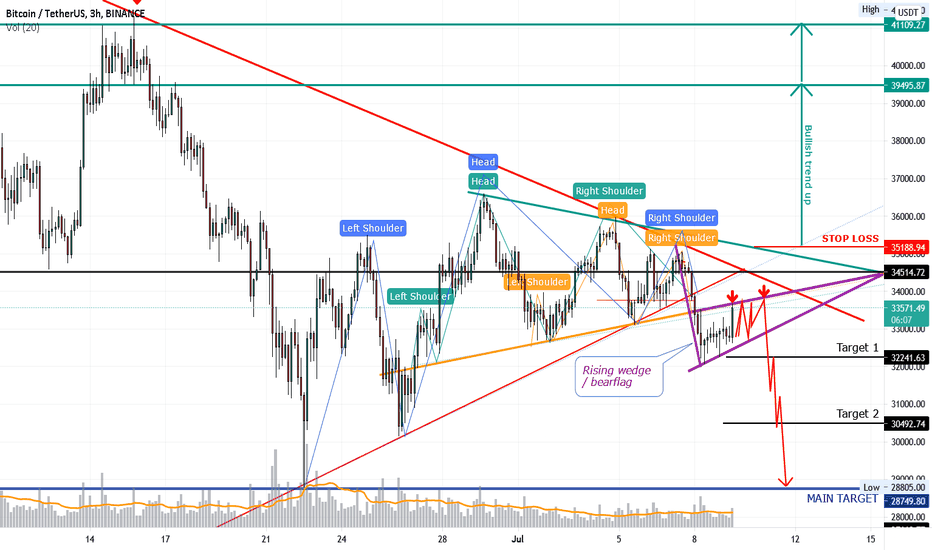
Bitcoin 3x head and shoulders + bearflag / bearish rising wedge + triangle. All patterns confirmed and validDear friends,As I expected, Bitcoin is forming a bearflag / bearish rising wedge (purple) . Yes unique because there are now 3 bearish head shoulder formations actif at the same time of which in all three the neckline has been broken.Currently, Bitcoin is re-testing the orange neckline of a smaller HS formation. Bitcoin formed under the main trend and necklines also the bearish purple rising wedge / bearflag.This picture looks pretty bearish. I expect around 34000 max 34500 another decline with the following targets.32250305002880028800 is extremely important. If BTC not hold this level we will sink much deeper. and we get 27500 and 25000 as first targets. If the price breaks through the red descending trend line with good volume that is a warning. If then BTC breaks through the green triangle trend line a second warning. Above 35200 there is a possible bullish scenario with target 39500 - 41500. This is because we set a higher high. Of course going long only after a pullback with confirmation of a higher low!If you look at this chart, a bearish flag/ rising wedge under a broken trendline in combination with 3 HS formations. It need to get very crazy if it breaks to the upside but we just follow what happens. This scenario is most likely, what do you think?Please share your thoughts and idea's below dear friends. What do you think and why do you think it with or without a chart.I wish you all good luck with trading!Disclaimer Traders this is my view, no advice to buy or sell. Also always do your own research!--->> Traders please follow me for updates and give me support with a like 👍 if you like me to continue this work. Thanks 💚UPDATE Dear Friends,An update on Bitcoin with slightly redrawn repositioned neckline and bear flag (purple).I have slightly repositioned the neckline of the hs formation but it is still perfectly valid. The price can possibly go up to 34500. Does BTC break higher then there is a warning zone. Only above 36700 we have set a higher high but then at least a pulback has to happen to go long.However, I expect the price to bounce off and fall further. I expect this due to the following reasons.1. 3X HS formaties2 a larger bearflag3. Inside the purple bearflag we see a bearish rising wedge(red)4 The red trendline connecting the lows which is extremely important was broken . 5. Once again declining volume with rising price6. A series of lower highs and lower lows.New we also see now clearly that btc has formed a bearish rising wedge in the bearflag as well. Can it be more bearish?Stop loss for this short is 35250 the targets 32240 - 30500 and 28750.There are so many factors that point to this trade succeeding but if it doesn't then it is due to manipulation of large funds because technically the picture is right on all counts.Good luck dear friends and don't forget the stop loss and the 1-2% money management rule!Looking at the candlesticks we clearly see signs again that it is going down quickly with Bitcoin unless there is intervention by a big party. We know this happens and that can disrupt everything but under normal circumstances it runs as we see in the charts.Don't forget the important rule; lower highs, lower lows. This is the most simplistic and powerful definition of the trend. When we set a higher high we are still not ready for long positions. We first have to set first a higher low after that higher high. That is then the moment to go long. That moment can be a trendline break, a bullish candle on smaller time frame, a double bottom and so on.Good luck dear friends!A zoomed-in view. A zoomed-in view. An Important point is highlighted.Dear friends,Do not forget to also check this chart. It is simple with clear targets for going long or short. I does not need to be complicated ;-)ImportantDear Friends,Currently Bitcoin is still perfectly following the purple Rising wedge Beearflag. I expect it to break out downwards but only when the international markets reopen. If Bitcoin break upwards then that looks to me like yet another bulltrap! So beware of it because it happened several times and BTC is famous for it.When is it safe to go long? For that we first need to set a higher high and and higher low. So first of all above 35200. But then we need to set another higher low.In short.+34500 is a bullish signal but not to go long.+36000 is a clear improvement.+36800 The trend has reversed, after a re-test of 36800 Long positions are indicated but with a target of max 41-42000 USD.I don't expect BTC to go above +36800 and not even +36000 but if so we will follow charts. Why I don't expect it is because of the clear technical picture. The volume which is very low. There is absolutely no drive to be seen that people want to go full long. If there is a breakout upwards then as we have seen before it will come from a whale or large fund to manipulate again.Above 36800 with the close of at least a 4 hour candle is the signal and would mean we are heading towards 41000 /42000 again but unfortunately another huge resistance awaits there. Only above the trading range and after a pullback to retest it, the picture has changed completely to bullish and we can at least go to the old top. So step by step see what happens and don't act sooner or let yourself be lured into a trap is the message here.Happy trading dear friends and succes!UPDATEDear friends,I do not expect it but possible the price can still rise to a maximum of 34500 till 35200 usd. That does noet change the bearish picture at all and all the levels remain exactly the same.The volume has decreased again in the last rise so that is another bearish signal. All patterns are also still perfectly valid. Patience, patience, patience ;-)Tonight or tomorrow will bring clarity in my opinion. See you later friends!UpdateDear Friends,Bitcoin has already formed another bearish rising wedge. I think this time it is going down a little faster because of the price movements that were getting smaller and smaller. The volume is also ultra low so a rise has little support. The Rsi is not cooperating either.As I wrote earlier, a big move is coming and most likely not upwards. Here is also a chart showing a possible trajectory. Bitcoin should show movement but whether it happens right away we will have to wait and see. The chart here is how it could go and not a guarantee. The market is dynamic and if Bitcoin starts to rise again we will adjust the strategy as exactly described with the levels in the previous analyses still perfectly valid at this time!We will follow the chart and take it step by step without long term predictions which won't help you at this point anyway.Good luck and don't forget the stops dear friends!This is the original post updated.All the Head and shoulders patterns are still doing their job and still are valid.Bitcoin has formed a new minor bearflag and is now testing its lower trendline. The HS formation has not yet been broken at this time. Volume is bearish due to drop in volume when price rises and vice versa. See the red arrows in the chart and compare it to the price above it.The overall picture of Bitcoin looks very bearish but we have seen that in the other charts I have posted.My previous analyses with various larger head shoulder formations are all still valid!Good luck dear friendsUpdateYes indeed, again a new small bearish rising wedge. We have now 3 of them and we see also 2 extra HS fromations besides the 3 from my previous analyse! The 3 bigger also valid. First targets in this chart 32226 - 31512 - 30492. + Targets from previous posts.Good luck dear friends!Target 1 has been met and target 2 has been met! and now on to target 3! Good day dear friends!The Last HS formations are slightly redrawn and still perfectly valid. Just like the 3 major HS formations from my previous analyses.Bitcoin is still in a downward trend channel. The neckline of the blue HS has already been retested, that of the orange could possibly be re-tested as well.I expect a further decline and only at 33400 where the new stoploss lies will things improve. Good luck and always trade with a stop loss.New bearish rising wedge.Good afternoon dear friends!Please look at the chart. Bitcoin formed a bearish rising wedge. IT is also at the point for the re-tests of the neckline again. BTC moves in the downward trendchannel.A break above the red trendline will probably trigger a move to the upper side of the green channel. If it bounce on the red trendline which is the expected move it will continue to decline.Wish you succes and profits!The bearflagThe bearflag has been broken so normally continuation of the downtrend.Succes dear friends!Diamond/ Inv HSGoodevening dear friends!A small update here from Bitcoin We see a small Inverted HS and a Diamond topping pattern.Watch out for the breakout. The bigger HS formations are still in play from my previous analysis.If green trendline is broken target we see probably the top of the channel in green.But look at the volume! No volume = no valid move! Keep an eye on the levels and wish you succes dear friends!The downward trend continues.As you all know from the analyses, I have no doubt about the direction of BTC, it is still short. Very first target is of course the low of last time at 28800 and there you can expect a rebound of the price but now the target of 25000 is fast approaching. Catching a falling knife can result in a big loss. Before going long you need confirmation.Good luck with trading dear friends!Important!Dear friends, We see Bitcoin made a bearish wedge and also a expanding triangle. I think the expanding triangle could transform to a diamond pattern but it is still very premature to say. It will be more clear with time. If Bitcoin break the trendchannel that could be a warning but to change the downtrend we need to look at the 4 hour chart and the last high need to be taken out = 33300. After that there need to be a higher low and that would be the signal to go long. That lower low can be confirmed with a bullish 4 hour candlestick, a double bottom and so on. I do not expect it but only price will tell. Succes with trading!Dear friends,We continue the uodates now on the newest post.
PegasusTechCharts
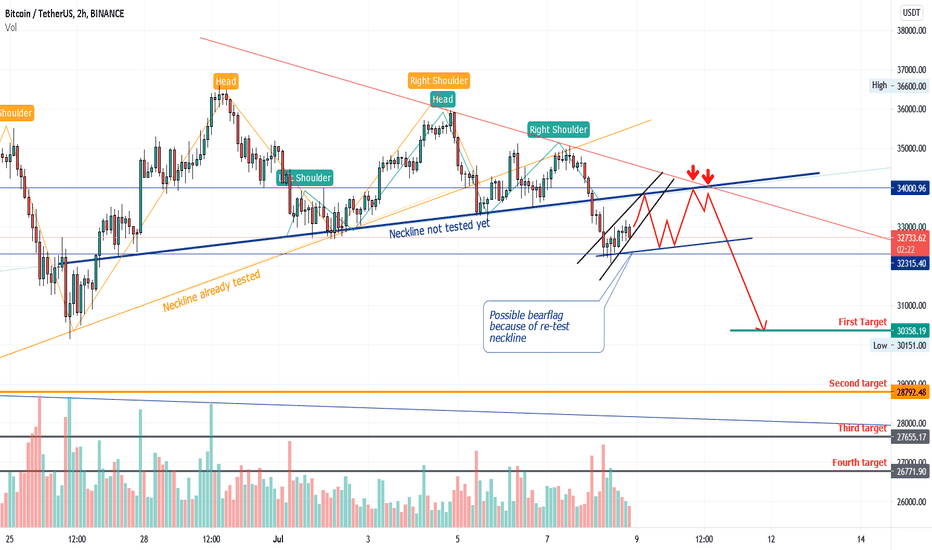
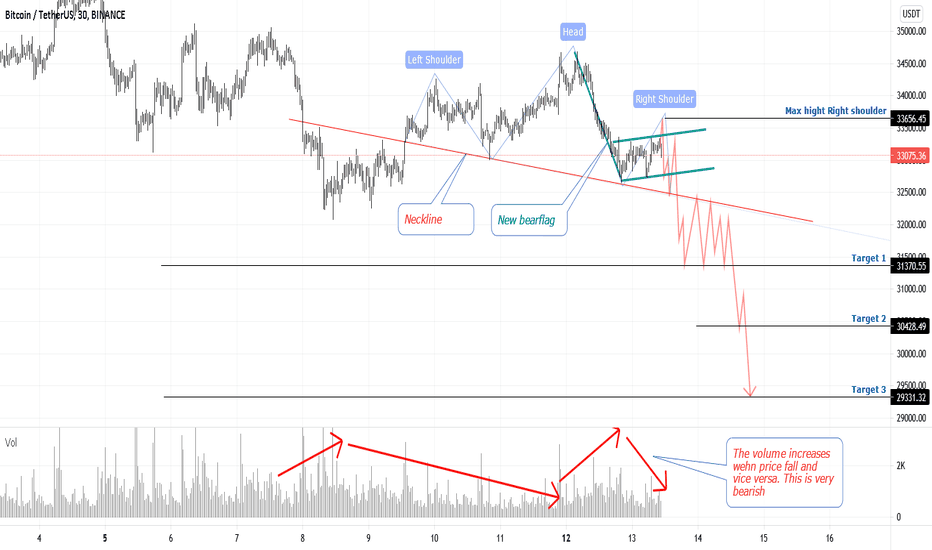
Dear friends,Here is an update of Bitcoin on the 2 hour chart.Be sure to check out my previous analysis as this one is an addendum to the previous one that is still valid.Bitcoin has fallen through the neckline of the HS formation (orange) and has successfully re-tested this line.The second HS formation (green) is also valid and the price has already fallen through that neckline. I expect a re-test of that neckline at 33800-34000. Maybe BTC don't even have the force to go that high as volume decreases while price increases. That is always bearish!After the (possible) re-test, the following targets come into the picture.30350, 28800, 27655 and possibly 26771.Should Bitcoin rise above the red triangle trendline than that is a bullish sign but still not enough. We clearly need higher highs and higher lows to change the trend! I do not expect it however but you never know with the heavy manipulation of the markets. Nothing is 100% sure in TA but this seems very likely. Please share your thoughts and idea's below dear friends. What do you think and why do you think it with or without a chart.I wish you all good luck with trading!Disclaimer Traders this is my view, no advice to buy or sell. Also always do your own research!--->> Traders please follow me for updates and give me support with a like 👍 if you like me to continue this work. Thanks 💚UpdateA zoomed-in view. An Important point is highlighted.ImportantDear Friends,Currently Bitcoin is still perfectly following the purple Rising wedge Beearflag. I expect it to break out downwards but only when the international markets reopen. If Bitcoin break upwards then that looks to me like yet another bulltrap! So beware of it because it happened several times and BTC is famous for it.When is it safe to go long? For that we first need to set a higher high and and higher low. So first of all above 35200. But then we need to set another higher low.In short.+34500 is a bullish signal but not to go long.+36000 is a clear improvement.+36800 The trend has reversed, after a re-test of 36800 Long positions are indicated but with a target of max 41-42000 USD.I don't expect BTC to go above +36800 and not even +36000 but if so we will follow charts. Why I don't expect it is because of the clear technical picture. The volume which is very low. There is absolutely no drive to be seen that people want to go full long. If there is a breakout upwards then as we have seen before it will come from a whale or large fund to manipulate again.Above 36800 with the close of at least a 4 hour candle is the signal and would mean we are heading towards 41000 /42000 again but unfortunately another huge resistance awaits there. Only above the trading range and after a pullback to retest it, the picture has changed completely to bullish and we can at least go to the old top. So step by step see what happens and don't act sooner or let yourself be lured into a trap is the message here.Happy trading dear friends and succes!UPDATEDear friends,I do not expect it but possible the price can still rise to a maximum of 34500 till 35200 usd. That does noet change the bearish picture at all and all the levels remain exactly the same.The volume has decreased again in the last rise so that is another bearish signal. All patterns are also still perfectly valid. Patience, patience, patience ;-)Tonight or tomorrow will bring clarity in my opinion. See you later friends!UpdateDear Friends,Bitcoin has already formed another bearish rising wedge. I think this time it is going down a little faster because of the price movements that were getting smaller and smaller. The volume is also ultra low so a rise has little support. The Rsi is not cooperating either.As I wrote earlier, a big move is coming and most likely not upwards. Here is also a chart showing a possible trajectory. Bitcoin should show movement but whether it happens right away we will have to wait and see. The chart here is how it could go and not a guarantee. The market is dynamic and if Bitcoin starts to rise again we will adjust the strategy as exactly described with the levels in the previous analyses still perfectly valid at this time!We will follow the chart and take it step by step without long term predictions which won't help you at this point anyway.Good luck and don't forget the stops dear friends!All patterns still valid and doing their job.Bitcoin has formed a new minor bearflag and is now testing its lower trendline. The HS formation has not yet been broken at this time. Volume is bearish due to drop in volume when price rises and vice versa. See the red arrows in the chart and compare it to the price above it.The overall picture of Bitcoin looks very bearish but we have seen that in the other charts I have posted.My previous analyses with various larger head shoulder formations are all still valid!Good luck dear friendsUpdateYes indeed, again a new small bearish rising wedge. We have now 3 of them and we see also 2 extra HS fromations besides the 3 from my previous analyse! The 3 bigger also valid. First targets in this chart 32226 - 31512 - 30492. + Targets from previous posts.Good luck dear friends!Target 1 has been met and target 2 has been met! and now on to target 3! Good day dear friends!The Last HS formations are slightly redrawn and still perfectly valid. Just like the 3 major HS formations from my previous analyses.Bitcoin is still in a downward trend channel. The neckline of the blue HS has already been retested, that of the orange could possibly be re-tested as well.I expect a further decline and only at 33400 where the new stoploss lies will things improve. Good luck and always trade with a stop loss.New bearish rising wedge.Good afternoon dear friends!Please look at the chart. Bitcoin formed a bearish rising wedge. IT is also at the point for the re-tests of the neckline again. BTC moves in the downward trendchannel.A break above the red trendline will probably trigger a move to the upper side of the green channel. If it bounce on the red trendline which is the expected move it will continue to decline.Wish you succes and profits!Diamond/ Inv HSGoodevening dear friends!A small update here from Bitcoin We see a small Inverted HS and a Diamond topping pattern.Watch out for the breakout. The bigger HS formations are still in play from my previous analysis.If green trendline is broken target we see probably the top of the channel in green.But look at the volume! No volume = no valid move! Keep an eye on the levels and wish you succes dear friends!The downward trend continues.As you all know from the analyses, I have no doubt about the direction of BTC, it is still short. Very first target is of course the low of last time at 28800 and there you can expect a rebound of the price but now the target of 25000 is fast approaching. Catching a falling knife can result in a big loss. Before going long you need confirmation.Good luck with trading dear friends!Important!Dear friends, We see Bitcoin made a bearish wedge and also a expanding triangle. I think the expanding triangle could transform to a diamond pattern but it is still very premature to say. It will be more clear with time. If Bitcoin break the trendchannel that could be a warning but to change the downtrend we need to look at the 4 hour chart and the last high need to be taken out = 33300. After that there need to be a higher low and that would be the signal to go long. That lower low can be confirmed with a bullish 4 hour candlestick, a double bottom and so on. I do not expect it but only price will tell. Succes with trading!Dear friends,We continue the uodates now on the newest post.
سلب مسئولیت
هر محتوا و مطالب مندرج در سایت و کانالهای رسمی ارتباطی سهمتو، جمعبندی نظرات و تحلیلهای شخصی و غیر تعهد آور بوده و هیچگونه توصیهای مبنی بر خرید، فروش، ورود و یا خروج از بازار بورس و ارز دیجیتال نمی باشد. همچنین کلیه اخبار و تحلیلهای مندرج در سایت و کانالها، صرفا بازنشر اطلاعات از منابع رسمی و غیر رسمی داخلی و خارجی است و بدیهی است استفاده کنندگان محتوای مذکور، مسئول پیگیری و حصول اطمینان از اصالت و درستی مطالب هستند. از این رو ضمن سلب مسئولیت اعلام میدارد مسئولیت هرنوع تصمیم گیری و اقدام و سود و زیان احتمالی در بازار سرمایه و ارز دیجیتال، با شخص معامله گر است.