
Mayfair_Ventures
@t_Mayfair_Ventures

تریدر چه نمادی را توصیه به خرید کرده؟
سابقه خرید
تخمین بازدهی ماه به ماه تریدر
پیام های تریدر
فیلتر
نوع پیام
Mayfair_Ventures
Market always looking for liquidity
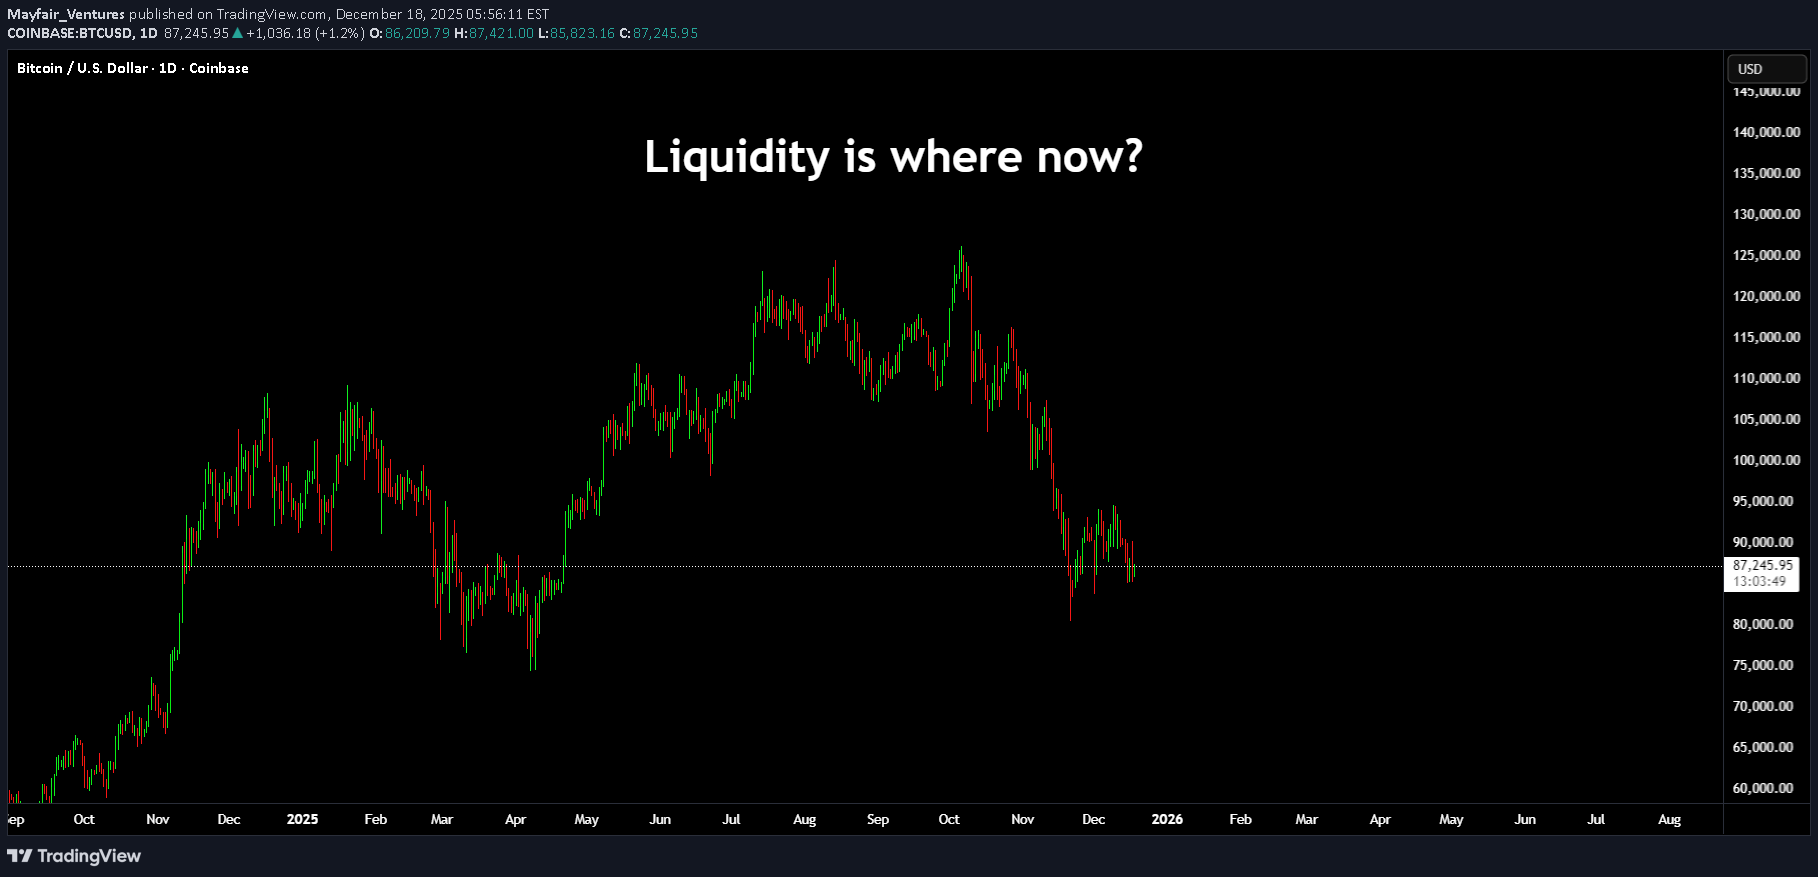
نظر نامطلوب اما مردم همچنان منتظر ۱۳۵ هزار دلار از سال ۲۰۲۱ هستند. بازارها بالا می روند و پایین می آیند. در اینجا اطلاعات کلی وجود دارد - بدون در نظر گرفتن بالا یا پایین. اصول اولیه... نقطه کنترل محلی تصویر بزرگتر هنگامی که قیمت به یک جیب نقدینگی خارجی می رسد، بخار آن تمام می شود زیرا از نظر دارایی بیش از حد شلوغ است و عرضه کافی برای برآورده کردن تقاضا وجود دارد. بسته به جهت بالا یا پایین. از آنجا به نظر می رسد که بازار برای یافتن نقدینگی داخلی با سرعت کمتری move کار می کند - برخی این را به عنوان عقب نشینی یا جستجوی بلوک سفارش یا عدم تعادل می بینند. اما ایده این است که بازیکنان مشتاق را بیرون بیاوریم و برای بازیکنان بزرگتر خرید کنیم یا بیشتر بفروشیم. قیمت در اینجا دارای یک جیب نقدینگی خوب است که درست زیر پایین ترین سطح محلی است. مسئله در اینجا این است که مقدار مناسبی از خرید نقدینگی نیز بسیار پایین تر است. همانطور که می بینید در حدود 60k. در مرحله بعد، ما شانس خوبی داریم که بانک ژاپن نرخ بهره را در 24 تا 48 ساعت آینده افزایش دهد. به هر حال مواظب باش این می تواند یک هیجان باشد یا می تواند یک اسلاید deep قبل از کریسمس باشد. آرام باشید، مراقب باشید و تعطیلات برای شما مبارک باشد! سلب مسئولیت این ایده به عنوان توصیه مالی محسوب نمی شود. این فقط برای اهداف آموزشی است، معامله گر اصلی ما بیش از 25 سال تجربه در سهام، ETF و فارکس دارد. از این رو، هر تنظیم تجاری ممکن است زمان های نگهداری، شرایط ورود یا خروج متفاوتی داشته باشد و با پست/ایده ای که در اینجا به اشتراک گذاشته شده است متفاوت است. شما می توانید از اطلاعات این پست برای ایجاد طرح معاملاتی خود برای ابزار مورد بحث استفاده کنید. معامله ریسک دارد؛ درصد بالایی از معامله گران خرده فروشی ضرر می کنند. لطفاً هنگام ورود به هر معامله ای این را در نظر داشته باشید. بمانید safe.
Mayfair_Ventures
حجم و دلتا: رازهای ساده تحلیل بازار که همه نادیده میگیرند!
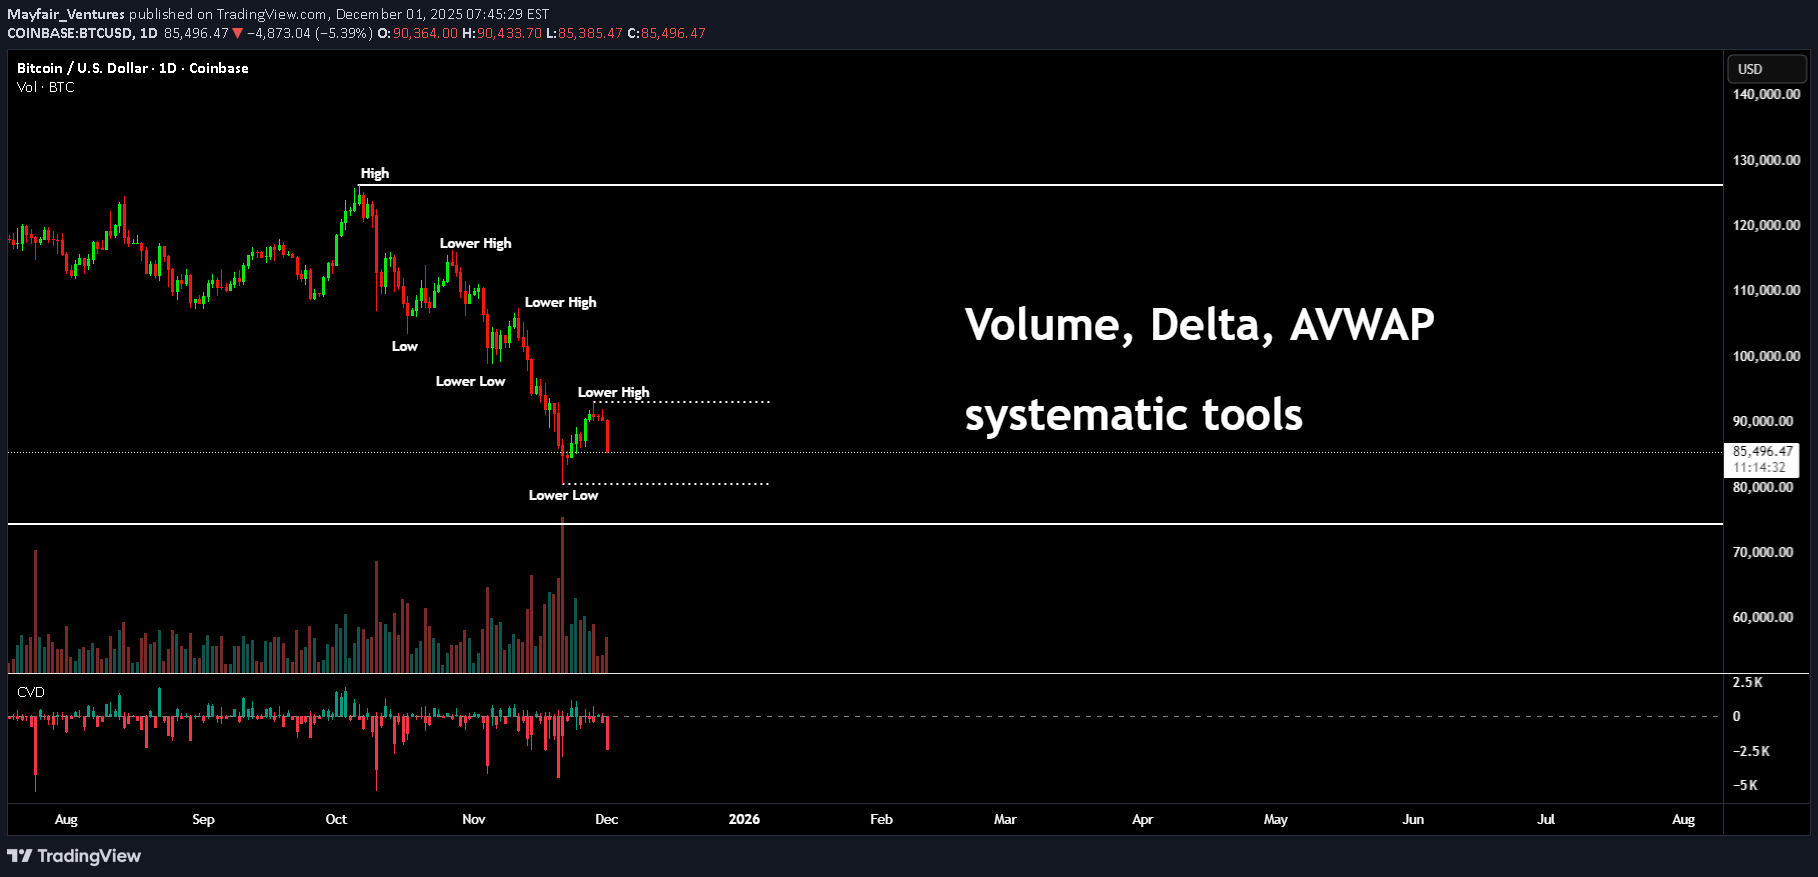
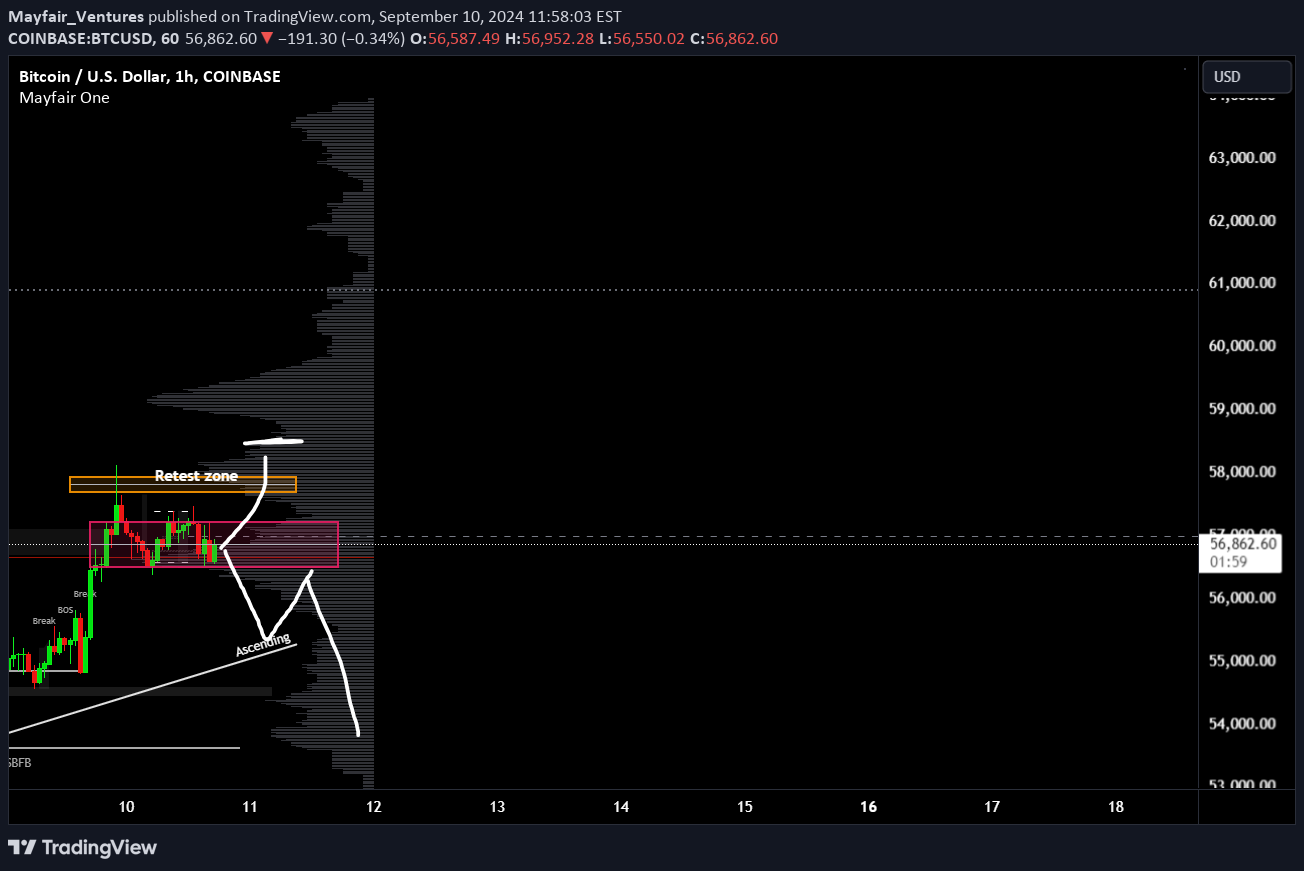
خوب، فکر نکنید که این مربوط به Bitcoin است. این فقط یک مورد استفاده خوب برای این نوع ابزارها است. همه آنها را می توانید به صورت رایگان در اینجا پیدا کنید TradingView مردم تمایل دارند برخی از این ابزارها را واقعاً درک نکنند، شاید آنها ایده را دریافت کنند اما ارزش واقعی را نه. برای مدت طولانی، نمودارهای ردپایی، حجم دلتا و جستجوی اطلاعات بیشتر و بیشتر را انجام می دادم. حال اگر نمی دانید نمودار ردپا چیست، استرس نداشته باشید. رد پا مانند نگاه کردن به داخل شمعدان است، هم خرید و هم فروش هر شمع را به شما می دهد. این تقریباً به همان اندازه است که شما باید بدانید. پس چرا همه از آنها استفاده نمی کنند؟ پاسخ به این سوال پیچیده است، اما به زبان ساده. نیازی نیست. با پیروی از تکنیکهای مبتنی بر قانون مانند سیستم معاملات مکانیکی که در پستهای اخیر به اشتراک گذاشتم. باشه پس بذار یه چیزی بهت نشون بدم بعداً از ابزار ساده صدا (من یک CVD نیز اضافه کرده ام) بیشتر در این مورد استفاده کنید. اما با یک نگاه سریع، میتوانیم متوجه افزایش قیمت و کاهش حجم شویم. به این میگن واگرایی. همانطور که می بینید، قیمت ادامه می یابد و ابزارهای حجم و CVD شروع به چاپ story متفاوت می کنند. باز هم، نه حمله به Bitcoin (من می دانم که برخی از شما چقدر ارزشمند و دفاعی هستید). این برای هر ساز است. در اینجا یک تکنیک کوچک دیگر وجود دارد. الگویی وجود دارد که به عنوان الگوی اصلی شناخته می شود. این یک Wyckoff است. اما اساساً پس از انباشت یا توزیع، یک مرحله گسترش را مشاهده می کنید. این اغلب UTAD یا فنر نامیده می شود (بسته به جهت) من این را با PoC به عنوان منطقه اصلی auction نشان داده ام. ادغام - همچنین به عنوان ارزش منصفانه شناخته می شود، منطقه ای است که در آن خرید و فروش زیادی صورت گرفته است. پس از گسترش به فواصل تقریباً مساوی هر دو طرف ادغام. قیمت دوباره PoC یا وسط منطقه auction را آزمایش می کند. با این حال، جایی که مردم نمی توانند چیزهای بدیهی را ببینند. به سادگی درک CVD و حجم story است. ما می توانیم ابزارهای دیگری مانند AVWAP را اضافه کنیم. میتوانید چرخش قیمت در منطقه auction را ببینید. بزرگنمایی؛ در اینجا شاهد افت قیمت در زیر ناحیه آبی رنگ "Value area" هستیم، به این معنی که کاهش یافته است و احتمالاً به قسمت زیرین منطقه auction بالا باز می گردد. می توان گفت که این یک آزمون مجدد است. بنابراین، بیایید فرض کنیم که ما بالا میرویم - بدیهی است که خریداران این شیب را خرید. بعد از تست مجدد حتی سرنخ های بیشتری در مورد اینکه قیمت کجا به دنبال نقدینگی بود وجود دارد. برای این کار، نمایه حجم را ببینید. حالا بیایید تکنیک دیگری را اضافه کنیم. این به عنوان نقدینگی داخلی و خارجی شناخته می شود. ما نقدینگی صعودی قبلی (خارجی) را برداشتیم و سپس به داخل بازگشتیم. قیمت احتمالاً به دنبال قیمت بعدی بالاتر بود، اما داخلی باقی می ماند. همه قبل از جستجوی نقدینگی خارجی، نزولی. در اینجا یک تصویر ساده از اوج و فرودها را مشاهده می کنید که به اوج و پایین تر تبدیل می شوند. برای مطالعه واضح در این مورد؛ برای شکستن یکی از این دو سطح به قیمت نیاز داریم. هنگامی که این کار را انجام دادیم، تأیید و سوگیری داریم که پس از آن چه مجموعه ای از نقدینگی قرار گرفت. اما... آیا چیزی وجود دارد که سرنخ اولیه را ارائه دهد؟ خوب بله. به CVD نگاه کنید. می بینید، این نباید آنقدرها هم پیچیده باشد. بازار به دنبال نقدینگی است، بازارها برای همیشه بالا و پایین نمی روند. ضرب المثلی در این فضا وجود دارد، اگر نمی توانید نقدینگی را تشخیص دهید، پس شما نقدینگی هستید. بمانید safe همه! سلب مسئولیت این ایده به عنوان توصیه مالی محسوب نمی شود. این فقط برای اهداف آموزشی است، معامله گر اصلی ما بیش از 25 سال تجربه در سهام، ETF و فارکس دارد. از این رو، هر تنظیم تجاری ممکن است زمان های نگهداری، شرایط ورود یا خروج متفاوتی داشته باشد و با پست/ایده ای که در اینجا به اشتراک گذاشته شده است متفاوت است. شما می توانید از اطلاعات این پست برای ایجاد طرح معاملاتی خود برای ابزار مورد بحث استفاده کنید. معامله ریسک دارد؛ درصد بالایی از معامله گران خرده فروشی ضرر می کنند. لطفاً هنگام ورود به هر معامله ای این را در نظر داشته باشید. بمان safe.
Mayfair_Ventures
تحلیل چند زمانی ساده: راز موفقیت تریدرها در هماهنگسازی نمودارها
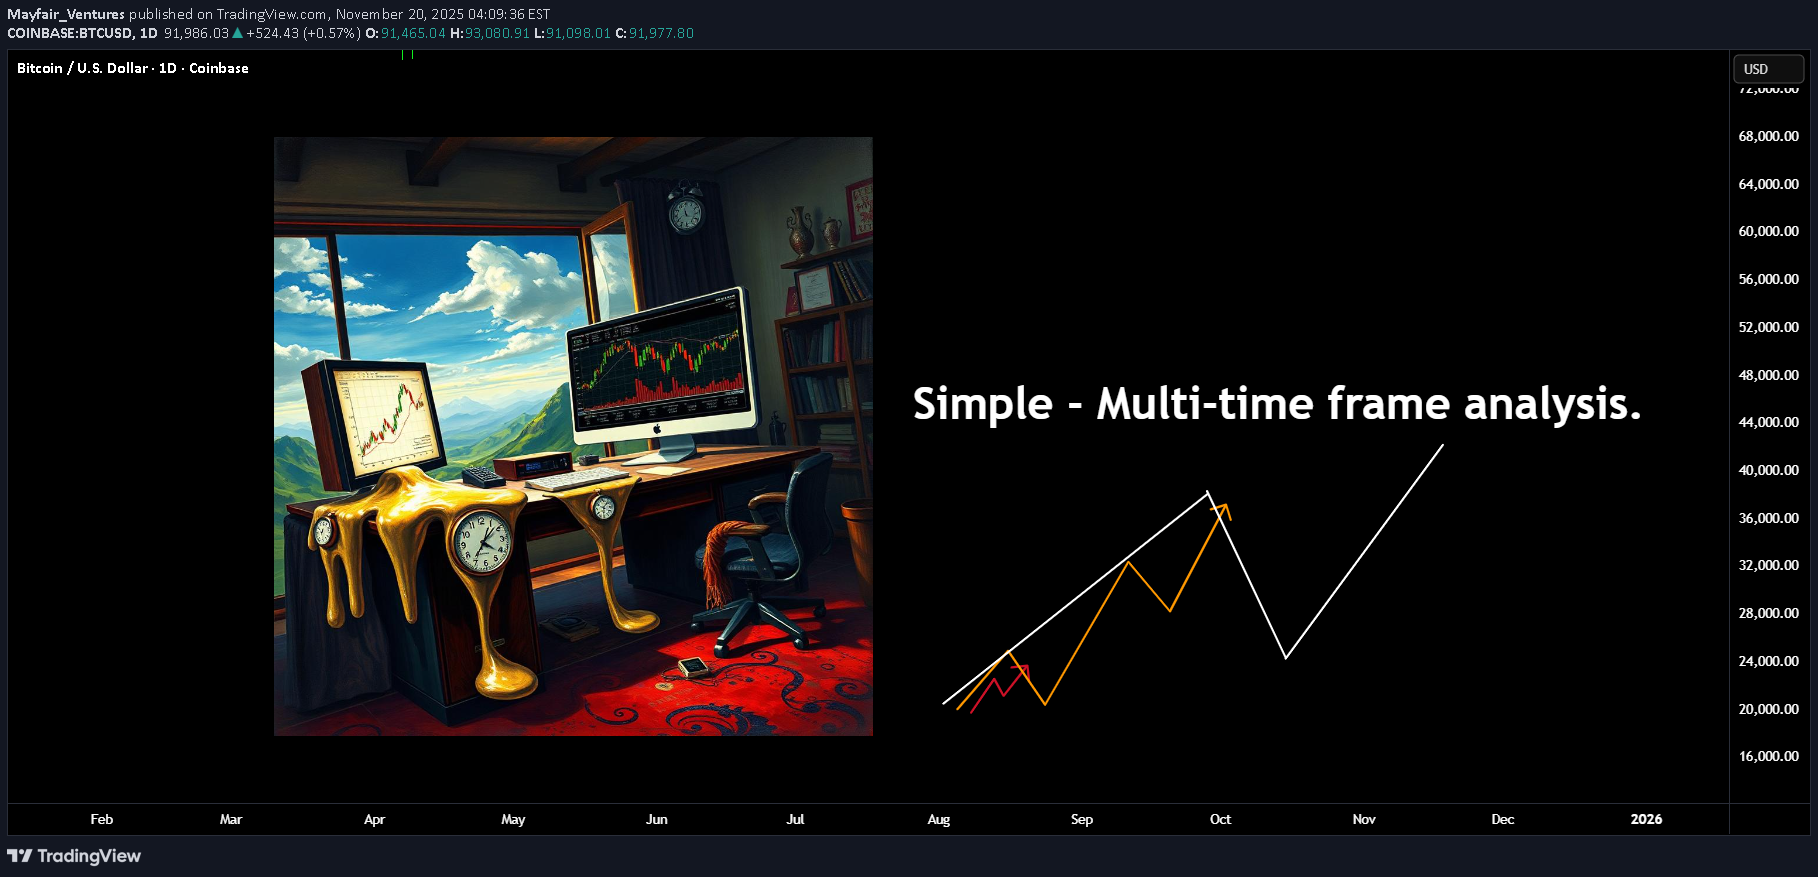
در اینجا زمینه دیگری وجود دارد که بسیاری از معامله گران با آن دست و پنجه نرم می کنند. ارزش واقعی در استفاده از تایم فریم های متعدد این است که بدانید به دنبال چه چیزی باشید و چه زمانی به دنبال آن باشید! همانطور که در بسیاری از پست هایم اشاره کرده ام، همه اینها به نظریه داو برمی گردد. شما نیازی ندارید که زندگی را به خودتان hard بسازید. در عوض، رویکرد خود را ساده کنید و تعداد کمی از تایم فریم ها را همسو کنید و از نتایج شگفت زده شد. اجازه بدهید مثالی بزنم؛ در این تصویر بالا، می توانید یک فشار بالا و سپس یک عقب کشیدن واضح را ببینید. چرا از این بالا استفاده نمی کنید؟ یک تغییر آشکار شخصیت به سمت منفی داشت. خوب، پاسخ این است - شما اینها را به عنوان بازه های زمانی جداگانه می بینید. اگرچه آنها دقیقاً در همان بازه زمانی تصویر من مشاهده می شوند. یکی را می توانید یک روند اولیه و دیگری را ثانویه بنامید. برای کمی عمق بیشتر، این پست را ببینید. اگر قبلاً با این ایده آشنا هستید، پس چیز بعدی که می درک کنید. روند اولیه در چه فازی است؟ هنگامی که به چارچوبهای زمانی ورود میپردازید، این مهم میشود، زیرا آنچه میخواهید انجام دهید درک یک سوگیری کلی است. هنگامی که این را درک کردید، حتی می توانید حرکات خلاف روند (در صورت تمایل) را معامله کنید. خوب، پس با آن گفته شد. بیایید تایم فریم دوم را اضافه کنیم. همانطور که می بینید، خط نارنجی نشان دهنده روند اولیه است، در حالی که مسیر داخلی white اکنون نشان دهنده روند ثانویه است. چرا این مهم است، زیرا در این مرحله، روند بزرگتر نیز می تواند یکی از دو کار را انجام دهد. رفتن به بالا یا پایین. بالا - پایین - هنگامی که روند بزرگتر را درک کردید، داخلی برای تسهیل مرحله بعدی آن درجه بالاتر کار کرد. البته، معکوس هایی وجود داشت (اما این برای پست دیگری است). کار با یک روند صعودی برای مثال. قیمت بالا می رود و سپس عقب می نشیند. اگر محدوده ها را بدانیم اخیرا در چندین پست به این موضوع پرداخته ام (مکانیکی). ما می توانیم به سرعت محدوده بازه زمانی بالاتر را شناسایی کنیم. هنگامی که قیمت از این محدوده شکسته شد، در مرحله ای، انتظار داشت که تغییر شخصیت در بازه زمانی کمتری را مشاهده کنید، که به سادگی شروع یک عقب نشینی در این بازه زمانی بالاتر است. چندین راه برای استفاده از این وجود دارد (دوباره، یک پست دیگر). اما کار با این مثال. اولین move بالای محدوده یک شبه یا زمانی که پشت میزتان نبودید اتفاق افتاد. اکنون اطلاعات لازم برای کار با فاز بعدی را دارید. با فرض اینکه قیمت در یک روند صعودی بزرگتر است، می شروع به همسو کردن این بازه های زمانی کنید. این بدون توجه به اینکه در کجای move هستید، صادق بود. اینها فقط نمونه هستند. این تصویر بالا روند ماشه را در تراز با بازه زمانی بالاتر نشان می دهد. این تصویر زیر خلاف این را نشان می دهد. البته، در اینجا ریسک بیشتری وجود دارد، زیرا روند بزرگتر به سمت دیگری می رود، اما تا زمانی که شما آن را تصدیق کنید، فرصت ها در هر دو جهت ظاهر می شوند. در اینجا چند مثال در مورد مکان یا نحوه استفاده از آن آورده شده است. گزینه دوم استفاده از بالاتر (ثانویه) نه ماشه، بلکه دقیقاً همان مفهوم است. در نهایت، گزینه سوم استفاده از هر سه تایم فریم است. اولاً، می دانید که move بزرگتر است. دوم شروع به تراز کردن کرده است. در نهایت، روند ماشه (مینور) دارای تغییر شخصیت است و اکنون انتظار دارید که move به سمت بالا ادامه دهد. این نسبت ریسک به پاداش بالاتری می دهد و اغلب از نظر نتیجه احتمال بالاتری دارد. به همین دلیل ساده، اکنون دو بازه زمانی بالاتر با یکدیگر موافق هستند. برخی از پست های دیگر مرتبط با این یکی هستند. به هر حال! راحت باش سلب مسئولیت این ایده به عنوان توصیه مالی محسوب نمی شود. این فقط برای اهداف آموزشی است، معامله گر اصلی ما بیش از 25 سال تجربه در سهام، ETF و فارکس دارد. از این رو، هر تنظیم تجاری ممکن است زمان های نگهداری، شرایط ورود یا خروج متفاوتی داشته باشد و با پست/ایده ای که در اینجا به اشتراک گذاشته شده است متفاوت است. شما می توانید از اطلاعات این پست برای ایجاد طرح معاملاتی خود برای ابزار مورد بحث استفاده کنید. معامله ریسک دارد؛ درصد بالایی از معامله گران خرده فروشی ضرر می کنند. لطفاً هنگام ورود به هر معامله ای این را در نظر داشته باشید. بمان safe.
Mayfair_Ventures
بزرگترین اشتباه معاملهگران مبتدی چیست؟ (راز سادگی در بازار)
پس از 25 سال انجام این بازی، دیدن همان مشکلات امروز برای معامله گران جدید که همیشه وجود داشته، باورنکردنی است. به طور خلاصه، پیچیدگی بیش از حد!!! معامله گران جدید اغلب به دنبال اطلاعات تا حد ممکن می گردند و ابزارها، صفحه نمایش ها، شاخص ها، بازه های زمانی، فیدهای خبری را اضافه می کنند. هر چیزی که به دنبال لبه است. به بیش از 100 سال قبل برگردید و چارلز داو - بله، همان داو پشت #DJI (متوسط صنعتی) یک چارچوب بسیار ساده برای درک بازارها ایجاد کرد. من چندین پست در اینجا نوشته ام TradingView در مورد تئوری داو در اینجا یکی از آنها است. در داخل این پست این تصویر را مشاهده کرد. برای برخی از شما که با اصول موج الیوت یا تکنیکهای Wyckoff آشنا هستید، ممکن است برخی از عناصر تصویری مانند این را تشخیص دهید. هم ریچارد ویکوف و هم رالف الیوت به چیزی علاقه داشتند. اما در طول سالها این تکنیکها به ایجاد هیبریدها «اضافه شدهاند» و پس از آن اغلب مفروضاتی ساخته میشوند. پیچیده کلید است... یا اینطور فکر می کنند. وقتی سعی میکنید یک چرخه موج الیوت را بر روی یک نمودار 5 دقیقهای بر روی ابزاری که به طور کامل توسط بازیگران سازمانی پذیرفته نشده است معامله کنید، در این صورت مشکل دارید. روانشناسی در معاملات بسیار مهمتر از 99.9 درصد از جنبه های دیگر تجارت است. بنابراین در حالی که مردم تمایل دارند به بخش تحلیل تکنیکال معاملات اضافه کنند، اغلب روانشناسی کنترل کننده بازار را نادیده می گیرند. من در مورد روانشناسی از نظر مدیریت ریسک ساده و حرکات با احتمال زیاد صحبت نمی کنم. من در مورد بخشی از مطالعات روانشناسی صحبت می کنم که توده ها را کنترل می کند. احساسات یک چیز است، روانشناسی که احساسات را هدایت می کند جایی است که معامله گران شکست خورده و در حال مبارزه به سادگی نادیده می گیرند. من یک پست نوشتم - سعی کردم کمی طنز اضافه کنم. در اینجا یک پست سیمپسون است. ========================================= بگذارید مثالی بزنم؛ مردم تمایل دارند از نشانگرهای ساده در قفسه استفاده کنند. اکنون که میلیون ها نفر از ابزارهای مشابه استفاده می کنند. چرا 90% + معاملهگران هنوز ضرر میکنند؟ در اینجا یک عکس فوری از MACD و RSI در کنار هم آورده شده است. اکنون به عملکرد قیمت دقت کنید. چه اطلاعات اضافی از این شاخص های عقب افتاده به دست می آورید (سوال بلاغی). . بیایید به روشی ساده به این موضوع نگاه کنیم. بدون اندیکاتور، نمودار تمیز، تئوری داو در تمرکز. هنگامی که قیمت به سمت بالا حرکت می کند، اغلب شاهد انباشتگی بود، سپس با رسیدن قیمت به حوزه بعدی مورد علاقه خود و شروع به عقب نشینی (بیش از حد ساده شده) دید، حتی در بازه های زمانی کوچکتر، زیرا این همیشه در یک بازه زمانی مشخص نیست. یک الگوی توزیع به طور کلی، عمل قیمت یک موج الیوت ساده move از نقطه صفر، تا یک و فشار به پایین برای دو ایجاد کرده است. جایی که این جالب و ساده می شود... آیا روانشناسی پشت آن است، شتاب افزایش اغلب توسط خریداران اولیه ایجاد می شود (بله، واضح است) این خریداران در حال انباشته شدن هستند. سپس، به عنوان خرده فروشی به دلیل RSI می گوید. قیمت عقب می کشد. این اغلب deep در منطقه ای است که به تازگی آن را ترک کرده است، خرده فروشی اغلب با استفاده از بازه های زمانی کوچک و توقف های فشرده - 5 پیپ، 10 پیپ. بنابراین شما اغلب یک PB با 11 پیپ (مثال) می بینید و این احساس را دارید که "چرا همیشه به استاپ من ضربه می زند و سپس به سمت دلخواه من می رود"؟ تکانه حاصل از گرفتن این توقف ها، سپس به ایجاد یک 2-3 move ضربه ای در شرایط EW ادامه می دهد. این دیگر به دستورات مخالف تبدیل نمی شود. بنابراین حرکتی برای شکستن اوج 1 move ایجاد می شود. توقف های جدید از شلوارک شروع می شود و معامله گران مومنتوم وارد موقعیت می شوند. همه اینها به یک رالی بزرگتر دامن میزند. حالا، وقتی این را تجزیه می کنید. شما می توانید محدوده ها را ترسیم کنید و در داخل این محدوده ها عمل کنید تا بایاس کلی را بدانید. و دقیقاً مانند آن، شما اغلب در سمت راست بازار هستید. در اینجا یک پست دقیق تر در مورد این جنبه وجود دارد. برای مثال در اینجا: تاب بزرگتر یک محدوده ایجاد می کند. بالا و پایین آشکار همانطور که در این تصویر مشخص شده است. سپس همانطور که داخل move اتفاق می افتد. به نظریه داو فکر کنید. بازار سرنخ بسیار واضحی را ارائه می دهد. ما به تازگی یک رکورد جدید را به ثبت رساندیم و بازار به دنبال نقدینگی است. آن move داخلی دارای یک فراکتال move در داخل بود. بیایید آن را یک ماشه move بنامیم. به خاطر داشته باشید، روند بزرگتر، سوگیری جهت آن را تغییر نمیدهد تا زمانی که پایینترین یا اوج تازه را بشکند. در حال حاضر، اگر چه قیمت لازم نیست. قیمت می تواند تا آخر به سطح پایین برگردد و روند بزرگتر را تغییر ندهد. هنگامی که با این موضوع کنار آمدید، تلاش برای پیش بینی بازار را متوقف کرد و در عوض با اقدام قیمت کار کرد. کمتر، واقعاً، بیشتر است! آخر هفته خوبی داشته باشید!!! سلب مسئولیت این ایده به عنوان توصیه مالی محسوب نمی شود. این فقط برای اهداف آموزشی است، معامله گر اصلی ما بیش از 25 سال تجربه در سهام، ETF و فارکس دارد. از این رو، هر تنظیم تجاری ممکن است زمان های نگهداری، شرایط ورود یا خروج متفاوتی داشته باشد و با پست/ایده ای که در اینجا به اشتراک گذاشته شده است متفاوت است. شما می توانید از اطلاعات این پست برای ایجاد طرح معاملاتی خود برای ابزار مورد بحث استفاده کنید. معامله ریسک دارد؛ درصد بالایی از معامله گران خرده فروشی ضرر می کنند. لطفاً هنگام ورود به هر معامله ای این را در نظر داشته باشید. بمان safe.
Mayfair_Ventures
Shocking Pattern Tricks That Make Trading Them Easy!
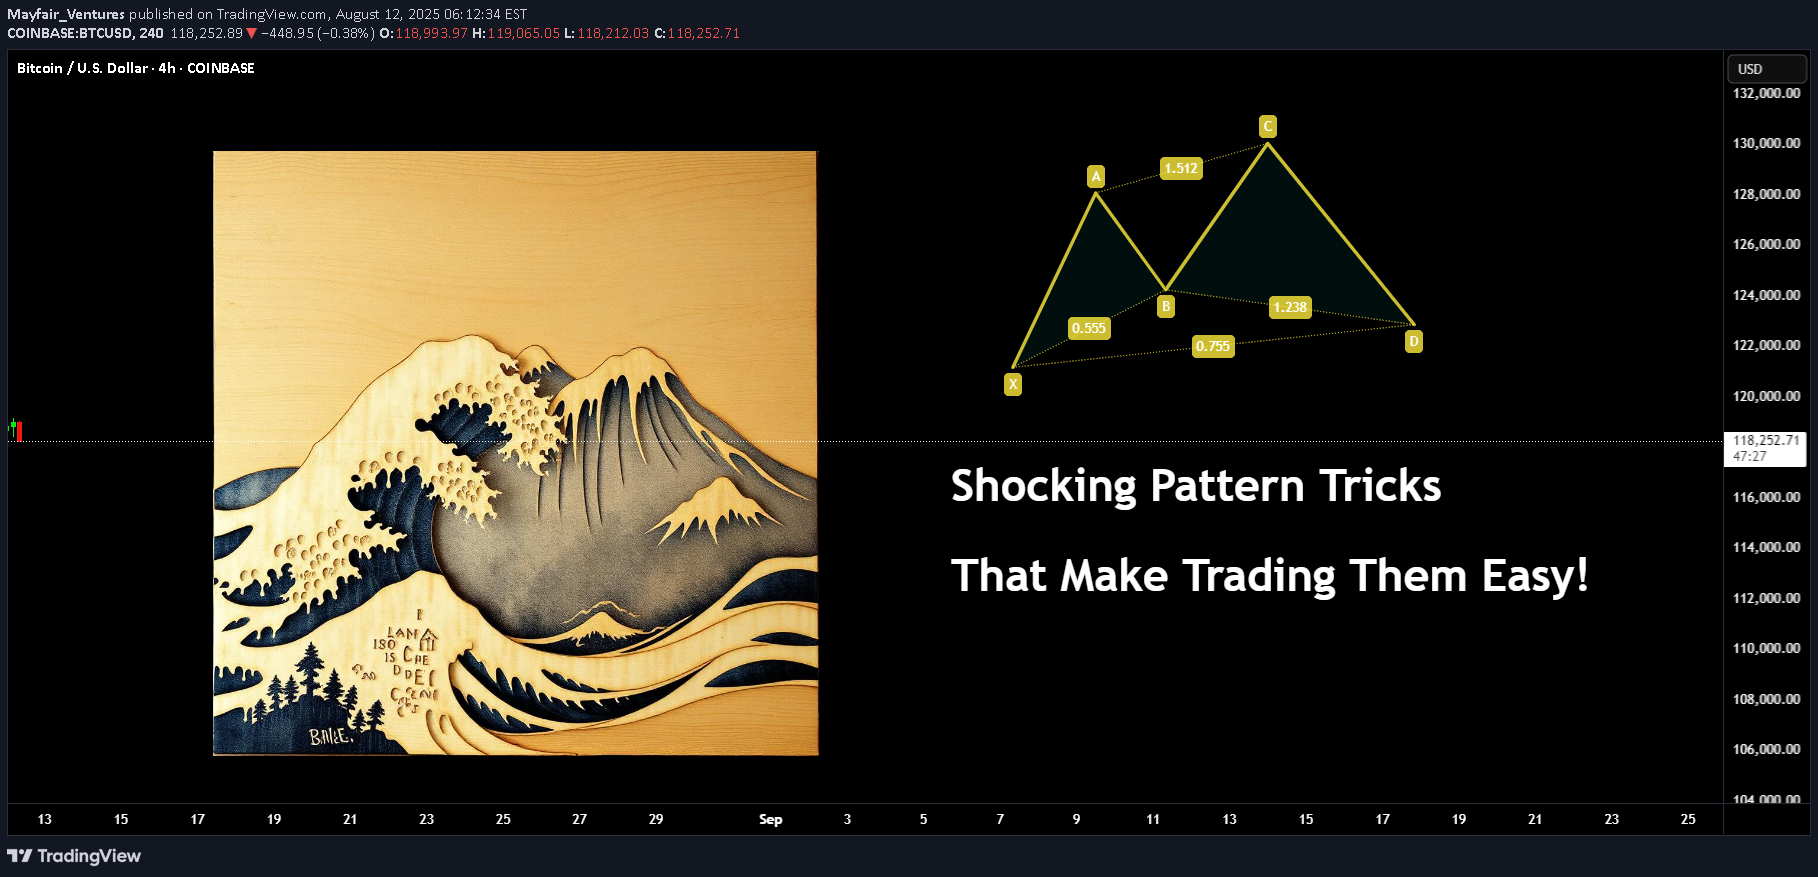
در اینجا یک دیدگاه کوچک دیگر وجود دارد که شاید قبلاً به آن فکر نکرده باشید. الگوهای معاملاتی محبوب تر از آن چیزی است که شما باور دارید. به نظر می رسد برخی فکر می کنند این magic یا نوعی secret است. مسئله این است که افراد تمایل دارند در مورد موارد اشتباه مانند روابط دقیق فیبوناچی و غیره تثبیت شوند. بگذارید بدون توجه به الگوی ، چیزی را برای ساده کردن مفهوم به شما نشان دهم. نمونه : شما ممکن است الگوی a خرچنگ را دیده باشید؟ آنچه پس از مشاهده یکی از آنها در نمودار انتظار دارید ، a move مانند این است. اما ، آیا تا به حال متوقف شده اید که فکر کنید اقدام قیمت در واقع چه می گوید؟ دارد صفر با روابط FIB. به این فکر کنید که روند چه کاری انجام می دهد من در چندین پست در اینجا اصول تئوری داو را پوشش داده ام. نمونه ای از چنین پست a در اینجا است (برای دیدن پست کامل باید روی تصویر کلیک کنید). خوب ، اکنون می توانید ببینید که این تنها بخشی از تعداد موج درجه بالاتر است. بیایید نمونه ای از نقدینگی و محدوده a را اضافه کنیم. آیا قبلاً شروع به دیدن آن می کنید؟ در اینجا a پست در محدوده ... الگوی را از a خرچنگ به a Bat تغییر دهید. حال به آن نگاه کنید و از نظر منطقی نمودار این الگوی چیست؟ هر دو نسخه صعودی و نزولی. در مورد تکنیک خوب و قدیمی سر و شانه ها چطور؟ اگر در مورد این الگوی مطمئن نیستید ، این بازار چیزی شبیه به این است (فقط مثالها) چیزی مانند "سطح اشتباه است" اظهار نظر نکنید ، همه اینها آزاد بودند تا مفهوم را بدون دقت نشان دهند. با نگاهی به الگوی H&S - در واقع می توانید منطق ساده شده را ببینید. باز هم ، اگر در مورد نقدینگی داخلی و خارجی نمی دانید ، در اینجا پست دیگری در مورد این موضوع وجود دارد. آنچه در آینده اتفاق می افتد تغییر ساختار داخلی است که در نهایت منجر به تغییر TF بالاتر ساختار می شود. و اگر قرار بود سطح فیبر یا شمارش موج الیوت را دنبال کنید ، متوجه می شوید که به طور منظم move داخلی به نظر می رسد. (در red مشخص شده است). این پست فقط به شما نشان می دهد که نمونه ای از آنها را نشان می دهد و چقدر می تواند این موارد آشکار باشد. پس از یادگیری اصول اولیه ، برای پیروی از قیمت و استفاده از این به نفع خود به نسخه پیچیده احتیاج ندارید. a هفته عالی! سلب مسئولیت این ایده به عنوان مشاوره مالی تشکیل نمی شود. این فقط برای اهداف آموزشی است ، معامله گر اصلی ما بیش از 25 سال تجربه در سهام ، ETF و فارکس دارد. از این رو هر مجموعه تجاری ممکن است زمان نگه داشتن ، شرایط ورود یا خروج متفاوتی داشته باشد و از پست/ایده مشترک در اینجا متفاوت بود. می توانید از اطلاعات این پست استفاده کنید تا برنامه معاملاتی خود را برای ابزار مورد بحث تهیه کنید. تجارت حمل و نقل a ریسک ؛ a درصد بالایی از بازرگانان خرده فروشی پول خود را از دست می دهند. لطفاً هنگام ورود به هر تجارت ، این موضوع را در خاطر داشته باشید. بمانید safe.
Mayfair_Ventures
Why the 95% fail
جای secret تعجبی نیست که بیش از ۹۰٪ معاملهگران خرد پول خود را از دست میدهند. منظور من پرتاب کردن مقداری پول به دنیای کریپتو و امید بستن به بردهای شانسی یا باختهای اتفاقی نیست. منظورم معاملهگری واقعی و کسب a درآمد از آن است. میبینید، وقتی شروع میکنید، تشنهی اطلاعات هستید - بهترین دوره کدام است، چه کسی بهترین استراتژی را دارد، اگر روی ۲۵ ابزار در a بازه زمانی ۱ دقیقهای معامله کنم چه میشود. مطمئنا سود بیشتری داشت... بعد از ۲۵ سال انجام این کار، شاهد آمد و رفت افراد هستید، گاهی اوقات آنها با a ایدهای جدید و سرمایه بیشتری برای تقدیم به بازار برمیگردند. اما در کل، برخی از core مشکلات این است که - همه چیز مهیاست، اما ایدهای وجود ندارد. مردم نه تنها در صفحهنمایشها، جدیدترین سختافزار و البته اشتراک افسانهای بلومبرگ برای اخبار ۲۴ ساعته سرمایهگذاری میکنند. اندیکاتورها چطور؟ آیا صفحهنمایش شما تا به حال a کمی شبیه این بوده است؟ مشکل اندیکاتورهای بیشتر این است که اکثر آنها نسبت به حرکت قیمت عقب میمانند، دوباره رنگ میشوند یا به سادگی مورد نیاز نیستند. سپس آن را با کمبود تجربه ترکیب کنید، و شما میمانید با این سوال که اگر RSI من بالاست اما میانگین متحرک به تازگی به پایین قطع شده است، بخرم یا بفروشم؟ شما تنها نیستید، اکثر معاملهگران این وضعیت را تجربه کردهاند، اگر نگوییم همه! وقتی که حتی کارگزاریها و صرافیها هم بر علیه شما میجنگند، hard کافی است - آیا تا به حال a فتیله کلاهبرداری را مستقیماً به سمت استاپ لاس خود دیدهاید و دوباره برگشته است؟ مدل A-book در مقابل مدل B-book چطور؟ در مدل A-book، کارگزار معاملات مشتریان خود را مستقیماً به بازار منتقل میکند. اساساً، کارگزار به عنوان a واسطه عمل میکند و معاملات را از طرف مشتریان در بازار آزاد انجام میدهد. این بدان معناست که سود کارگزار در درجه اول از کمیسیونها و اسپردها به دست میآید تا اینکه بر خلاف مشتری معامله کند. در مدل B-book، کارگزار طرف مقابل معاملات مشتری را میگیرد و اساساً به عنوان طرف مقابل عمل میکند. به جای ارسال معاملات به بازار آزاد، کارگزار آنها را به صورت داخلی نگه میدارد. مورد بعدی که همیشه مرا به خنده میاندازد، استراتژی با win درصد نرخ موفقیت است که شخصی آن را خودکار کرده است و با a چند صد دلار، همهاش مال شماست!! ببینید، اگر a راهحل جادویی وجود داشت، a استراتژی برندهی ۱۰۰٪ که میتوانستید آن را آماده بخرید - ما هیچ حرفه دیگری روی این کره خاکی نداشتیم! جمعیت جهان معاملهگران حرفهای میشدند. ضربالمثل را میدانید که «اگر چیزی آنقدر خوب به نظر میرسد که باورنکردنی است، احتمالاً همینطور است». شما امواج الیوت را waves میبینید، جایی که حق ندارند باشند. به سادگی هیچ منطقی وجود ندارد یا از آنها در a نمودار تیک استفاده میکنید و به دنبال معجزه هستید. در مورد گرفتن مشاوره مالی از a نوجوان جوشدار که a ماشین اسپرت را برای a فیلمبرداری بعد از ظهر امروز اجاره کرده است، چطور؟ بله، به نظر a نقشهی خوبی برای کمک به بازنشستگی زودهنگام شما میرسد! ============================== خب، چگونه از همهی این چیزها اجتناب کنیم؟ خب، برای شروع، نمودار TradingView خود را، روی a لپتاپ یا دسکتاپ معمولی با یک صفحهنمایش، با حذف همهی اندیکاتورها و افزایش بازه زمانی تنظیم کنید. سپس تعداد جفت ارزهایی را که بررسی میکنید کاهش دهید و آنها را بشناسید. با آنها مانند a زبان جدید رفتار کنید. ویژگیهای شخصیتی، نحوهی رفتار آنها در اطراف major رویدادهای خبری، چه اتفاقی برای آنها میافتد اگر دلار بالا برود یا نفت ۵ درصد کاهش یابد را بیاموزید. با معاملهگری مانند a یک بازی رفتار نکنید. در عوض، با آن مانند a یک کسبوکار رفتار کنید، از ساعاتی که با سبک زندگی شما سازگار است استفاده کنید. مدیریت ریسک مناسب را به کار بگیرید. آن را به عنوان a یک معامله و win یکباره نبینید. با احترام با آن رفتار کنید و از آن به صورت هفتگی سود ببرید. دید، وقتی یاد میگیرید ریسک را به درستی مدیریت کنید، اهمیت بسیار کمی به بالا یا پایین رفتن بازارها میدهید. تمایل دارید با آرامش بخوابید و a موجودی بانکی رو به رشد داشته باشید. بازار سربازان زیادی دارد که در کنارش میجنگند و تمام تلاشش را میکند تا شما را برای جنگیدن علیه خودتان استخدام کند! به طور خلاصه، صفحهنمایشهای کمتر، data ورودیهای کمتر (اندیکاتورها)، ابزارهای کمتر، بازههای زمانی بالاتر، نادیده گرفتن اینفلوئنسرها، مدیریت ریسک مناسب و یادگیری این که هیچ راهحل جادویی وجود ندارد. معاملهگری آمار است و تمام. شما میتوانید با a نرخ موفقیت پایین و a نسبت ریسک به پاداش زیاد بسیار سودآور باشید. یا به سادگی یک a سود ۲٪ در ازای ۱٪ ضرر و a نرخ win موفقیت ۵۰/۵۰ باز هم شما را سودآور میکند! سلب مسئولیت این ایده به عنوان مشاوره مالی تلقی نمیشود. این فقط برای اهداف آموزشی است، معاملهگر اصلی ما بیش از ۲۵ سال تجربه در سهام، ETF و فارکس دارد. از این رو، هر تنظیم معامله ممکن است زمان نگهداری، شرایط ورود یا خروج متفاوتی داشته باشد و با پست/ایدهای که در اینجا به اشتراک گذاشته شده است، متفاوت باشد. میتوانید از اطلاعات این پست برای تهیه برنامه معاملاتی خود برای ابزار مورد بحث استفاده کنید. معاملهگری دارای a ریسک است. a درصد بالایی از معاملهگران خرد پول خود را از دست میدهند. لطفاً هنگام ورود به هر معاملهای این را در نظر داشته باشید. safe ایمن بمانید.
Mayfair_Ventures
Internal and external liquidity
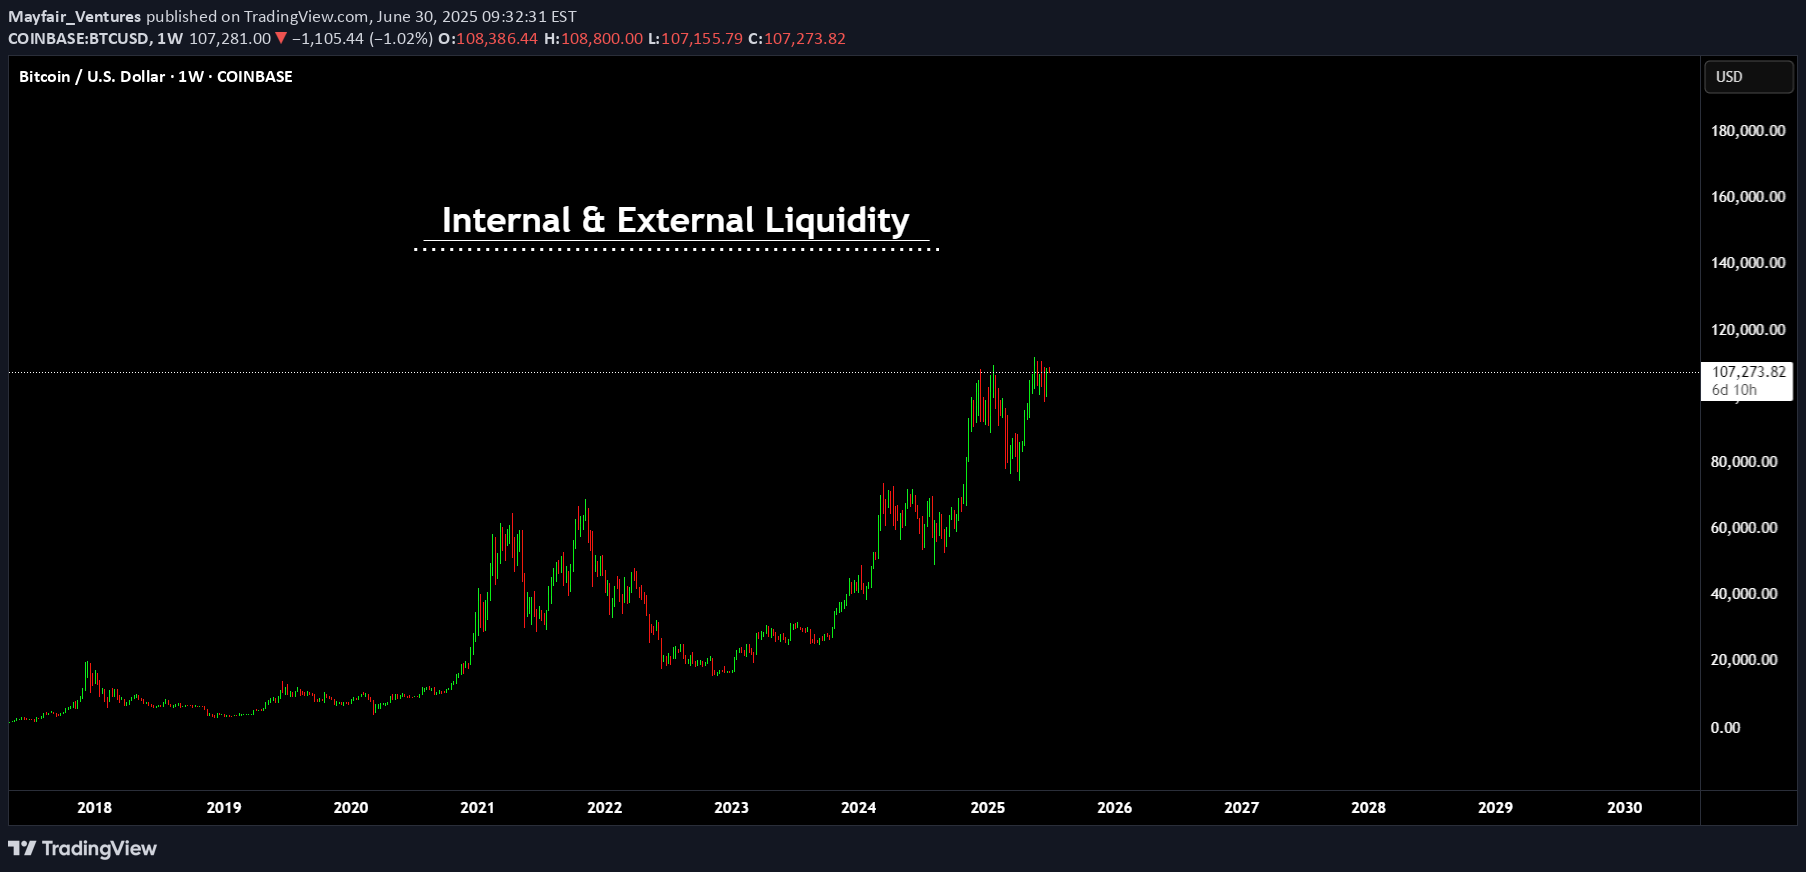
در اینجا یک درس مکانیکی دیگری برای شما وجود دارد. در آخرین پست من یک تکنیک مکانیکی را برای شناسایی دامنه نوسان پوشانده ام. مبتنی بر قانون ، ساده و قابل تکرار. در این پست می تکنیک کوچک دیگری را به اشتراک بگذارم ، دوباره بخشی از سری مکانیکی. اما این بار می در مورد نقدینگی صحبت کنم. بیشتر معامله گران در مورد نقدینگی صحبت می کنند ، حتی ممکن است درک آنچه در آن است داشته باشند. اما بیشتر آنها نمی دانند که چگونه نقدینگی احساسات را تشکیل می دهد و چگونه این نوع algo را برای بازار ایجاد می کند. شاید شما از نظریه موج الیوت شنیده باشید. یک جمله در این مورد وجود دارد "شما از 10 معامله گران الیوت برای تعداد آنها می پرسید و 11 پاسخ می گیرید". اما نکته اینجاست ، وقتی مفهوم را ساده می کنید ، مشخص است که احساسات ناشی از نوسانات نقدینگی همان چیزی است که باعث ایجاد الگوی قابل تکرار در بازار می شود. بیایید ایده از آخرین پست من را بگیریم. اکنون پس از یک مقدار عادلانه انباشت ، این سطح "دفاع" می شود - قیمت به تدریج افزایش می یابد تا ضررهای توقف کوتاه قدیمی برچسب گذاری شود و ورودی های طولانی جدید وارد شوند. این به بازیکنان نهادی اجازه می دهد تا بدون خاموش کردن زنگ های زنگ ، سفارشات خود را باز کنند. قیمت سپس از نقدینگی خارجی برای یافتن نقدینگی داخلی باز می گردد (بیشتر در این مورد در پست بعدی). اما پس از آن به دنبال اوج تازه بعدی است. با قرار دادن اوج ، می توانیم از تکنیک دامنه استفاده کنیم تا دامنه خود را به منطقه جدید منتقل کنیم ، همانطور که در تصویر بالا مشاهده می شود. در مرحله بعد ، ما به دنبال یک حرکت داخلی بود ، نه فقط داخلی در محدوده ، بلکه یک حرکت فراکتال در بازه زمانی کوچکتر که باعث عقب نشینی می شود. این را به رنگ آبی ببینید. منطق در اینجا ساده است ؛ در بازه های زمانی کوچکتر شاهد تجمع در منطقه 2 بوده ایم و به عنوان 3 سنبله می شویم. ما شاهد توزیع در بازه های زمانی کوچکتر بود. Wyckoff این را تجمع نامید و به دنبال آن یک علامت گذاری و سپس توزیع و علامت گذاری به پایین. این الگوی است ، بارها و بارها که منجر به این نوع ساختار می شود. این امر توسط تحلیلگران مختلفی که آن را مانند سر و شانه ها می نامند ، دوباره مارک می شود ، پول هوشمند قبل از شکستن ساختار ، تغییر شخصیت و آزمایش مجدد را مشاهده می کند. این همه یک چیز است - فقط یک کنوانسیون نامگذاری متفاوت. باز هم ، امیدوارم که این به بعضی از شما در آنجا کمک کند! سلب مسئولیت این ایده به عنوان مشاوره مالی تشکیل نمی شود. این فقط برای اهداف آموزشی است ، معامله گر اصلی ما بیش از 25 سال تجربه در سهام ، ETF و فارکس دارد. از این رو هر مجموعه تجاری ممکن است زمان نگه داشتن ، شرایط ورود یا خروج متفاوتی داشته باشد و از پست/ایده مشترک در اینجا متفاوت بود. می توانید از اطلاعات این پست استفاده کنید تا برنامه معاملاتی خود را برای ابزار مورد بحث تهیه کنید. تجارت ریسک دارد. درصد بالایی از بازرگانان خرده فروشی پول خود را از دست می دهند. لطفاً هنگام ورود به هر تجارت ، این موضوع را در خاطر داشته باشید. بمانید safe.
Mayfair_Ventures
Bitcoin Smart money part 1
در اینجا یک پست کوچک در مورد اینکه چرا ایده های SMC بخشی از تصویر بزرگتر هستند - مطمئن نبودم که آیا این ایده های ویدیویی جدید به 15 دقیقه محدود شده اند. مطمئناً من آن را در جایی خوانده ام. من یک فیلم دیگر را طی چند روز آینده به هر صورت انجام می دهم. در حال حاضر من فکر می کنم ما هنوز مشغول کار دور نیستیم. Link به پست دیگر ؛ سلب مسئولیت این ایده به عنوان مشاوره مالی تشکیل نمی شود. این فقط برای اهداف آموزشی است ، معامله گر اصلی ما بیش از 20 سال تجربه در سهام ، ETF و فارکس دارد. از این رو هر مجموعه تجاری ممکن است زمان نگه داشتن ، شرایط ورود یا خروج متفاوتی داشته باشد و از پست/ایده مشترک در اینجا متفاوت بود. می توانید از اطلاعات این پست استفاده کنید تا برنامه معاملاتی خود را برای ابزار مورد بحث تهیه کنید. تجارت ریسک دارد. درصد بالایی از بازرگانان خرده فروشی پول خود را از دست می دهند. لطفاً هنگام ورود به هر تجارت ، این موضوع را در خاطر داشته باشید. بمانید safe.
Mayfair_Ventures
The Parallels of Trading and Golf

به عنوان یک معامله گر حرفه ای ، اما گلف باز آماتور. اخیراً سعی کرده است شباهت ها را به خصوص در جنبه عاطفی گلف و تجارت برای کسی توضیح دهد. فکر کردم ممکن است مقاله جالبی ایجاد کند. گلف ، دقیقاً مانند تجارت ، ترکیبی پیچیده از مهارت ، استراتژی و روانشناسی است. در حالی که تجارت شامل پیمایش در بازارهای مالی است ، گلف به مانور ماهر در زمین های چالش برانگیز نیاز دارد. هر دو فعالیت نیاز به یک طرز فکر استراتژیک ، توانایی سازگاری و مقاومت در برابر رسیدگی به اوج و پایین بودن عاطفی دارند. باشگاه مناسب برای شوت در گلف ، یک بازیکن از باشگاه های مختلفی انتخاب می کند که هر یک برای نوع خاصی از عکس و فاصله طراحی شده است. در تجارت ، یک سرمایه گذار از استراتژی های مختلفی متناسب با ابزارها و بازه های زمانی خاص استفاده می کند. همانطور که یک گلف باز نمی تواند از راننده برای یک بسته بندی نزدیک استفاده کند ، یک معامله گر نباید یک استراتژی سرمایه گذاری بلند مدت را در یک بازه زمانی 1 دقیقه ای اعمال کند. نکته مهم این است که درک کدام ابزارهایی برای استفاده از این مجموعه ، خواه انتخاب گوه برای فرار از یک پناهگاه یا یک راننده برای انفجار توپ در زیر راهرو باشد. سناریوهای مختلف زمین های گلف مملو از چالش های متنوع است ، از 5 سال طولانی تا پارامترهای پیچیده و همچنین 4s وحشتناک بیش از حد طولانی برای رانندگی ، اما در عین حال فنی. یک گلف باز باید رویکرد خود را با دشواری هر سوراخ سازگار کند ، همانطور که یک معامله گر باید به شرایط مختلف بازار پاسخ دهد. یک شلیک ضعیف در یک گروه 5 ممکن است با بازی دقیق بعدی بهبود یابد ، مشابه این که معامله گران می توانند با اقدامات برنامه ریزی شده در معاملات بعدی از ضرر بازگردند. موفقیت در هر دو زمینه متکی به تطبیق با شرایط است و در عین حال روی هدف کلی تمرکز دارد. به یاد داشته باشید که 18 پین در زمین گلف وجود دارد ، یک ضربه بد حساب را فلج نمی کند (منظورم این است که بازی را تمام نمی کند). مدیریت احساسات گلف به دلیل القاء طیف گسترده ای از احساسات ، از ناامیدی یک قضیه از دست رفته گرفته تا سرخوشی یک درایو عالی ، بدنام است. تجارت پاسخهای عاطفی مشابهی را ایجاد می کند. هیجان یک تجارت سودآور با ناامیدی ضرر به شدت تضاد دارد. آیا تا به حال متوجه شده اید که زودتر سود می گیرید و اجازه می دهید ضرر و زیان خیلی طولانی شود؟ بله عدم تمایل توپ در جنگل یکسان است ، اما ما هنوز به راننده می رسیم. هم گلف باز و هم معامله گران باید برای حفظ تمرکز و تصمیم گیری های منطقی ، احساسات خود را به طور مؤثر مدیریت کنند. نظم و انضباط عاطفی حیاتی است. اجازه دادن به احساسات دیکته اقدامات غالباً منجر به اشتباه می شود ، خواه در ناامیدی بیش از حد و یا خرید و فروش یا فروش سهام بیش از حد باشد. مدیریت ریسک در هر سناریو. یادگیری و بهبود گلف بازان حرفه ای به طور مداوم برای اصلاح نوسانات و بهبود بازی خود تلاش می کنند. به همین ترتیب ، معامله گران باید متعهد به آموزش مداوم و بهبود خود باشند. پزشکان یا وکلا پس از تماشای یک یا دو فیلم به صورت آنلاین ، حرفه ای نمی شوند. نه معامله گر. تجزیه و تحلیل اجراهای گذشته ، خواه بررسی یک بازی گلف یا ارزیابی نتایج معاملات ، برای شناسایی زمینه های بهبود و تنظیم استراتژی های تنظیم دقیق به جلو بسیار مهم است. اما فقط شما می توانید این کار را "صادقانه" انجام دهید که ادعای پرنده ای را انجام دهید وقتی که باید به عنوان یک خنجر مشخص شود ، فقط خود را تقلب می کند. برای تسلط بر هنر پیگیری تسلط در گلف و تجارت یک سفر مادام العمر است. هیچ یک از زمینه ها میانبرهایی برای موفقیت ارائه نمی دهند. هر دو نیاز به فداکاری ، تمرین و مقاومت دارند. با این حال ، احساس موفقیت و پاداش از تسلط بر یک زمین گلف چالش برانگیز یا با موفقیت در مرور بازارهای پیچیده می تواند بسیار رضایت بخش باشد و هنوز هم که یک عکس بد از بین بردن روح است. سلب مسئولیت این ایده به عنوان مشاوره مالی تشکیل نمی شود. این فقط برای اهداف آموزشی است ، معامله گر اصلی ما بیش از 20 سال تجربه در سهام ، ETF و فارکس دارد. از این رو هر مجموعه تجاری ممکن است زمان نگه داشتن ، شرایط ورود یا خروج متفاوتی داشته باشد و از پست/ایده مشترک در اینجا متفاوت بود. می توانید از اطلاعات این پست استفاده کنید تا برنامه معاملاتی خود را برای ابزار مورد بحث تهیه کنید. تجارت ریسک دارد. درصد بالایی از بازرگانان خرده فروشی پول خود را از دست می دهند. لطفاً هنگام ورود به هر تجارت ، این موضوع را در خاطر داشته باشید. بمانید safe.
Mayfair_Ventures
The Bitcoin Lotto

به یاد داشته باشید وقتی هیجان قرعه کشی همه چیز در مورد پتانسیل های تغییر زندگی فقط از قیمت بلیط کوچک بود؟ امروز به جلو بروید ، و Bitcoin به عنوان جدید frontier این پتانسیل هیجان انگیز ظاهر شده است. پس از قیمت 1000 دلار فروتن ، Bitcoin در دسترس بود و با قول قول می داد. امروز ، با ارزش خود به اندازه 60،000 دلار ، چشم انداز غیرقابل انکار است و فرصت ها و ملاحظات جدیدی را برای سرمایه گذاران در سراسر جهان ارائه می دهد. Bitcoin فقط یک ارز دیجیتال نیست. این انقلابی است که در حال تغییر شکل بازارهای مالی است ، دقیقاً مانند پیش بینی ضربه زدن به جکپات. با این حال ، بر خلاف قرعه کشی سنتی ، Bitcoin سرمایه گذاری صرفاً در مورد شانس نیست-این مربوط به تصمیم گیری هوشمندانه ، آگاهانه ، بینش تاریخی و پتانسیل های آینده است. تصور کنید که بخشی از یک تکامل تکنولوژیکی است که فقط یک بازی شانس نیست بلکه یک گام محاسبه شده در جهت توانمندسازی مالی است. هنگام پیمایش در این بازارها ، می از اتاق های اکو پاک شوید. ما در سال 2021 دمای "98K ماه آینده و 135،000 دلار در ماه دسامبر" داشته ایم. مسئله اصلی در مورد احساسات در سطح فعلی ، به نظر می رسد همه و سگ آنها Bitcoin زیر 20،000 دلار در پایین دقیق خریداری کرده اند. آنها همچنین با Longs در 69k تماس می گرفتند. این یک تورم تورم است ، فقط 12 ETF تأیید شده است ، یک ضرب قیمت وجود دارد ، خانه خود را بفروشید و Bitcoin را بخرید. به نظر می رسد Trump ممکن است win کاخ سفید و البته او Bitcoin را تأیید کرده است. در عوض ، این سؤال نباید واقعاً "این باشد که کجا می رود" باید این باشد که "چرا هنوز آنجا نیست". من چند بار شوخی کردم - اگر در سال 2021 خانه ای را در 69،000 خریداری کرده اید و اکنون در سال 2024 ارزش آن 59،000 ارزش دارد اگر آن را بفروشید یا آن را نگه دارید ، من پاسخ هایی مانند "شما باید Bitcoin خریداری کرده اید" ... این یک ضرب و شتم علیه رمزنگاری نیست. این دانستن ارزش و درک درک در مقابل معضل واقعیت است. جنبه کنترل شده این حرکت از 15 کیلوگرم به 73 و آن که فقط به اندازه کافی از نقدینگی مانند 65k تا 69k است. سالها از هم فاصله دارد ، به این معنی که کنترل زیادی در دارایی وجود دارد که بسیاری از آنها ادعا می کنند "نمی توان کنترل کرد". احساسات همه چیز در مورد آزادی و آزادی بود. بدون کنترل نهادی ، بدون کنترل دولت - برو ترامپ ، برو سیاه. سوالات من باقی مانده است ، اگر شما با قیمت های زیر 10K خوش شانس بودید - تجارت خوبی داشته اید (به شرط اینکه به شما سودمند سود می برید) دستاوردهای کاغذ برنده نیست. اما بودجه اضافی برای دو برابر قیمت فعلی آن از کجا تأمین می شود؟ چرا ما در 100k+ در حال حاضر پس از تأیید <111> ، نصف ، یک ضرب قیمت ، 12 ETF تأیید شده است؟ دنیای رسانه های اجتماعی باعث شده است که رزمندگان کیبورد بتوانند هر پایین را بدست آورند ، هر صدر را بفروشند (اما هرگز چیزی نروند) و ادعای دستاوردهای کاغذ را به ماه می دهند. سرمایه گذاری لازم نیست همان بلیط لوتو باشد. این فقط به درک خوبی نیاز دارد که چرا نقدینگی به روشی که انجام می دهد حرکت می کند و چه کسی سود آن را معمولاً باز می گرداند. به هر حال - غذا برای فکر این آخر هفته! یکی خوب داشته باشید بمانید safe
سلب مسئولیت
هر محتوا و مطالب مندرج در سایت و کانالهای رسمی ارتباطی سهمتو، جمعبندی نظرات و تحلیلهای شخصی و غیر تعهد آور بوده و هیچگونه توصیهای مبنی بر خرید، فروش، ورود و یا خروج از بازارهای مالی نمی باشد. همچنین کلیه اخبار و تحلیلهای مندرج در سایت و کانالها، صرفا بازنشر اطلاعات از منابع رسمی و غیر رسمی داخلی و خارجی است و بدیهی است استفاده کنندگان محتوای مذکور، مسئول پیگیری و حصول اطمینان از اصالت و درستی مطالب هستند. از این رو ضمن سلب مسئولیت اعلام میدارد مسئولیت هرنوع تصمیم گیری و اقدام و سود و زیان احتمالی در بازار سرمایه و ارز دیجیتال، با شخص معامله گر است.