
ManiMarkets
@t_ManiMarkets
تریدر چه نمادی را توصیه به خرید کرده؟
سابقه خرید
تخمین بازدهی ماه به ماه تریدر
پیام های تریدر
فیلتر
نوع پیام

ManiMarkets
طلا (XAUUSD) رکورد شکست! هدف بعدی: ۴۴۰۰ دو قله!

🚀 XAUUSD: رالی احیاگر طلا، سطح کلیدی را شکست، 4400 دوبل در دید! بازه زمانی: نمودار 4 ساعته طلا (XAUUSD) در نمودار 4 ساعته در حال حاضر حرکت صعودی استثنایی را نشان میدهد و با ثبات در حدود 4220 دلار معامله میشود. گرانبها metal بازیابی قدرتمندی را انجام داده است، و قاطعانه از منطقه قیمتی مهم تاریخی عبور کرده است، که نشان دهنده اعتقاد قوی خریدار است. تحلیل روند و اقدام قیمت فعلی: طلا پس از تشکیل یک «دوباله در 4400» در اواسط اکتبر و متعاقباً تجربه یک افت شدید که حمایت حیاتی در منطقه «حمایت فوری» 3900 پیدا کرد، یک مسیر صعودی قابل توجهی را آغاز کرد. قیمت رشد فعلی خود را از این پایه قوی آغاز کرد و به طور سیستماتیک زمین های از دست رفته را پس گرفت. ابتدا به بالای «منطقه کلیدی» 4000 (که قبلا شکسته شده بود) حرکت کرد و با ایجاد 4100 به عنوان «پشتیبانی جدید» پس از یک عقبنشینی و پرش سالم، موقعیت خود را مستحکم کرد. مهمتر از همه، XAUUSD اکنون با موفقیت سوراخ شده است و بالای منطقه 4150 تا 4250 معامله میشود که به عنوان "پشتیبانی قبلی" برچسب گذاری شده است. این منطقه قابل توجه بود. در ابتدا به عنوان پشتیبان عمل کرد، سپس پس از شکسته شدن به سمت مقاومت برگشت، و اکنون دوباره بر آن غلبه کرده است، که نشان دهنده یک تغییر قدرتمند در کنترل است. فلش white به وضوح این شکست قاطع را نشان می دهد. این صعود قوی و چند میله ای نشان می دهد که گاوها در فرمان قوی هستند و ساختار نزولی قبلی به طور موثر واژگون شده است. سطوح مقاومت کلیدی: 4150 تا 4250 پشتیبانی قبلی (اکنون به عنوان مقاومت شکسته می شود): در حالی که به عنوان "پشتیبانی قبلی" علامت گذاری شده است، فلش white نشان می دهد که اکنون به سمت بالا شکسته شده است و اساساً بر یک مانع مقاومت کلیدی که پس از شکست اولیه تشکیل شده است غلبه می کند. نگه داشتن پایدار بالای این منطقه بسیار مهم است. سقف دوبل در 4400: این نشان دهنده بالاترین رکورد قبلی است و مانع روانی و فنی نهایی و مهم است. با توجه به حرکت فعلی، این سطح هدف major بعدی برای شارژ صعودی بود. سطوح پشتیبانی کلیدی: پشتیبانی جدید 4100: پس از رالی و شکست قوی، این سطح به عنوان پشتیبانی فوری حیاتی تعیین شده است. یک آزمون مجدد و موفقیت آمیز در اینجا یک تثبیت سالم برای ادامه حرکت صعودی بود. 4000 Key Zone Broke: این ناحیه که قبلاً پس از شکستن از بالا به عنوان مقاومت عمل می کرد، اکنون به عنوان یک تکیه گاه ثانویه قوی ایستاده است. این یک سطح روانی و فنی قابل توجه است. پشتیبانی فوری 3900: این منطقه سبز جامد به عنوان سکوی پرتاب برای رالی فعلی عمل کرد و نشان دهنده قوی ترین پشتیبانی اساسی است. برای حفظ روند صعودی گسترده تر حیاتی است. سناریوی صعودی: چشم انداز طلا در حال حاضر بسیار صعودی است. تا زمانی که XAUUSD بتواند موقعیت خود را بالای منطقه «پشتیبانی قبلی» 4150 تا 4250 حفظ کند، و در حالت ایدهآل، «پشتیبانی جدید» 4100 را در هر عقبنشینی جزئی نگه دارد، مسیر برای چالش مستقیم «دوبال در 4400» روشن است. افزایش حجم خرید و بسته شدن پایدار در سطوح بالاتر این مسیر صعودی قوی را بیشتر تقویت می کند. سناریوی نزولی: با وجود قدرت فعلی، یک معکوس شدید ممکن است رخ دهد. شکست قاطع در زیر 4100 'پشتیبانی جدید' اولین علامت هشداردهنده مهم بود. این می تواند منجر به آزمایش مجدد 4000 'Key Zone' شود. نقض زیر 4000 نشان دهنده اصلاح عمیق تر نسبت به "حمایت فوری" 3900 است و تز صعودی کوتاه مدت فعلی را به طور جدی به خطر می اندازد. نتیجه گیری: طلا در حال حاضر در یک روند صعودی قدرتمند قرار دارد و به طور قاطع از منطقه بحرانی بین 4150 تا 4250 عبور کرده است. حرکت به شدت با گاوها همراه است و 'دوبالا در 4400' هدف بزرگ بعدی است. معامله گران باید از نزدیک بر روی 4100 "New Support" برای قدرت پایدار نظارت کنند، اما در حال حاضر، به نظر می رسد مسیر کمترین مقاومت رو به بالا باشد. سلب مسئولیت: اطلاعات ارائه شده در این نمودار صرفاً جنبه آموزشی و اطلاع رسانی دارد و نباید به عنوان مشاوره سرمایه گذاری در نظر گرفته شود. تجارت و سرمایه گذاری شامل ریسک قابل توجهی است و برای هر سرمایه گذار مناسب نیست. قبل از هر تصمیمی برای سرمایه گذاری باید وضعیت مالی خود را به دقت بررسی کنید و با یک مشاور مالی مشورت کنید. سازنده این نمودار هیچ نتیجه یا سود خاصی را تضمین نمی کند و مسئولیتی در قبال زیان های وارده در نتیجه استفاده از این اطلاعات ندارد. عملکرد گذشته نشان دهنده نتایج آینده نیست. از این اطلاعات با مسئولیت خود استفاده کنید. این نمودار برای بهبود خود من در تحلیل تجارت و سرمایه گذاری ایجاد شده است. لطفا قبل از هر سرمایه گذاری تحلیل خود را انجام دهید.

ManiMarkets
سولانا در خطر سقوط: آیا حمایت ۱46-148 تاب میآورد؟

📉 SOLUSD: مبارزه با روند نزولی در زیر منطقه کلیدی – پشتیبانی 146-148 در تمرکز! بازه زمانی: نمودار 4 ساعته مقدمه: Solana (SOLUSD) در نمودار 4 ساعته همچنان احساسات نزولی غالب را منعکس می کند و در حال حاضر حدود 153.97 دلار معامله می شود. قیمت در یک روند نزولی مداوم گرفتار شده است و مکرراً نتوانسته است یک بهبود پایدار بالاتر از سطوح مقاومت بحرانی ایجاد کند. تحلیل روند و اقدام قیمت فعلی: Solana از زمان اوج خود در اواخر اکتبر تحت فشار فروش قابل توجهی قرار گرفته است و یک روند نزولی واضح را از طریق یک سری از اوج ها و نزول های پایین تر ایجاد کرده است. یک خط روند نزولی برجسته red همواره به عنوان مقاومت پویا عمل می کند و تلاش های متعدد گاوها برای فشار به بالاتر را رد می کند. اخیراً، SOLUSD تلاش کرد تا بازیابی کند، و به منطقه کلیدی 160 تا 165 رسید، اما با رد شدید این منطقه و خط روند نزولی در حدود 10 تا 11 نوامبر مواجه شد. این رد قیمت را پایین آورد و در حال حاضر در زیر این منطقه کلیدی 160-165 که اکنون به عنوان مقاومت سربار فوری عمل می کند، تثبیت می شود. قیمت در حال حاضر به طور متزلزلی بالاتر از منطقه حمایتی 146 تا 148 معامله می شود. این محدوده دارای برخی جهشها بوده است که نشاندهنده یک کف بالقوه کوتاهمدت است، اما زمینه کلی خط روند نزولی و ناتوانی در بازیابی «منطقه کلیدی» 160-165 نشان میدهد که فشار نزولی همچنان غالب است. سطوح مقاومت کلیدی: خط روند نزولی Red: این خط روند پویا فوری ترین و مهم ترین مانع است. شکست بالاتر از این برای هر تغییر در شتاب بسیار مهم است. منطقه کلیدی 160 تا 165: این ناحیه پس از اینکه قبلاً به عنوان پشتیبان عمل می کرد، ثابت کرده است که یک مقاومت قوی است. بازپس گیری قاطع این منطقه برای گاو نر ضروری است. 175 پشتیبانی قبلی: آنچه زمانی سطح حمایت بود، اکنون به عنوان یک مقاومت قدرتمندتر است که بالاتر از محدوده معاملاتی فعلی قرار دارد و برای غلبه بر آن به قدرت صعودی قابل توجهی نیاز دارد. مقاومت کلیدی 190 تا 195: این منطقه منشأ روند نزولی major فعلی را نشان می دهد و یک مقاومت طولانی مدت بسیار قوی باقی می ماند. سطوح پشتیبانی کلیدی: 146 تا 148: این خاکستری band منطقه پشتیبانی فوری در حال آزمایش است. شکست زیر این سطح ادامه نزولی بیشتر را تایید می کند. 135: در صورت شکست حمایت 146-148، سطح 135 به عنوان هدف نزولی قابل توجه بعدی شناسایی می شود. این یک حمایت روانی و فنی حیاتی است که برای جلوگیری از فروش عمیقتر حیاتی است. سناریوی صعودی: برای اینکه SOLUSD هرگونه معکوس صعودی معنیداری را نشان دهد، ابتدا باید به طور قاطع از خط روند نزولی red بشکند و همزمان با قاطعیت و افزایش حجم، منطقه کلیدی 160 تا 165 را بازیابی کند. تداوم move بالاتر از این ترکیب، راه را برای به چالش کشیدن 175 "حمایت قبلی" (اکنون مقاومت) باز می کند. سناریوی نزولی: ساختار فنی فعلی به شدت از ادامه روند نزولی حمایت می کند. شکست در بازپس گیری "منطقه کلیدی" 160 تا 165 و عدم پذیرش ادامه دار از خط روند نزولی احتمالاً منجر به شکست قاطع زیر ناحیه پشتیبانی 146 به 148 شد. نقض این حمایت فوری فشار فروش را تسریع می کند و سطح 135 را به عنوان هدف بعدی major هدف قرار می دهد. نتیجه گیری: Solana در یک مقطع حساس قرار دارد، در یک روند نزولی آشکار مبارزه می کند و با مقاومت بالای سر قوی مواجه است. نبرد فوری بر روی منطقه کلیدی 160-165 متمرکز است که به عنوان سقف عمل می کند و منطقه 146-148 پشتیبانی موقت را ارائه می دهد. معامله گران باید از نزدیک مراقب این سطوح باشند. شکست قاطع در هر دو جهت احتمالاً مسیر کوتاه مدت سولانا را دیکته کرد. سلب مسئولیت: اطلاعات ارائه شده در این نمودار صرفاً جنبه آموزشی و اطلاع رسانی دارد و نباید به عنوان مشاوره سرمایه گذاری در نظر گرفته شود. تجارت و سرمایه گذاری شامل ریسک قابل توجهی است و برای هر سرمایه گذار مناسب نیست. قبل از هر تصمیمی برای سرمایه گذاری باید وضعیت مالی خود را به دقت بررسی کنید و با یک مشاور مالی مشورت کنید. سازنده این نمودار هیچ نتیجه یا سود خاصی را تضمین نمی کند و مسئولیتی در قبال زیان های وارده در نتیجه استفاده از این اطلاعات ندارد. عملکرد گذشته نشان دهنده نتایج آینده نیست. از این اطلاعات با مسئولیت خود استفاده کنید. این نمودار برای بهبود خود من در تحلیل تجارت و سرمایه گذاری ایجاد شده است. لطفا قبل از هر سرمایه گذاری تحلیل خود را انجام دهید.

ManiMarkets
ایکسآرپی در آستانه انفجار: کلید رسیدن به ۲.۷۰۰ کجاست؟
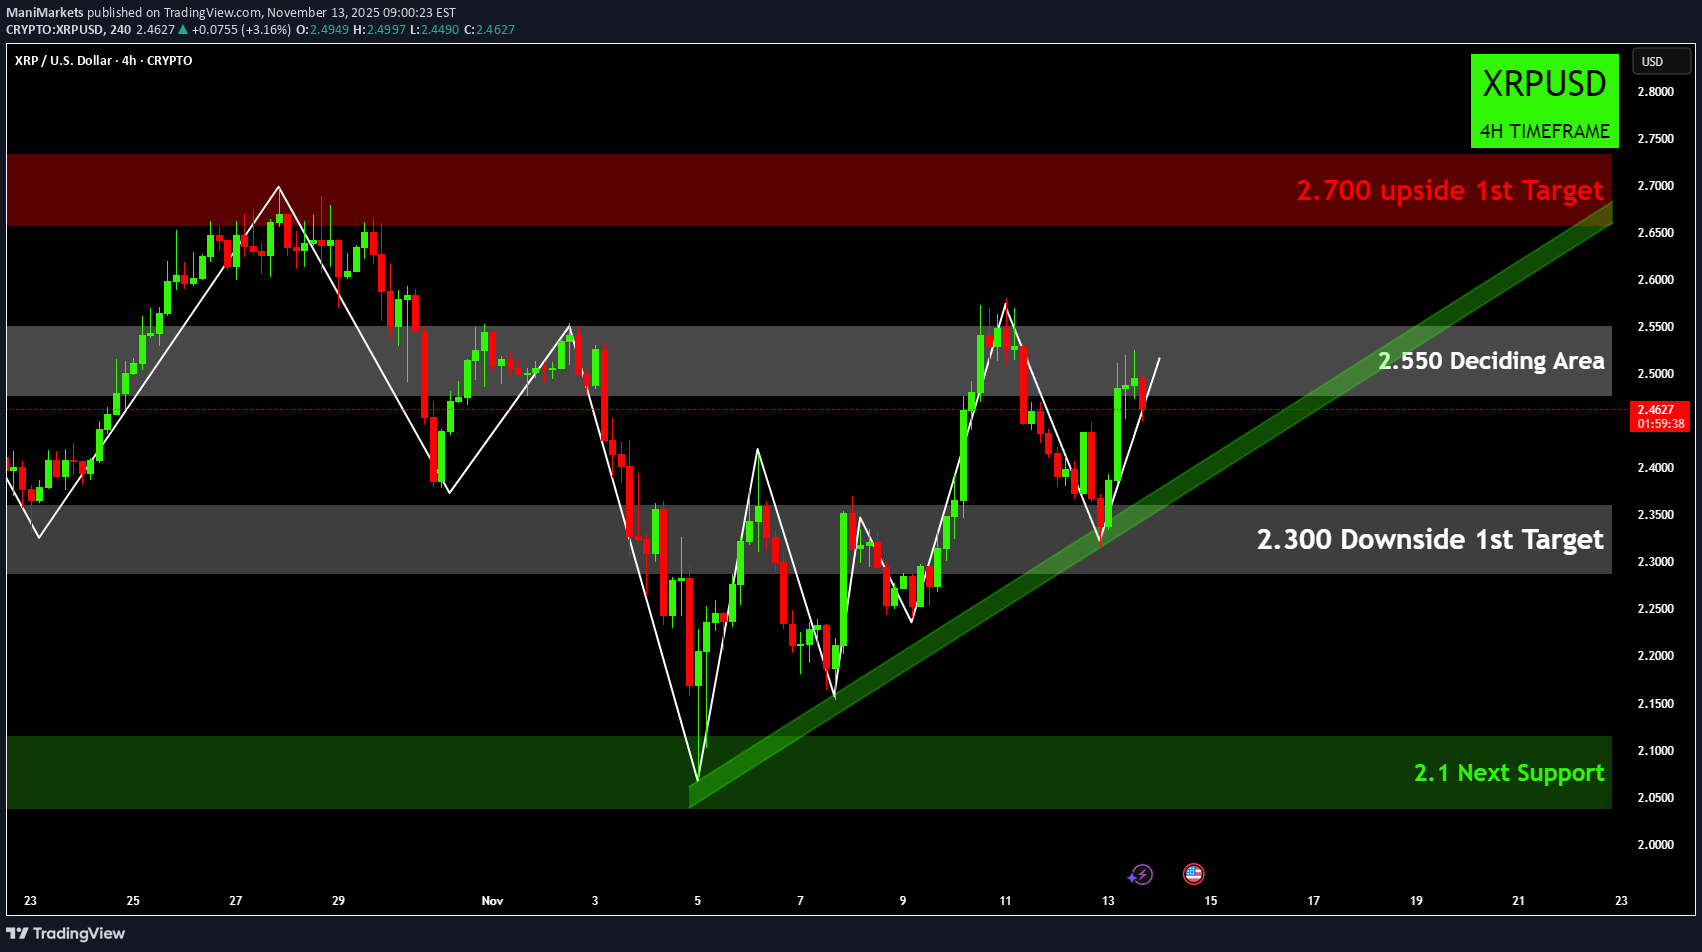
📈 XRPUSD: مثلث صعودی در حال فعالیت – گاوها ۲.۷۰۰ را هدف گرفتهاند، اما ۲.۵۵۰ کلیدی است! تایم فریم: نمودار ۴ ساعته ریپل (XRPUSD) در نمودار ۴ ساعته در حال حاضر حدود ۲.۴۵۸ دلار معامله میشود و الگوی تثبیت جالبی را به نمایش میگذارد. قیمت در حال عبور از یک «منطقه تعیینکننده» حیاتی است، در حالی که توسط یک خط روند صعودی قوی حمایت میشود، که زمینه را برای یک حرکت بالقوه قابل توجه فراهم میکند. تحلیل روند و عملکرد فعلی قیمت: XRPUSD از اوایل ماه نوامبر، پس از پیدا کردن پایهای قوی در حدود سطح ۲.۱، در یک دوره تثبیت رو به بالا قرار داشته است. مشخصه این بازیابی، تشکیل کفهای بالاتر بوده است که به وضوح توسط خط روند صعودی سبز رنگ نشان داده میشود و به عنوان حمایت پویا عمل میکند. اخیراً، قیمت با موفقیت از این خط روند برگشت کرده است، که نشاندهنده انعطافپذیری و ادامه علاقه به خرید در سطوح پایینتر است. با این حال، مقاومت بالاسری در حدود «منطقه تعیینکننده» ۲.۵۵۰ یک چالش مهم بوده است. قیمت از این منطقه چندین بار رد شده است و از یک شکست واضح به سمت اهداف بالاتر جلوگیری کرده است. این تعامل بین حمایت صعودی و مقاومت افقی در حدود ۲.۵۵۰، نشاندهنده تشکیل الگوی مثلث صعودی است که حاکی از انباشت یا آمادهسازی برای یک شکست است. عملکرد فعلی قیمت نشان میدهد که XRPUSD در حال آزمایش مرز پایینی منطقه ۲.۵۵۰ است و تلاش میکند تا برای عبور از آن، شتاب لازم را ایجاد کند. سطوح مقاومت کلیدی: ۲.۵۵۰ منطقه تعیینکننده: این فوریترین و حیاتیترین مقاومت است. یک شکست قاطع و تثبیت ماندگار در بالای این منطقه، ایدهآل با حجم افزایش یافته، یک سیگنال قوی صعودی بود. ۲.۷۰۰ اولین هدف صعودی: در صورتی که قیمت با موفقیت از بالای ۲.۵۵۰ عبور کند، سطح ۲.۷۰۰ به عنوان «اولین هدف صعودی» شناسایی میشود. این سقف نوسانی قبلی، مانع بعدی بود. ۲.۹۰ تا ۲.۹۵ منطقه چرخش: فراتر از ۲.۷۰۰، این منطقه نشاندهنده یک «منطقه چرخش» مهم است که در آن مقاومت قبلی میتواند به حمایت تبدیل شود، یا بالعکس، که نشاندهنده یک فشار صعودی قابل توجه است. سطوح حمایت کلیدی: خط روند صعودی سبز: این خط روند پویا حمایت فوری را فراهم میکند و کفهای بالاتر در تثبیت فعلی را دیکته میکند. شکست به زیر این خط روند، ساختار صعودی کنونی را باطل کرد. ۲.۳۰۰ اولین هدف نزولی: اگر خط روند صعودی شکست بخورد، حمایت مهم بعدی «اولین هدف نزولی» ۲.۳۰۰ است. این سطح میتواند خریداران را جذب کند، اما شکست در اینجا سیگنال افزایش فشار نزولی بود. ۲.۱ حمایت بعدی: این منطقه سبز و قوی نشاندهنده «حمایت بعدی» است، یک منطقه حیاتی که در اوایل نوامبر به خوبی مقاومت کرد. شکست به زیر ۲.۳۰۰ میتواند منجر به آزمایش این سطح فنی و روانی مهم شود. سناریوی صعودی: صعودیترین نتیجه، شامل کسب یک شکست قاطع توسط XRPUSD در بالای «منطقه تعیینکننده» ۲.۵۵۰ است. تثبیت ماندگار در بالای این مقاومت، قدرت الگوی مثلث صعودی را تأیید میکند و به احتمال زیاد راه را برای یک رالی به سمت «اولین هدف صعودی» ۲.۷۰۰ هموار کرد، با پتانسیل صعودی بیشتر به سمت «منطقه چرخش» ۲.۹۰-۲.۹۵. سناریوی نزولی: برعکس، عدم موفقیت در شکست بالای ۲.۵۵۰، همراه با یک شکست قاطع به زیر خط روند صعودی سبز، یک تحول نزولی قابل توجه بود. چنین حرکتی به احتمال زیاد منجر به آزمایش «اولین هدف نزولی» ۲.۳۰۰ شد. اگر این حمایت نیز شکسته شود، XRPUSD میتواند شاهد کاهش بیشتر به سمت «حمایت بعدی» قوی ۲.۱ باشد. نتیجهگیری: XRPUSD در حال حاضر در یک تثبیت با ریسک بالا قرار دارد، که «منطقه تعیینکننده» ۲.۵۵۰ به عنوان یک میدان نبرد حیاتی عمل میکند. خط روند صعودی سبز حمایت حیاتی را فراهم میکند، اما رد شدنهای مکرر از مقاومت بالاسری، نیاز به یک شکست قطعی را برجسته میسازد. معاملهگران باید با دقت مراقب شکست واضح در هر دو جهت از این الگو باشند تا حرکت بعدی XRP را پیشبینی کنند. سلب مسئولیت: اطلاعات ارائه شده در این نمودار فقط برای اهداف آموزشی و اطلاعاتی است و نباید به عنوان توصیه سرمایهگذاری در نظر گرفته شود. معامله و سرمایهگذاری شامل ریسک قابل توجهی است و برای هر سرمایهگذاری مناسب نیست. شما باید قبل از اتخاذ هرگونه تصمیم سرمایهگذاری، وضعیت مالی خود را با دقت در نظر بگیرید و با یک مشاور مالی مشورت کنید. سازنده این نمودار هیچ نتیجه یا سود خاصی را تضمین نمیکند و مسئول هیچگونه ضرری که در نتیجه استفاده از این اطلاعات متحمل شدهاید، نیست. عملکرد گذشته نشاندهنده نتایج آتی نیست. از این اطلاعات با مسئولیت خود استفاده کنید. این نمودار برای پیشرفت خودم در تحلیل سرمایهگذاری و معامله ایجاد شده است. لطفاً قبل از هرگونه سرمایهگذاری، تحلیل شخصی خود را انجام دهید.

ManiMarkets
اتریوم در دام مثلث نزولی؛ آیا قیمت ETH به زیر 3200 سقوط میکند؟

📉 ETHUSD: گرفتار مثلث روند نزولی زیر اهداف کلیدی – بعدی برای Ethereum چیست؟ بازه زمانی: نمودار 4 ساعته Ethereum (ETHUSD) در حال حاضر حدود 3,440 دلار معامله می شود. قیمت نشانههای واضحی از فشار نزولی را نشان میدهد که پس از ناکامی در حفظ سطوح بالاتر در یک الگوی در حال توسعه به دام افتاده است. تحلیل روند و اقدام قیمت فعلی: Ethereum از زمان رسیدن به اوج در اواخر اکتبر که با مجموعه ای از اوج های پایین تر مشخص شد، در یک روند نزولی پایدار بوده است. آخرین تلاش برای بازیابی در منطقه 3700 'Upside 1st Target' در حدود 10 تا 11 نوامبر رد شد. از زمان این رد، ETHUSD در حال تثبیت بوده و عمدتاً در زیر خط روند نزولی برجسته red عمل می کند که به عنوان مقاومت پویا عمل می کند. قیمت در حال حاضر در اطراف 3350 'منطقه تصمیم گیری' است که به نظر می رسد به عنوان پشتیبانی فوری عمل می کند. با این حال، ردهای مکرر از خط روند نزولی (تشکیل یک مثلث نزولی بالقوه یا الگوی گوه) فشار فروش مداوم را برجسته می کند. در حالی که قیمت از این "منطقه تصمیم گیری" جهش های موقتی پیدا کرده است، ناتوانی در شکستن خط روند سربار نشان دهنده ضعف مداوم است. سطوح مقاومت کلیدی: خط روند نزولی Red: این خط روند پویا، که در حال حاضر درست بالاتر از علامت 3500 است، فوری ترین مانع برای هر بازیابی صعودی است. شکست بالاتر از این اولین اشاره به تغییر شتاب بود. هدف اول صعودی 3700: این نقطه اوج اخیر قبل از سقوط فعلی بود و نشان دهنده سطح مقاومت قابل توجهی است که گاوها باید برای به دست آوردن مجدد اعتقاد خود بر آن غلبه کنند. 3850 تا 3950 1st Key Resistance & 4085: این مناطق مقاومت بالاتر در حال حاضر خارج از دسترس هستند اما موانع مهمی برای تغییر روند گسترده تر باقی می مانند. مقاومت قوی 4200 تا 4300: این مقاومت سربار major مساحت قله قبلی را مشخص می کند و برای به چالش کشیدن نیاز به یک انگیزه صعودی قابل توجهی دارد. سطوح پشتیبانی کلیدی: 3350 Deciding Area: این منطقه خاکستری به عنوان پشتیبانی فوری عمل می کند. معاملات پایدار در زیر این منطقه یک سیگنال نزولی واضح بود. 3200 Downside 1st Target: در صورتی که 'Deciding Area' باقی بماند، نمودار 3200 را به عنوان 'Downside 1st Target' شناسایی می کند. این سطح می تواند خریداران را جذب کند اما همچنین نشان دهنده یک نقطه شکست بحرانی است. سطح پشتیبانی کلیدی 3000: اگر 3200 نقض شود، این سطح پشتیبانی فنی و روانی قوی وارد عمل می شود. این نشان دهنده آخرین خط دفاعی برای ساختار صعودی میان مدت گسترده تر است. سناریوی صعودی: برای اینکه Ethereum در کوتاه مدت صعودی شود، باید قاطعانه از خط روند نزولی red بشکند و سپس به طور محکم "هدف اول صعودی" 3700 را با حجم قوی بازپس گیرد. این الگوی نزولی فعلی را باطل می کند و پتانسیل move را به سمت سطوح مقاومت بالاتر نشان می دهد. سناریوی نزولی: احساسات نزولی غالب حاکی از احتمال بیشتر ادامه روند نزولی movement است. شکست در شکستن خط روند نزولی و شکست قاطع به زیر "منطقه تصمیم گیری" 3350 احتمالاً راه را برای آزمایش "هدف اول نزولی" 3200 باز می کند. نقض 3200 می تواند منجر به نزول سریع به سمت "سطح پشتیبانی کلیدی" 3000 شود. نتیجه گیری: Ethereum در حال حاضر در مقطع حساسی قرار دارد، تحت یک خط روند نزولی مبارزه می کند و به حمایت 3350 'منطقه تصمیم گیری' چسبیده است. آینده نزدیک برای ETHUSD به این بستگی دارد که آیا می تواند از این شکل گیری نزولی به سمت صعود خارج شود یا اگر ادامه فشار فروش آن را به سمت سطوح حمایتی 3200 و 3000 سوق دهد. معامله گران باید مراقب یک فاصله واضح از الگوی ادغام فعلی باشند تا جهت بعدی move را تأیید کنند. سلب مسئولیت: اطلاعات ارائه شده در این نمودار صرفاً جنبه آموزشی و اطلاع رسانی دارد و نباید به عنوان مشاوره سرمایه گذاری در نظر گرفته شود. تجارت و سرمایه گذاری شامل ریسک قابل توجهی است و برای هر سرمایه گذار مناسب نیست. قبل از هر تصمیمی برای سرمایه گذاری باید وضعیت مالی خود را به دقت بررسی کنید و با یک مشاور مالی مشورت کنید. سازنده این نمودار هیچ نتیجه یا سود خاصی را تضمین نمی کند و مسئولیتی در قبال زیان های وارده در نتیجه استفاده از این اطلاعات ندارد. عملکرد گذشته نشان دهنده نتایج آینده نیست. از این اطلاعات با مسئولیت خود استفاده کنید. این نمودار برای بهبود خود من در تحلیل تجارت و سرمایه گذاری ایجاد شده است. لطفا قبل از هر سرمایه گذاری تحلیل خود را انجام دهید.

ManiMarkets
سقوط بزرگ سولانا تایید شد: آیا حمایت ۱۷۵ دلار از دست میرود؟
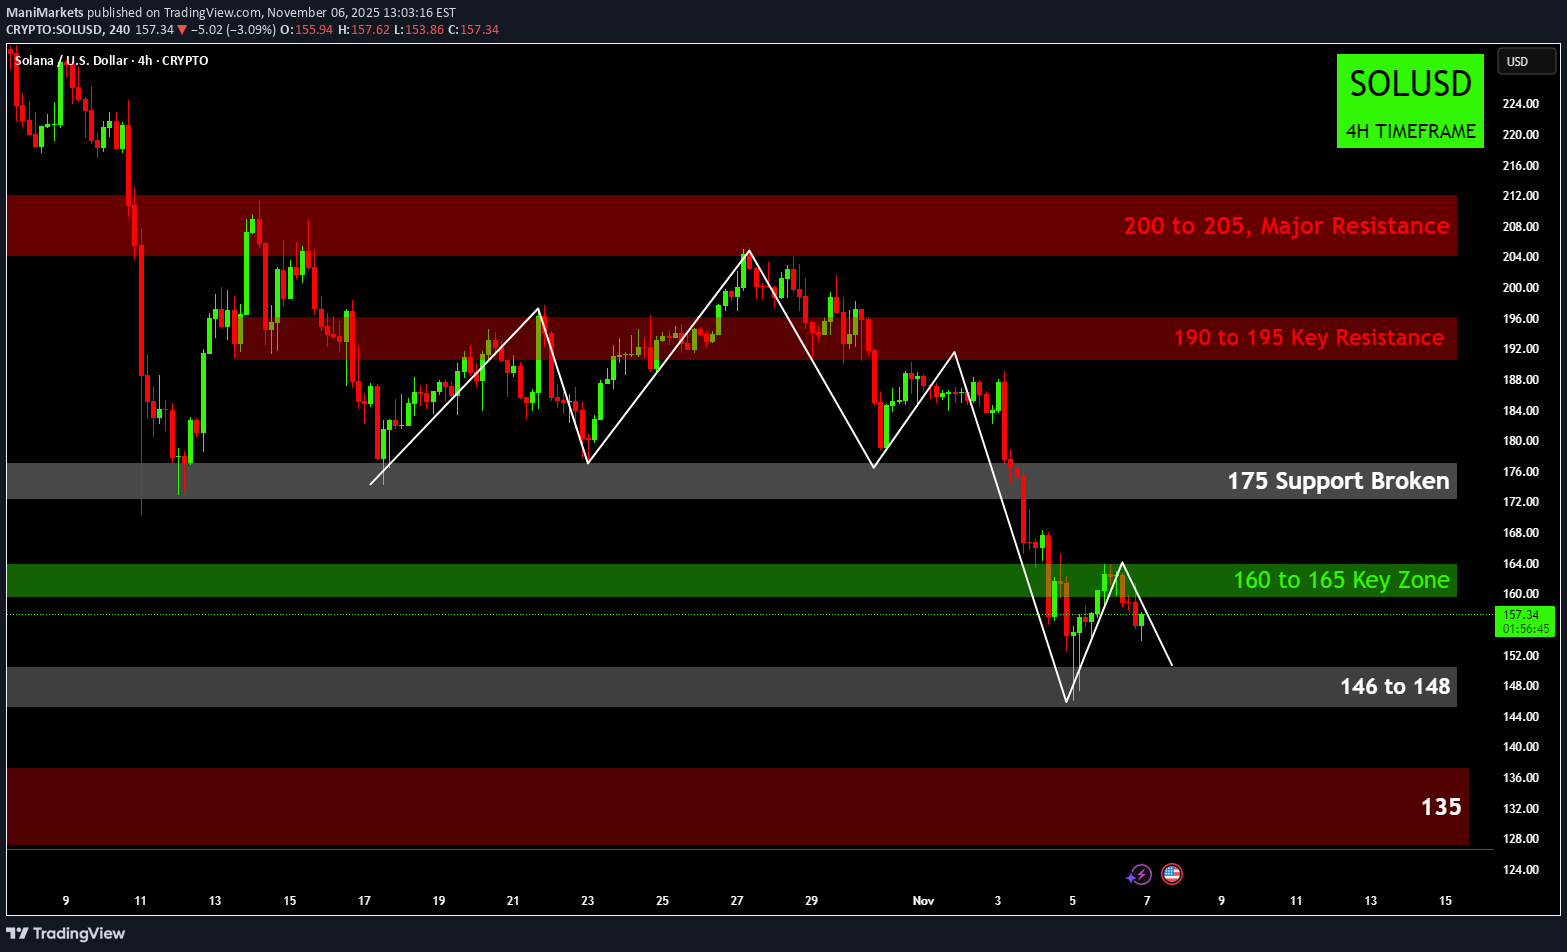
🔥 SOLANA (SOL/USD) 4H: خرابی عظیم دو بالا تایید شد! 🔥 شکار پشتیبانی زیر 175 دلار فعال است نمودار 4 ساعته SOL/USD یک تغییر نزولی major را تأیید کرده است، که ناشی از شکست الگوی بزرگ Double Top (یا ساختار پیچیده M-top) است که بین 175 تا 205 دلار تشکیل شده است. این معکوس کردن الگو، که اغلب یک سیگنال قدرتمند است، یک اصلاح شدید را آغاز کرده و دستاوردهای قابل توجهی را پاک کرده است. حمایت بحرانی 175 دلاری (خط گردن دو رویه) به طور قطع شکسته شده است، که روند نزولی را تایید می کند و راه را برای حرکت های نزولی بیشتر هموار می کند. سطوح کلیدی که محدوده فعلی را تعریف می کنند قیمت در حال حاضر در فاز بسیار نوسانی است و سطوح مقاومت را در تلاش برای یافتن یک پایه پایدار آزمایش می کند. 🛡️ مقاومت فوری (منطقه کلیدی): 160 تا 165 دلار (منطقه سبز) این منطقه ای است که قیمت در حال حاضر با مشکل مواجه است. برای مدت کوتاهی باز پس گرفته شد، اما نتوانست حفظ شود و آن را به فوری ترین و حیاتی ترین مقاومت تبدیل کرد. خرس ها به شدت از این منطقه دفاع می کنند. 📉 پشتیبانی فوری (The Floor): 146 تا 148 دلار این نوسان پایین اخیر و اولین سطح حمایت حیاتی است. قیمت به شدت از این منطقه برگشت، که نشان میدهد علاقه خرید وجود دارد، اما باید در آزمایشهای مجدد بعدی ادامه یابد. 🛑 Major مقاومت فراگیر: 190 تا 195 دلار بازپس گیری این منطقه برای پایان دادن به چشم انداز نزولی میان مدت ضروری است. تا آن زمان، هر movement زیر آن اصلاحی در نظر گرفته می شود. 🚨 هدف نهایی خرس: 135 دلار (Major منطقه تقاضا) اگر حمایت فوری 146 تا 148 دلار شکسته شود، هدف major بعدی که از تجزیه الگو به دست می آید، منطقه تقاضای deep در حدود 135 دلار است. بعدی برای Solana چیست؟ دو سناریو بحرانی ادامه نزولی (روند غالب): قیمت در منطقه مقاومت 160 تا 165 دلار رد شده است. خرسها قیمت را پایین میآورند تا پایینترین حد 146 تا 148 دلار را آزمایش کنند. شکست قاطع و بسته شدن به زیر 146 دلار، ادامه شکست الگو را تأیید میکند و 135 دلار به هدف اصلی تبدیل میشود. تسکین صعودی (تلاش معکوس): گاوها موفق شدند قیمت را به بالای 165 دلار برسانند و آن را حفظ کنند. این نشان میدهد که اصلاحات محلی به پایان رسیده است و میتواند منجر به افزایش کمکی برای آزمایش منطقه شکست اولیه در 175 دلار شود (اکنون به عنوان یک مقاومت بزرگ عمل میکند). قیمت move به 175 دلار نشانه خوبی بود، اما روند اولیه تا زمانی که 195 دلار بازپس گرفته نشود کاهش می یابد. نتیجه گیری: مسیر کمترین مقاومت به دنبال شکست از خط گردن 175 دلار نزولی باقی می ماند. معامله گران باید منطقه 160 تا 165 دلار را برای ورودی های کوتاه بالقوه و 146 تا 148 دلار را به عنوان خط حمایت حیاتی تماشا کنند. سلب مسئولیت: اطلاعات ارائه شده در این نمودار صرفاً جنبه آموزشی و اطلاع رسانی دارد و نباید به عنوان مشاوره سرمایه گذاری در نظر گرفته شود. تجارت و سرمایه گذاری شامل ریسک قابل توجهی است و برای هر سرمایه گذار مناسب نیست. قبل از هر تصمیمی برای سرمایه گذاری باید وضعیت مالی خود را به دقت بررسی کنید و با یک مشاور مالی مشورت کنید. سازنده این نمودار هیچ نتیجه یا سود خاصی را تضمین نمی کند و مسئولیتی در قبال زیان های وارده در نتیجه استفاده از این اطلاعات ندارد. عملکرد گذشته نشان دهنده نتایج آینده نیست. از این اطلاعات با مسئولیت خود استفاده کنید. این نمودار برای بهبود خود من در تحلیل تجارت و سرمایه گذاری ایجاد شده است. لطفا قبل از هر سرمایه گذاری تحلیل خود را انجام دهید.

ManiMarkets
تحلیل تکنیکال XRP/USD: آیا 2.10 دلار سکوی پرتاب بعدی برای صعود است؟
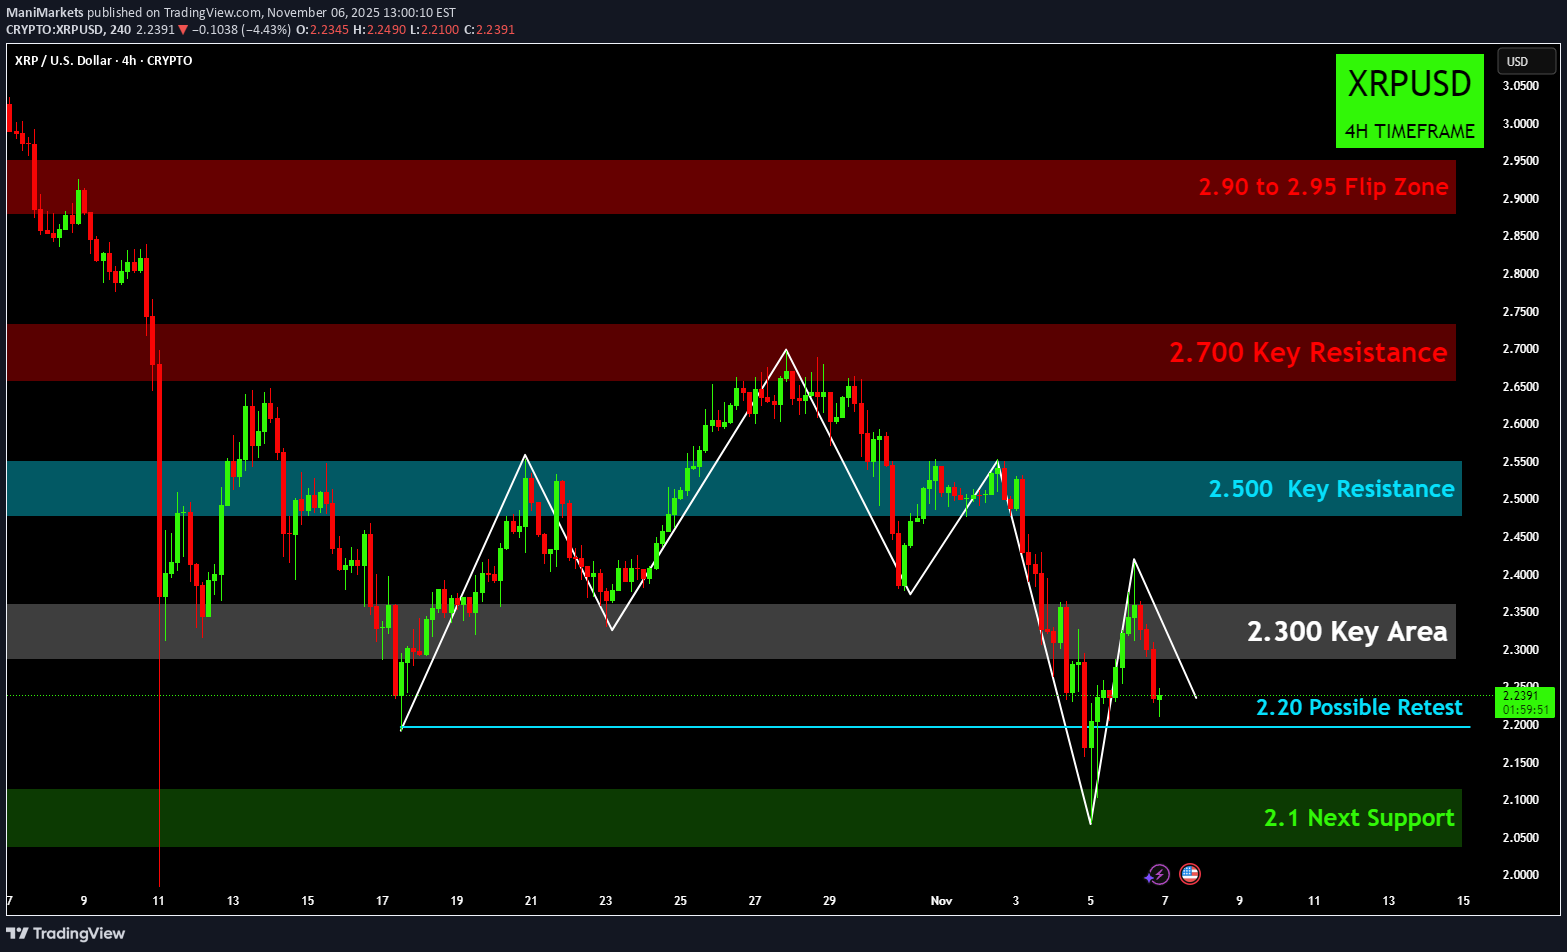
🚀 تحلیل XRP/USD (چهار ساعته): سکوی پرتاب ۲.۱۰ دلاری 🌊 زمینه فعلی بازار نمودار چهار ساعته XRP/USD تصویر واضحی از یک برگشت نزولی از سقفهای اخیر خود ارائه میدهد. حرکت قیمت نشان میدهد که الگوی کلاسیک سر و شانهها (H&S) احتمالاً تکمیل شده است، که با شکستی قاطع در زیر خط گردن آن (کمترین قیمتهای بین قلهها) مشخص شده و منجر به سقوط شدیدی شده است. تحول حیاتی، برگشت اخیر قیمت از منطقه حمایتی ۲.۱۰ دلار (منطقه سبز) است. این ناحیه به عنوان یک منطقه تقاضای قوی عمل کرده و نشان میدهد که فاز اصلاحی تهاجمی اولیه که توسط الگوی H&S راهاندازی شده بود، ممکن است در حال پایان باشد. اکنون گاوها (خریداران) در تلاشند تا یک پایه/کف محلی بسازند. سطوح کلیدی برای رصد ⚡️ مقاومت فوری (اولین مانع): ۲.۲۰ دلار این اولین مانع فوری است. شکست تمیز و تثبیت بالای ۲.۲۰ دلار برای تأیید شتاب صعودی کوتاهمدت و آمادهسازی برای فشار به سمت مقاومت بعدی ضروری است. 🎯 منطقه مقاومت کلیدی (منطقه تغییر نقش): ۲.۳۰ دلار (منطقه خاکستری) این حیاتیترین مقاومت در کوتاهمدت است. ناحیه ۲.۳۰ دلار قبلاً یک حمایت قوی بوده و اکنون به عنوان یک مقاومت روانی و تکنیکال آزمایش شد. شکستن و تبدیل این منطقه به حمایت، ساختار کوتاهمدت بازار را به طور قابل توجهی از نزولی به خنثی/صعودی تغییر داد. 🛡️ حمایت (ضروری برای حفظ شدن): ۲.۱۰ دلار (منطقه سبز) این خط قرمز برای خریداران است. شکست پایدار و بسته شدن کندل زیر ۲.۱۰ دلار در نمودار ۴ ساعته، تداوم کاهش قیمت را تأیید میکند، و هدف الگوی H&S نقطه مورد علاقه بعدی بود که منجر به اصلاح عمیقتری میشود. سناریوهای احتمالی سناریوی صعودی (برگشت و شکست): قیمت با موفقیت حمایت ۲.۱۰ دلاری را حفظ میکند. قیمت از ۲.۲۰ دلار عبور کرده و سپس منطقه ۲.۳۰ دلار (منطقه خاکستری) را پس میگیرد. تغییر نقش تأیید شده ۲.۳۰ دلاری، راه را برای رالی به سمت مناطق مقاومت بالاتر در ۲.۵۰ دلار (منطقه آبی) و در نهایت ۲.۷۰ دلار باز میکند. سناریوی نزولی (رد شدن و آزمایش مجدد): قیمت قادر به حفظ برگشت اخیر نیست و در ۲.۲۰ دلار یا ۲.۳۰ دلار رد میشود. قیمت برای آزمایش مجدد حمایت ۲.۱۰ دلار (منطقه سبز) کاهش مییابد. شکست پایدار زیر ۲.۱۰ دلار، تلاش فعلی برای ساخت پایه را بیاثر میکند و نشان میدهد که هدف نزولی الگوی H&S همچنان فعال است، که منجر به ضررهای قابل توجه بیشتری شد.

ManiMarkets
اتریوم در خطر: نبرد حساس ۳۵۰۰، آیا ۳۰۰۰ در انتظار است؟
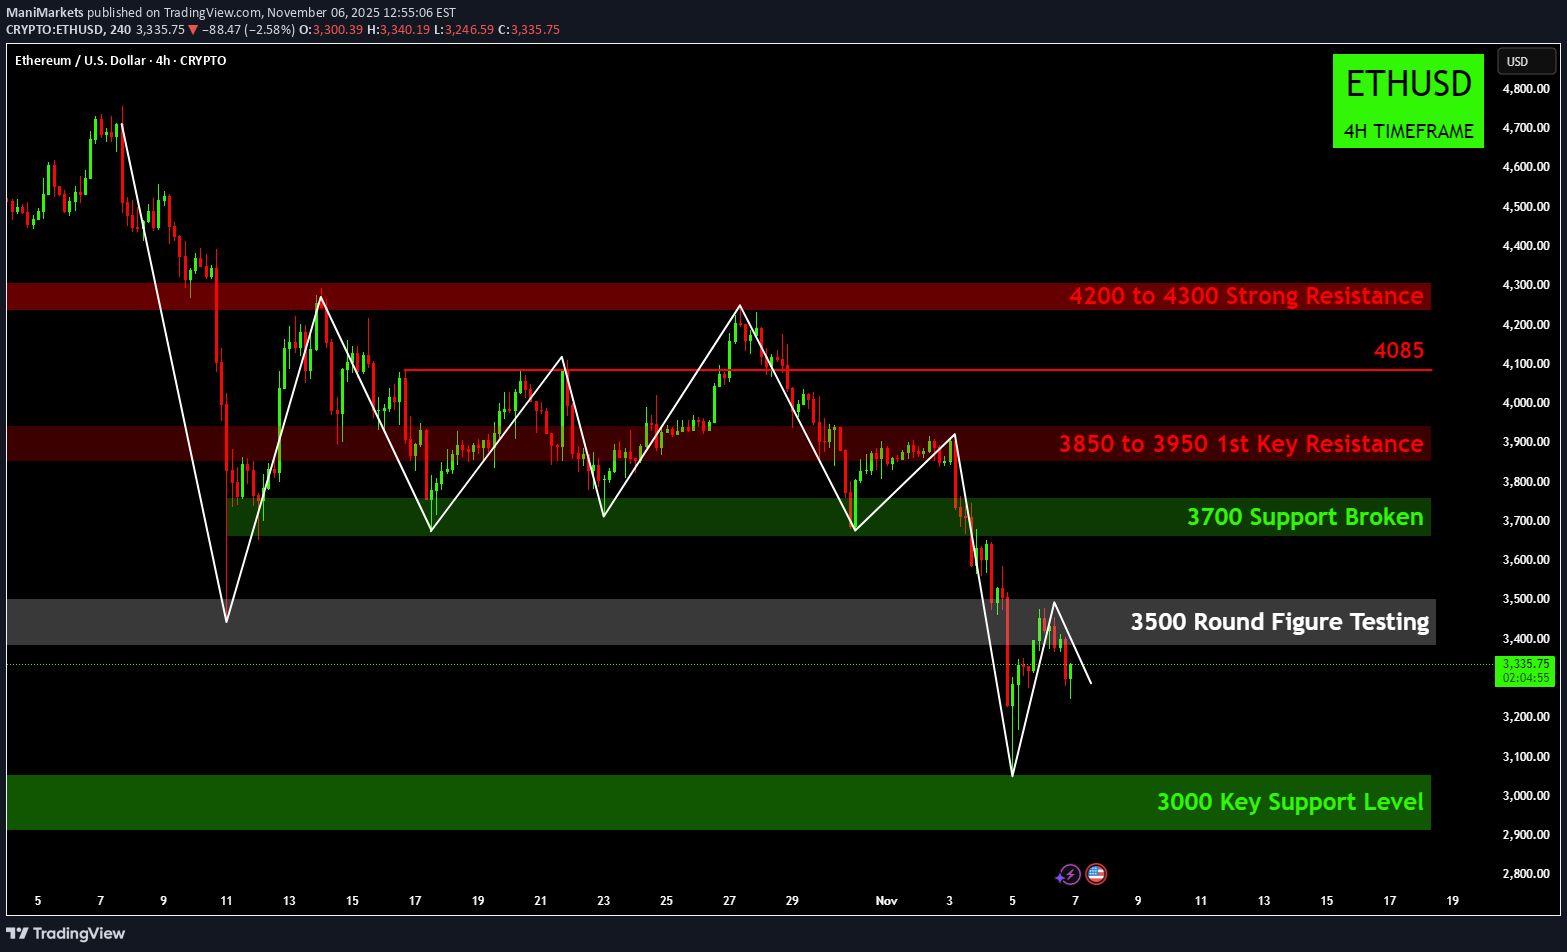
🌊 Ethereum غرق شدن: عدد رُند ۳۵۰۰ در خطر، ۳۰۰۰ در انتظار است؟ 📉 تحلیل جفت ارز اتریوم به دلار (تایم فریم ۴ ساعته) Ethereum با فشار فروش شدیدی مواجه است که منعکسکننده افت گستردهتر بازار رمزارزها است. پس از عدم موفقیت در بازپسگیری سطوح مقاومت حیاتی، ETH از چندین حمایت major عبور کرده و اکنون در حال آزمایش سطح روانی کلیدی ۳۵۰۰ است. ۱. ساختار نزولی و نواحی مقاومت نمودار به وضوح نشاندهنده ناکامی قابل توجه گاوها در حفظ شتاب است که منجر به یک روند نزولی قوی شده است. 🛑 مقاومت قوی ۴۲۰۰ تا ۴۳۰۰: این ناحیه red بالایی، سقف کل دوره نمایش داده شده بود. عدم توانایی مکرر در شکست این ناحیه، عرضه قوی بالا سر را تأیید کرد. 🔴 اولین مقاومت کلیدی ۳۸۵۰ تا ۳۹۵۰: این ناحیه به عنوان نقطه عطف مکرر در طول فاز تثبیت عمل میکرد. از دست رفتن آن، اکنون حیاتیترین و نزدیکترین مقاومت برای ETH محسوب میشود. بازپسگیری این ناحیه برای هر نشانهای از بازگشت صعودی ضروری است. ⚠️ مقاومت میانی ۴۰۸۵: یک سطح فرعی مهم که به ساختار کلی نزولی نیز کمک کرد. ۲. عملکرد فعلی قیمت و سطوح حمایت عملکرد اخیر قیمت با یک ریزش تند و تیز در زیر محدوده تثبیت ایجاد شده، تعریف میشود. 💥 شکست حمایت ۳۷۰۰: جعبه سبز رنگ در ۳۷۰۰، که به عنوان حمایت در طول دوره تثبیت طولانی مدت عمل میکرد، به طور قاطع از دست رفته است. این امر نشاندهنده شکست ساختاری به سمت پایین است. ⚪ آزمایش عدد رُند ۳۵۰۰: قیمت در حال حاضر در حال نبرد حول عدد رُند major ۳۵۰۰ است. جعبه سیاه این آزمایش در حال انجام را برجسته میکند. شکست تأیید شده و تثبیت زیر ۳۵۰۰، مسیر را برای فروش بیشتر هموار میکند. 🛡️ سطح حمایت کلیدی ۳۰۰۰: بازار اکنون به ناحیه تقاضای نهایی در سطح حمایت کلیدی ۳۰۰۰ (جعبه سبز deep) چشم دوخته است. این سطح، حمایت روانی و فنی major بعدی است که در صورت عدم مقاومت ۳۵۰۰، احتمالاً هدف بعدی بود. ۳. سناریوهای برنامه معاملاتی خرسها (معامله فروش): محرک ورود: شکست تأیید شده و بسته شدن کندل زیر ناحیه آزمایش عدد رُند ۳۵۰۰. هدف: ناحیه تقاضای major بعدی در سطح حمایت کلیدی ۳۰۰۰. گاوها (معامله خرید): محرک ورود: دفاع موفق از سطح ۳۵۰۰ و به دنبال آن، بسته شدن قوی و فشار بالاتر از حمایت شکسته شده ۳۷۰۰. هدف: تست مجدد ناحیه مقاومت کلیدی ۳۸۵۰ تا ۳۹۵۰. خلاصه: به طور خلاصه، Ethereum در موقعیت متزلزلی قرار دارد، زیرا ساختار حمایتی کلیدی خود را از دست داده است. نبرد در ۳۵۰۰ حیاتی است؛ اگر شکست بخورد، move به سمت ۳۰۰۰ بسیار محتمل است. سلب مسئولیت: اطلاعات ارائه شده در این نمودار صرفاً برای اهداف آموزشی و اطلاعاتی است و نباید به عنوان توصیه سرمایهگذاری در نظر گرفته شود. معاملهگری و سرمایهگذاری شامل ریسک قابل توجهی است و برای هر سرمایهگذاری مناسب نیست. شما باید وضعیت مالی خود را با دقت بررسی کرده و قبل از اتخاذ هرگونه تصمیم سرمایهگذاری، با یک مشاور مالی مشورت کنید. سازنده این نمودار هیچ نتیجه یا سود خاصی را تضمین نمیکند و مسئول ضررهای وارده در نتیجه استفاده از این اطلاعات نیست. عملکرد گذشته نشاندهنده نتایج آتی نیست. از این اطلاعات با مسئولیت خود استفاده کنید. این نمودار برای بهبود خود من در تحلیلهای معاملهگری و سرمایهگذاری ایجاد شده است. لطفاً قبل از هرگونه سرمایهگذاری، تحلیل شخصی خود را انجام دهید.

ManiMarkets
بیت کوین در سراشیبی تند: شکست حمایتها و هدف ۱۰۰ هزار دلار!
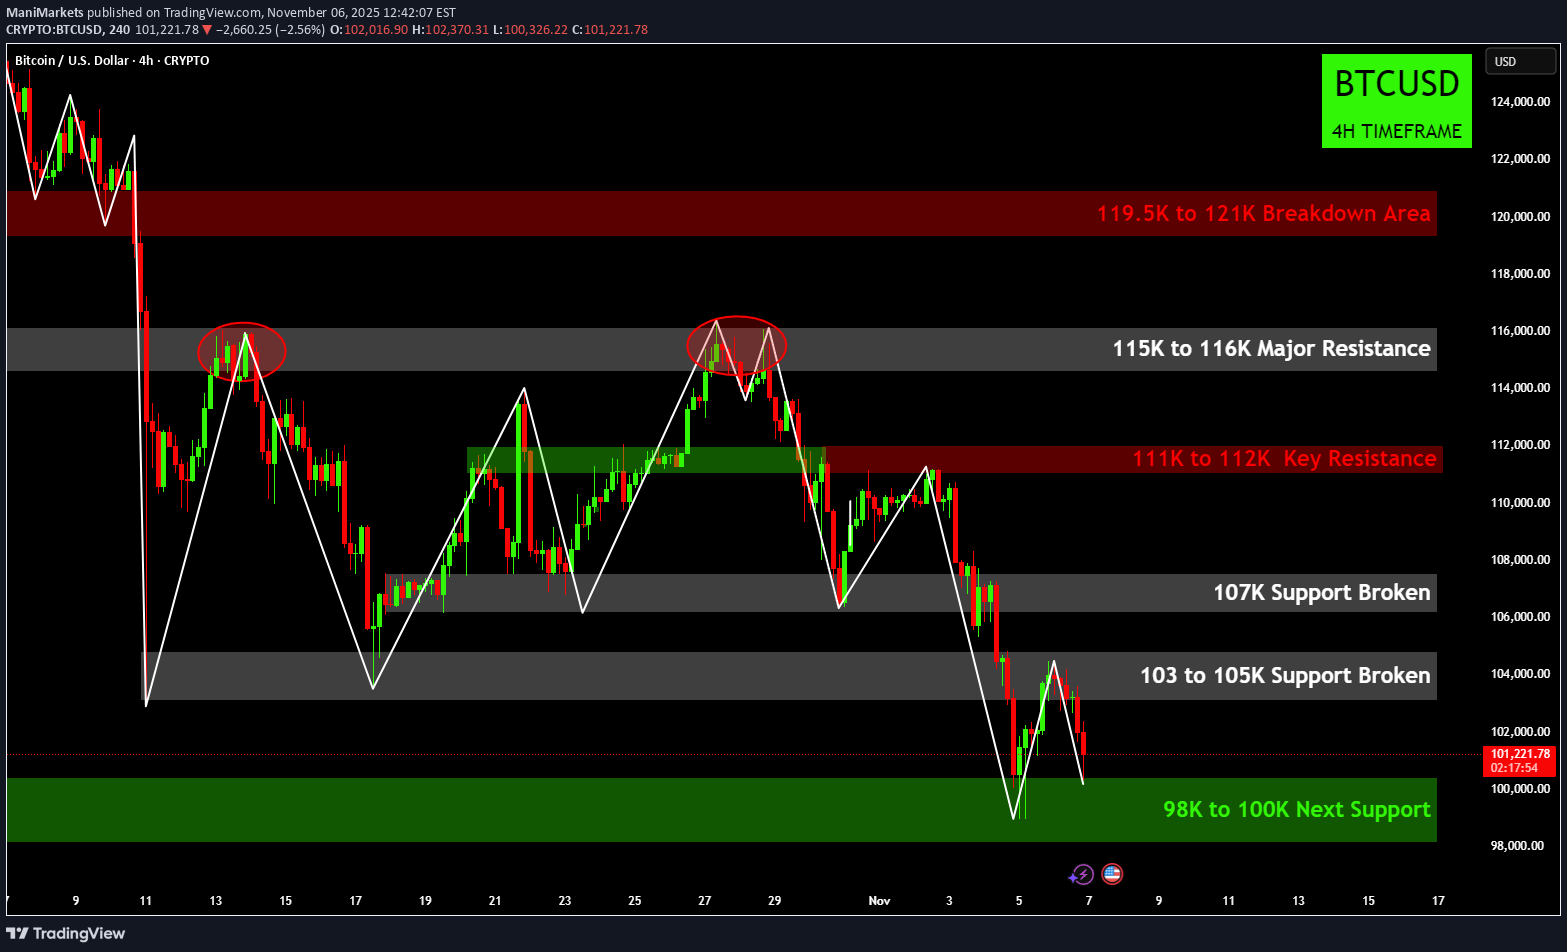
🚨 Bitcoin خونریزی: Major پشتیبانی از Shattered، 100K در دید! 📉 تجزیه و تحلیل BTC/USD (4H Timeframe). Bitcoin در حال حاضر تحت فشار شدید فروش قرار دارد و به دنبال رد قابل توجه مقاومت سربار از چندین سطح حمایت کلیدی عبور کرده است. اقدام قیمت حاکی از ادامه روند نزولی است و گاوها در تلاش برای ایجاد پایگاه هستند. 1. ساختار نزولی و مقاومت های کلیدی نمودار به وضوح نشان می دهد که خرس ها پس از شکست در حفظ یک رالی و الگوی معکوس تایید شده، کنترل را در دست دارند. 🛑 115K تا 116K Major مقاومت: این منطقه نقطه عطف major بود. قیمت یک دابل تاپ کلاسیک (یا تغییری از آن) را در این منطقه (دایره شده) تشکیل داد، که عرضه قوی را تایید کرد و فروش شدید را آغاز کرد. 🔴 مقاومت کلید 111 تا 112 کیلوبایت: این منطقه سبز رنگ قرمز آخرین بالاترین میزان قابل توجهی بود که بازار قبل از شکستن داشت. اکنون نشان دهنده یک مانع حیاتی است. هر جهشی در اینجا احتمالاً با فروش سنگین روبرو شد. ⚠️ 119.5K تا 121K منطقه شکست: این منطقه red بالایی منطقه اولیه را نشان می دهد که افت عظیم از آنجا شروع شده است. رسیدن به این سطح و بازپس گیری آن به یک رالی استثنایی نیاز دارد. 2. شکست فعلی و سطوح پشتیبانی قابل توجه ترین فعالیت اخیر شکست قاطع سطوح تثبیت قبلی است که نشان دهنده حرکت نزولی قوی است. 💥 پشتیبانی 107 هزار شکسته: این یک پشتیبانی متوسط قابل توجهی بود که اکنون از بین رفته است و به لغزش رو به پایین کمک می کند. 💥 پشتیبانی 103 تا 105 هزار شکسته: شکست در حفظ این منطقه حیاتی تقاضا، قدرت روند نزولی فعلی را تایید می کند. این منطقه اکنون احتمالاً act به عنوان مقاومت فوری در هر جهشی بود. 🛡️ 98 هزار تا 100 هزار پشتیبانی بعدی: بازار اکنون به سرعت در حال نزدیک شدن به major روانی و فنی است منطقه 100000 جعبه سبز منطقه تقاضای قابل توجه بعدی را از 98 تا 100 هزار برجسته می کند. 3. سناریوهای طرح تجاری خرس ها (کوتاه): Entry Trigger: رد و تایید مقاومت در منطقه 103K تا 105K اخیرا شکسته شده است. هدف: تست سطح پشتیبانی بعدی 98 تا 100 هزار. گاو نر (طولانی): ماشه ورود: یک الگوی معکوس تایید شده (مانند یک ته دوتایی یا شمع قوی در حال جذب) در منطقه پشتیبانی 98K تا 100K. هدف: آزمایش مجدد پشتیبانی شکسته 103K تا 105K، که اکنون انتظار می رود act به عنوان مقاومت باشد. به طور خلاصه، Bitcoin در یک روند نزولی تعیین کننده است و سطح 100K از نظر روانی مهم را هدف قرار می دهد. خرسها به وضوح کنترل را در دست دارند تا زمانی که سطح حمایت major یک جهش قوی و متقاعد کننده ایجاد کند. سلب مسئولیت: اطلاعات ارائه شده در این نمودار صرفاً جنبه آموزشی و اطلاع رسانی دارد و نباید به عنوان مشاوره سرمایه گذاری در نظر گرفته شود. تجارت و سرمایه گذاری شامل ریسک قابل توجهی است و برای هر سرمایه گذار مناسب نیست. قبل از هر تصمیمی برای سرمایه گذاری باید وضعیت مالی خود را به دقت بررسی کنید و با یک مشاور مالی مشورت کنید. سازنده این نمودار هیچ نتیجه یا سود خاصی را تضمین نمی کند و مسئولیتی در قبال زیان های وارده در نتیجه استفاده از این اطلاعات ندارد. عملکرد گذشته نشان دهنده نتایج آینده نیست. از این اطلاعات با مسئولیت خود استفاده کنید. این نمودار برای بهبود خود من در تحلیل تجارت و سرمایه گذاری ایجاد شده است. لطفا قبل از هر سرمایه گذاری تحلیل خود را انجام دهید.

ManiMarkets
طلا در نقطه حساس: آیا الگوی سقف دوقلو قیمت را سقوط میدهد؟
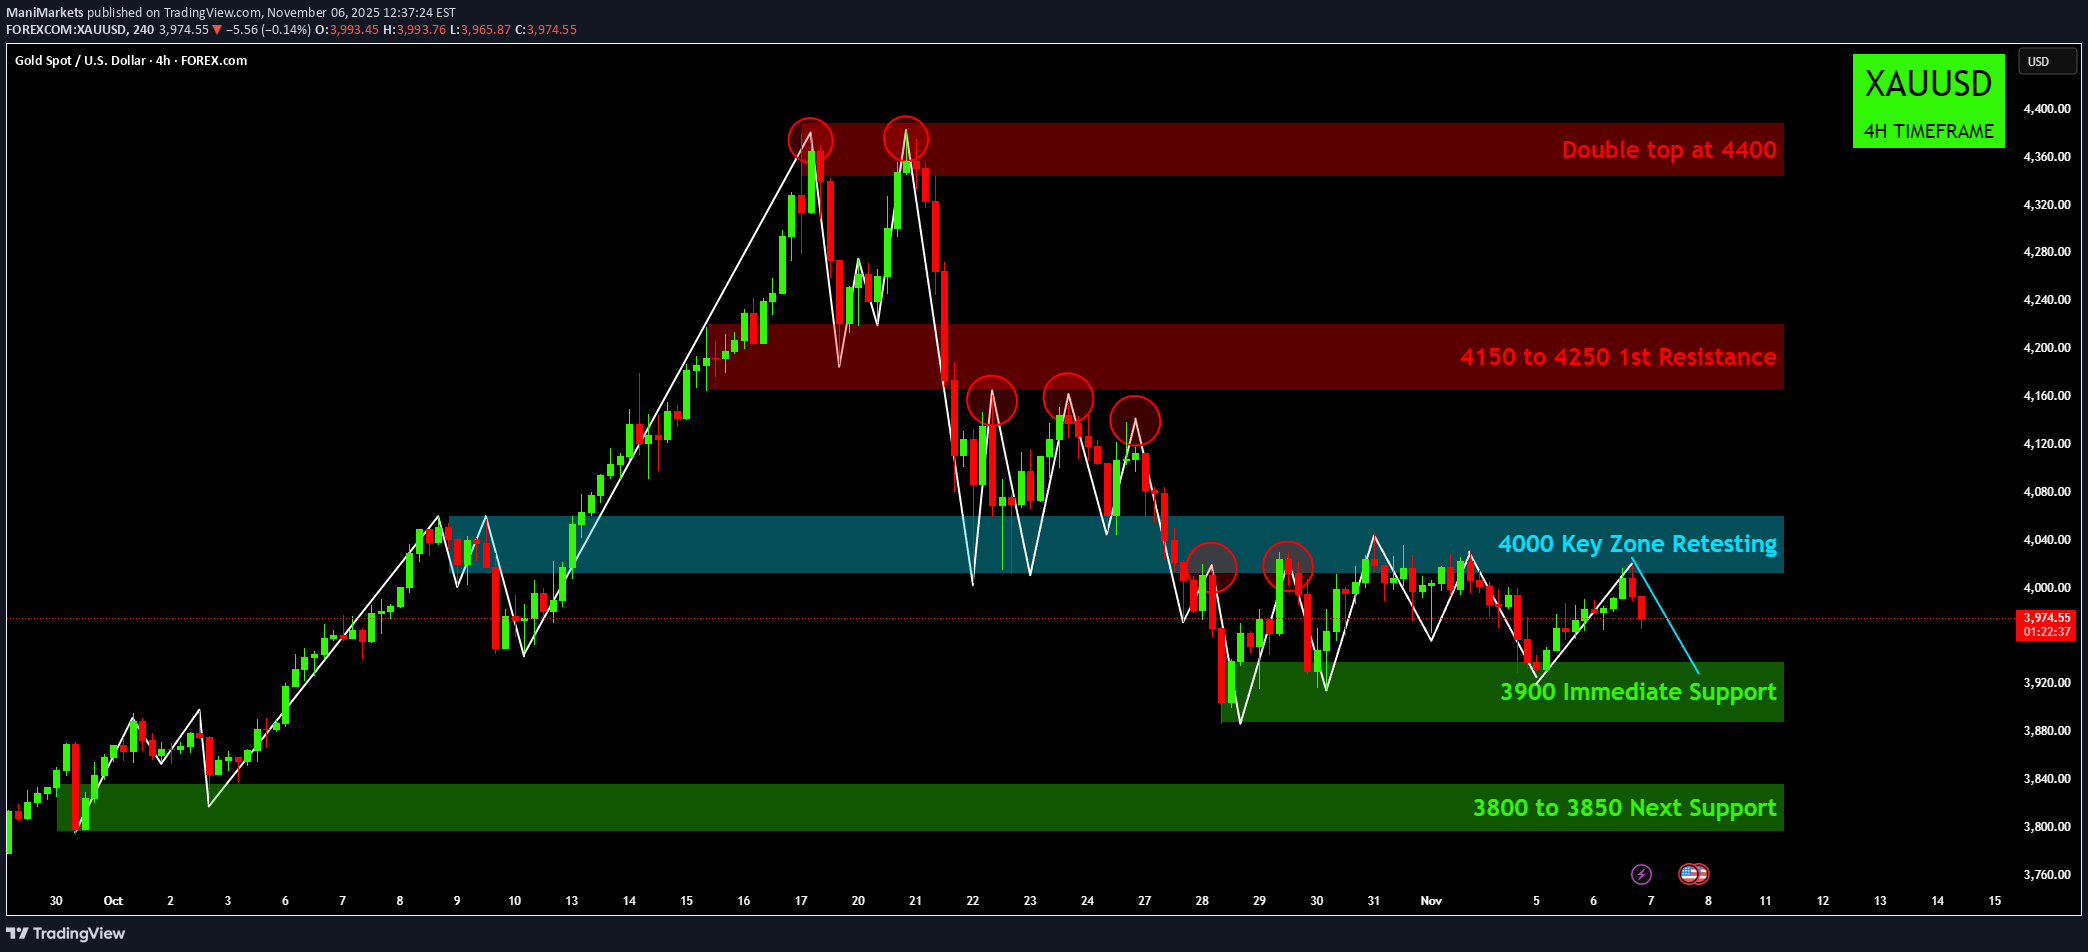
👑 تقاطع بحرانی طلا: دو تاپ تهدید معکوس! 📉 تجزیه و تحلیل XAU/USD (4H) طلا روند صعودی قابل توجهی را تجربه کرده است که به دنبال آن یک الگوی معکوس شدید، معامله گران را مجبور به عبور از یک دوره مهم تثبیت و آزمایش مجدد کرده است. نمودار مناطق کلیدی عرضه و تقاضا را نشان می دهد که major move بعدی فلز را دیکته می کند. 1. تنظیم نزولی: از دست دادن دو بالا و کلید منطقه نمودار به وضوح نشان می دهد که حرکت صعودی پس از رسیدن به اوج در حدود 4400 متوقف شده است. ⚠️ The Double Top در 4400: این الگوی معکوس نزولی major شکل گرفت که نشان دهنده فشار فروش قوی در بالا است. قیمت نتوانست شکست را حفظ کند و منجر به کاهش سریع شد. 📉 شکست 4000 Key Zone: پس از دو بالای صفحه، طلا منطقه حیاتی 4000 Key را از دست داد، که قبلا به عنوان پشتیبانی قوی (جعبه سبز) عمل می کرد. اکنون قیمت این منطقه را از پایین آزمایش می کند و انتقال آن به ناحیه مقاومت را تأیید می کند. 🛑 4150 تا 4250 (مقاومت اول): این منطقه red بزرگ نشان دهنده اولین منطقه تامین سربار major است. برای اینکه گاوها اعتماد به نفس خود را به دست آورند، باید این منطقه را فتح کنند، اما در حال حاضر به شدت از آن دفاع شده است. 2. اقدام قیمت فعلی و سطوح پشتیبانی قیمت در حال حاضر در زیر مقاومت 4000 تثبیت می شود و یک "مثلث نزولی" یا الگوی تثبیت کلاسیک را تشکیل می دهد. 🛡️ پشتیبانی فوری 3900: قیمت توسط سطح پشتیبانی فوری 3900 (جعبه سبز) بالا نگه داشته شده است. نگه داشتن این سطح برای جلوگیری از لغزش بیشتر ضروری است. شکست به زیر 3900 احتمالاً نشانه نزولی بیشتر بود. 🎯 3800 تا 3850 پشتیبانی بعدی: این منطقه سبز عمیق تر آخرین خط دفاعی برای ساختار فعلی است. این منطقه با پایه رالی major قبلی هماهنگ است و آن را به یک منطقه تقاضای بحرانی تبدیل می کند. 3. سناریوهای طرح تجاری گاو نر (طولانی): ماشه ورود: یک شکست مداوم و بسته شدن شمع بالای منطقه کلیدی 4000. هدف: آزمایش مجدد ناحیه مقاومت 4150 تا 4250. خرس ها (کوتاه): Entry Trigger: خرابی تایید شده و کندل در زیر پشتیبانی فوری 3900 بسته می شود. هدف: منطقه تقاضای major بعدی در 3800 تا 3850. به طور خلاصه، طلا در یک نقطه محوری قرار دارد. معامله گران باید نبرد را در پشتیبانی 3900 و مقاومت 4000 برای نشانه جهت بعدی زیر نظر داشته باشند! فکر می کنید بعداً چه اتفاقی می افتد: آیا طلا 3900 را نگه می دارد یا در نهایت به بالای 4000 می رسد؟ سلب مسئولیت: اطلاعات ارائه شده در این نمودار صرفاً جنبه آموزشی و اطلاع رسانی دارد و نباید به عنوان مشاوره سرمایه گذاری در نظر گرفته شود. تجارت و سرمایه گذاری شامل ریسک قابل توجهی است و برای هر سرمایه گذار مناسب نیست. قبل از هر تصمیمی برای سرمایه گذاری باید وضعیت مالی خود را به دقت بررسی کنید و با یک مشاور مالی مشورت کنید. سازنده این نمودار هیچ نتیجه یا سود خاصی را تضمین نمی کند و مسئولیتی در قبال زیان های وارده در نتیجه استفاده از این اطلاعات ندارد. عملکرد گذشته نشان دهنده نتایج آینده نیست. از این اطلاعات با مسئولیت خود استفاده کنید. این نمودار برای بهبود خود من در تحلیل تجارت و سرمایه گذاری ایجاد شده است. لطفا قبل از هر سرمایه گذاری تحلیل خود را انجام دهید.

ManiMarkets
بیت کوین در منطقه طلایی: منتظر تایید صعودی بزرگ در نمودار ماهانه!
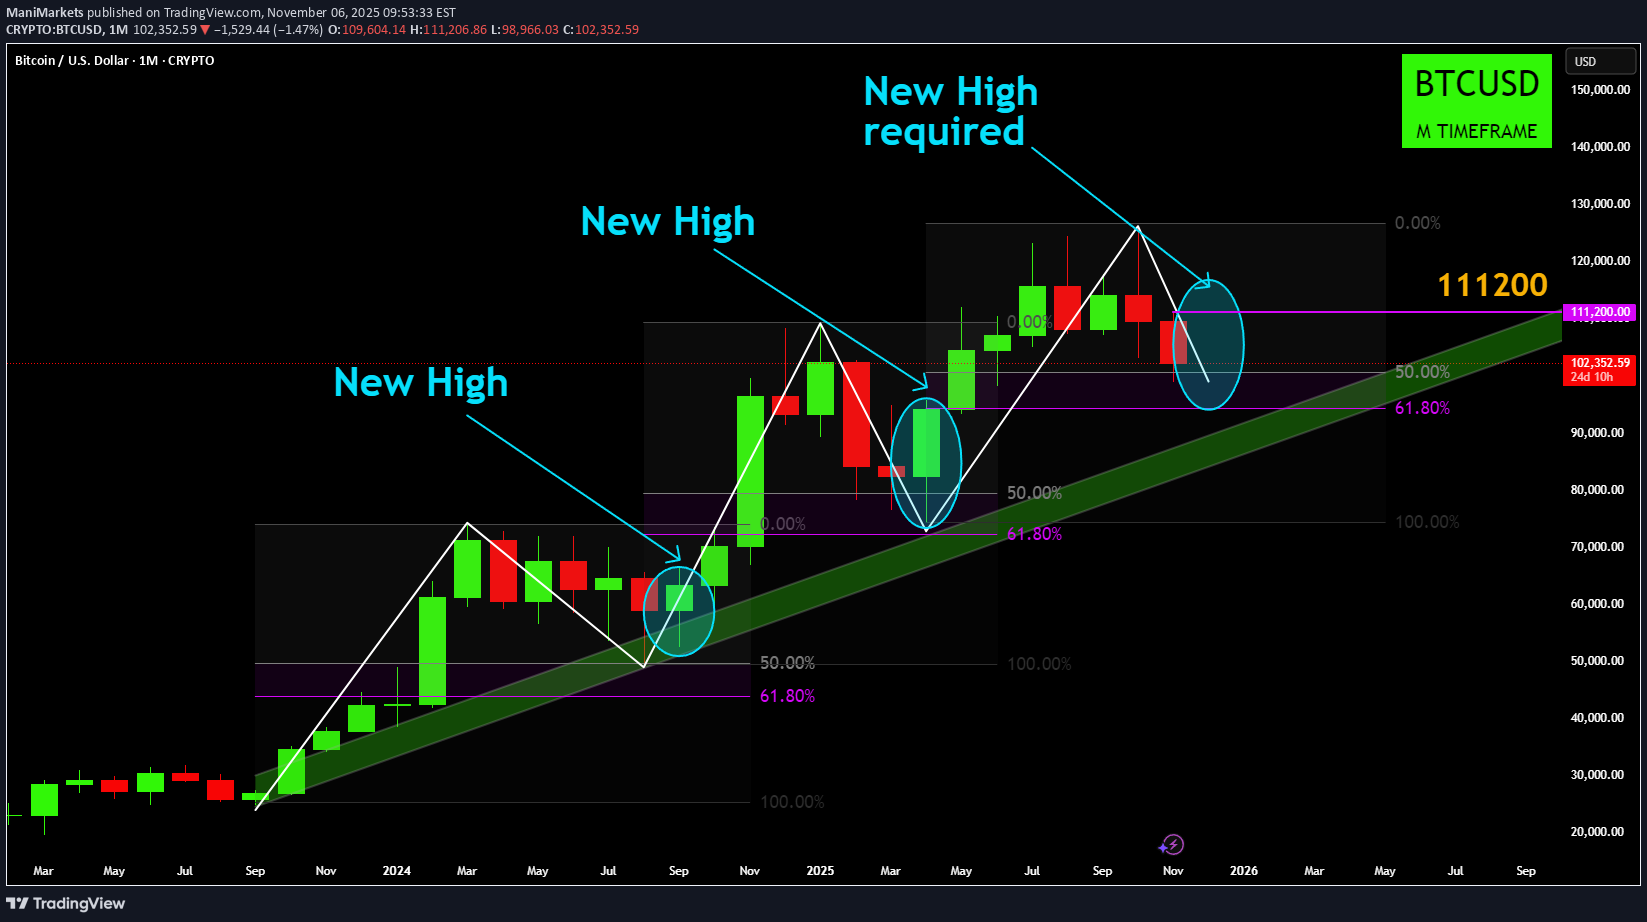
BTC ماهانه: در انتظار تایید صعودی از منطقه طلایی فیبوناچی با سلام خدمت بازرگانان این یک تحلیل سطح بالا و ماهانه از روند کلان بیت کوین است. این ایده بر اساس یک الگوی واضح و تکرارشونده است که از سپتامبر 2023 بازار صعودی را تعریف کرده است. با درک این ساختار بزرگتر، میتوانیم نوسانات فعلی را بهتر چارچوببندی کنیم و شناسایی کنیم که چه چیزی را به عنوان تأیید صعود بعدی major جستجو کنیم. 🔍 تجزیه و تحلیل Core در نمودار ماهانه، روند صعودی BTC از یک طرح ثابت پیروی کرده است: یک تکانه قوی move بالا. یک عقب نشینی اصلاحی به "منطقه طلایی" فیبوناچی (منطقه بین سطوح اصلاحی 50٪ و 61.8٪). دوره تثبیت در این منطقه، که در آن حمایت یافت می شود. خروج از این منطقه، منجر به افزایش جدید و ادامه روند. همانطور که از نمودار می بینید، این الگوی "کشش و شکست" دو بار در طول این روند صعودی اتفاق افتاده است. 📍 جایی که ما الان هستیم در حال حاضر در مقطع حساسی قرار داریم. پس از ثبت یک رکورد جدید قابل توجه (حدود 128000 دلار)، قیمت بار دیگر وارد مرحله اصلاحی شده است. قیمت در حال حاضر سطح 50 درصد فیبوناچی را در حدود 102404 دلار آزمایش می کند. این ما را کاملاً به داخل "منطقه طلایی" بازمی گرداند، همان منطقه ای که در گذشته به عنوان پشتیبان و سکوی پرشی برای قیمت عمل می کرد. 🐂 پایان نامه صعودی (تأیید) برای اینکه روند صعودی بلندمدت تایید شود، الگو باید تکرار شود: پشتیبانی باید در این منطقه فیب 50٪ - 61.8٪ باشد. قیمت باید در نهایت از این ساختار اصلاحی خارج شود و یک New High بالاتر از قله قبلی ایجاد کند. این اوج جدید تاییدیه لازم برای تکمیل عقب نشینی و ادامه روند صعودی کلان است. 🐻 فاز اصلاحی/فرار ("انتظار") تا زمانی که آن اوج جدید شکل بگیرد، باید به فاز فعلی بازار احترام بگذاریم. قیمت از نظر فنی در "حالت عقب نشینی" است. این بدان معناست که ما باید منتظر نوسانات مداوم باشیم. قیمت می تواند به راحتی برای هفته ها یا حتی ماه ها در این منطقه اصلاحی قبل از ایجاد یک جهت روشن، نوسان کند. شکستن زیر سطح 61.8 درصد فیب به صورت ماهانه بسته شدن یک علامت هشدار دهنده قابل توجه است و اعتبار کل این ساختار صعودی را به چالش می کشد. ⚠️ مهم: نمای ماکرو این یک نمودار ماهانه است. هر شمع نشان دهنده 30 روز قیمت است. این تحلیل برای دیدگاه بلندمدت (سرمایه گذاران، معامله گران موقعیت) برای درک تصویر بزرگتر ایده آل است. برای تجارت کوتاه مدت مناسب نیست. حرکت در این "منطقه طلایی" هنوز هم می تواند ده ها هزار دلار باشد. همین مفهوم (ضربه، عقبنشینی فیب، بالا) را میتوان برای بازههای زمانی کوتاهتر (مانند روزانه یا 4 ساعته) برای یافتن تنظیمات تجارت کوتاهمدت اعمال کرد، اما این نمودار خاص کاملاً یک نمای کلان است. سلب مسئولیت: اطلاعات ارائه شده در این نمودار صرفاً جنبه آموزشی و اطلاع رسانی دارد و نباید به عنوان مشاوره سرمایه گذاری در نظر گرفته شود. تجارت و سرمایه گذاری شامل ریسک قابل توجهی است و برای هر سرمایه گذار مناسب نیست. قبل از هر تصمیمی برای سرمایه گذاری باید وضعیت مالی خود را به دقت بررسی کنید و با یک مشاور مالی مشورت کنید. سازنده این نمودار هیچ نتیجه یا سود خاصی را تضمین نمی کند و مسئولیتی در قبال زیان های وارده در نتیجه استفاده از این اطلاعات ندارد. عملکرد گذشته نشان دهنده نتایج آینده نیست. از این اطلاعات با مسئولیت خود استفاده کنید. این نمودار برای بهبود خود من در تحلیل تجارت و سرمایه گذاری ایجاد شده است. لطفا قبل از هر سرمایه گذاری تحلیل خود را انجام دهید.
سلب مسئولیت
هر محتوا و مطالب مندرج در سایت و کانالهای رسمی ارتباطی سهمتو، جمعبندی نظرات و تحلیلهای شخصی و غیر تعهد آور بوده و هیچگونه توصیهای مبنی بر خرید، فروش، ورود و یا خروج از بازارهای مالی نمی باشد. همچنین کلیه اخبار و تحلیلهای مندرج در سایت و کانالها، صرفا بازنشر اطلاعات از منابع رسمی و غیر رسمی داخلی و خارجی است و بدیهی است استفاده کنندگان محتوای مذکور، مسئول پیگیری و حصول اطمینان از اصالت و درستی مطالب هستند. از این رو ضمن سلب مسئولیت اعلام میدارد مسئولیت هرنوع تصمیم گیری و اقدام و سود و زیان احتمالی در بازار سرمایه و ارز دیجیتال، با شخص معامله گر است.