
FOREXcom
@t_FOREXcom

تریدر چه نمادی را توصیه به خرید کرده؟
سابقه خرید
تخمین بازدهی ماه به ماه تریدر
پیام های تریدر
فیلتر
نوع پیام
FOREXcom
Gold Breaks Above Its All-Time Highs

در آخرین جلسه معاملاتی، یک سوگیری صعودی مجدد و پایدار در سراسر نوسانات اخیر قیمت طلا باقی مانده است که منجر به افزایش بیش از 2 درصدی شده است. این افزایش به طلا اجازه داد تا بالاتر از بالاترین رکورد قبلی خود و move بالاتر از منطقه 4400 دلار در هر اونس شکسته شود. در حال حاضر، فشار خرید غالب عمدتاً ناشی از کاهش U.S است. بازدهی خزانه داری که act جایگزین طبیعی طلا به عنوان دارایی امن است. این تغییر از تقاضای ثابت برای metal گرانبها به سمت پایان سال 2025 حمایت کرده است، زیرا اوراق قرضه در کوتاه مدت جذابیت کمتری دارند. تا زمانی که این پویایی پابرجا باشد، ادامه فشار خرید ممکن است یک ویژگی کلیدی در عملکرد قیمت XAU/USD در جلسات معاملاتی آتی باقی بماند. روند صعودی قوی تر از همیشه از روزهای پایانی آگوست 2025، نوسانات مداوم قیمت طلا به روند صعودی اجازه داده است که به عنوان ساختار فنی غالب در جای خود باقی بماند. تاکنون هیچ اصلاحیه فروش معنیداری در این روند ظاهر نشده است که حاکی از از دست دادن قدرت خرید بلندمدت باشد و این ترکیب را به عنوان مرتبطترین مرجع فنی برای طلا در جلسات پیش رو حفظ کند. با این حال، مهم است که در نظر بگیریم که با ادامه ثبت رکوردهای جدید قیمت، دورههای بلاتکلیفی ممکن است شروع به ظهور کنند که به طور بالقوه دری را برای عقبنشینیهای اصلاحی کوتاهمدت باز میکند. RSI در حالی که RSI همچنان به ارسال قرائت های ثابت بالای سطح خنثی 50 ادامه می دهد و تأیید می کند که شتاب خرید همچنان غالب است، این اندیکاتور همچنین به بالای سطح 70 حرکت کرده است که منطقه اشباع خرید را نشان می دهد. این رفتار ممکن است نشاندهنده افزایش بالقوه فشار خرید باشد و این احتمال را افزایش میدهد که اصلاحات فروش در جلسات آینده شروع شود. MACD در همین حال، هیستوگرام MACD نزدیک به خط صفر خنثی در حال نوسان است، که نشان می دهد حرکت میانگین متحرک کوتاه مدت شروع به منعکس کردن حالت عدم تصمیم گیری می کند. این محیط می تواند به دوره تثبیت قیمت طلا تبدیل شود و همچنین ممکن است دری را برای اصلاحات نزولی کوتاه مدت باز کند. سطوح کلیدی برای تماشا: 4500 دلار در هر اونس: این سطح نشان دهنده نزدیک ترین مقاومت روانی است و در غیاب مراجع فنی قبلی، به عنوان مرتبط ترین مانع برای نظارت برجسته می شود. حرکتهای صعودی که موفق میشوند در بالای این منطقه تثبیت شوند، میتوانند راه را برای یک روند صعودی تهاجمیتر به سمت پایان سال 2025 هموار کنند. 4,365 دلار در هر اونس: این سطح قبلاً منطقه بالاترین تاریخ را نشان می داد و اکنون به عنوان نزدیکترین حمایت عمل می کند. ممکن است به عنوان یک مرجع کلیدی در صورت اصلاحات کوتاه مدت فروش در قیمت طلا عمل کند. 4,163 دلار در هر اونس: این مناسب ترین سطح پشتیبانی برای تماشا است و با میانگین متحرک ساده 50 دوره همسو می شود. فشار فروش که به سمت این منطقه گسترش مییابد، میتواند باعث یک سوگیری نزولی بارزتر شود و به طور بالقوه خط روند صعودی فعلی را در معرض خطر قرار دهد. نوشته شده توسط جولیان پیندا، CFA، CMT - تحلیلگر بازار
FOREXcom
Tesla Stock Holds Strength and Breaks Above Yearly Highs
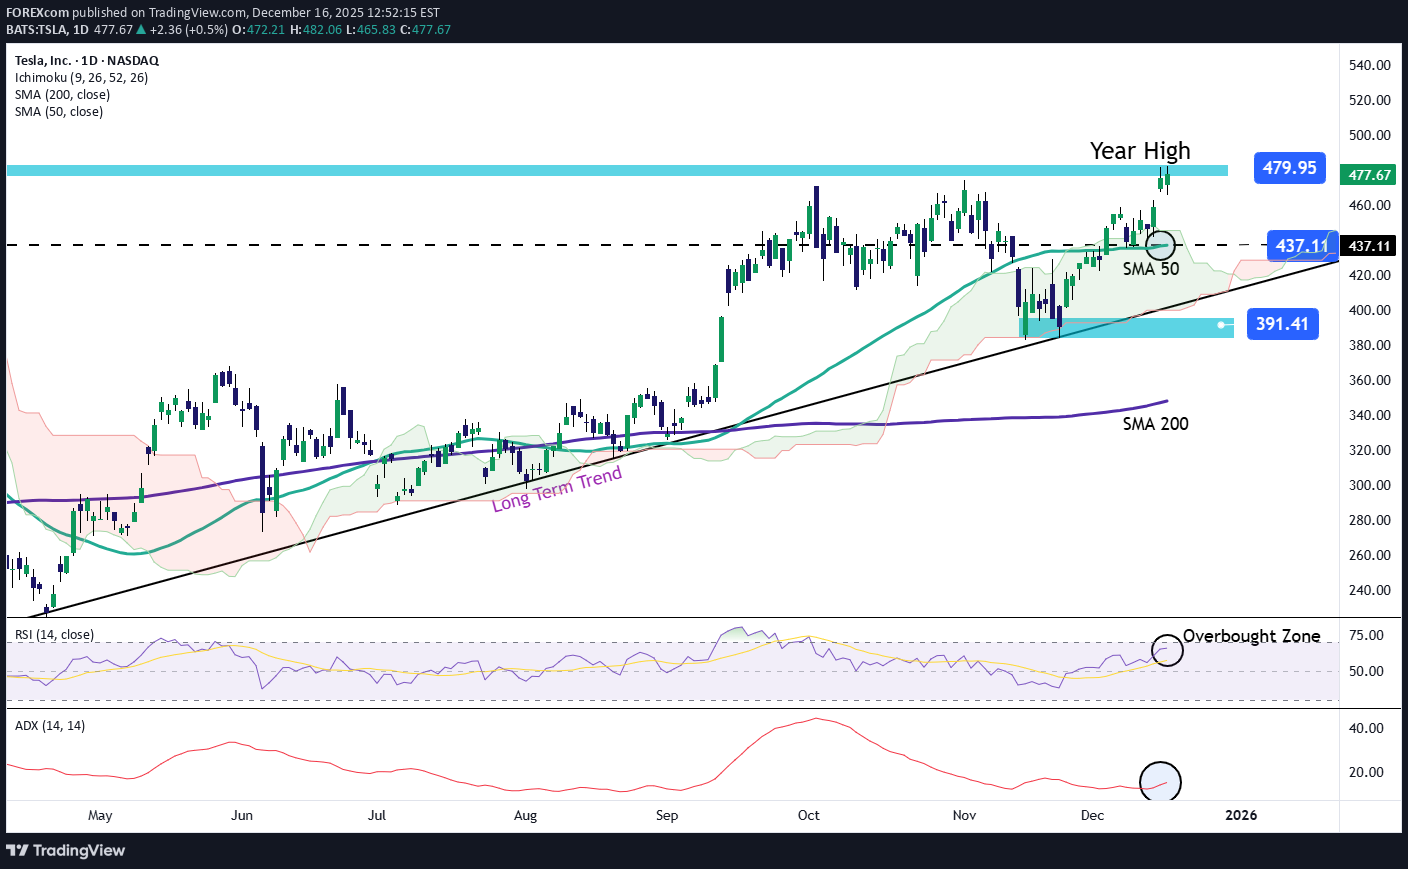
سهام تسلا به یک رگه متوالی از سه جلسه صعودی متوالی دست یافته است که در آن دوره بیش از 5 درصد افزایش داشته است. در حال حاضر، فشار خرید پس از اعلامیههای اخیر که نشان میدهد شرکت تست روباتاکسی بدون نظارت را تایید کرده است، ثابت مانده است، توسعهای که میتواند نقطه عطف مهمی در برنامه خودروهای خودران تسلا باشد و به پروژهای با تاثیر طولانی مدت major تبدیل شود. این اطلاعیه در جلسات اخیر اعتماد به سهام را تقویت کرده است و ممکن است در روزهای آینده به حمایت از فشار خرید ثابت ادامه دهد. روند صعودی بلند مدت دست نخورده باقی می ماند یادآوری این نکته مهم است که حرکات صعودی تسلا از آوریل سال جاری روند صعودی ثابتی را حفظ کرده است. در جلسات اخیر، فشار خرید دوباره تقویت شده است، حتی قیمت را به سمت منطقه 480 دلاری سوق داده است - سطحی که از دسامبر 2024 به طور مداوم مشاهده نشده است. اگر فشار خرید در کوتاه مدت ثابت بماند، روند صعودی بلندمدت می تواند بر روند قیمت تسلا تا پایان سال تسلط داشته باشد. با این حال، در نظر گرفتن این نکته نیز مهم است که مواجهه با اوج های فعلی ممکن است فضایی برای اصلاحات نزولی کوتاه مدت ایجاد کند. RSI در حال حاضر، خط RSI به نوسان بالای سطح خنثی 50 ادامه میدهد، که نشان میدهد شتاب خرید همچنان بر عملکرد کوتاهمدت قیمت حاکم است. با این حال، RSI در حال حاضر به منطقه خرید بیش از حد (70) نزدیک شده است، که ممکن است نشانه عدم تعادل بالقوه در حرکت باشد و در را برای عقب نشینی های کوتاه مدت باز کند. ADX خط ADX زیر سطح 20 باقی می ماند که نشان دهنده یک دوره بی طرفی در نوسانات متوسط در 14 جلسه گذشته است. این نشان میدهد که اگر یک جهت قویتر move در کوتاهمدت رخ ندهد، ممکن است مرحله عدم تصمیم گیری مداوم ادامه یابد، که به طور بالقوه منجر به اصلاحات نزولی موقت میشود. سطوح کلیدی برای تماشا: 480 دلار - مقاومت حیاتی: سطحی که از سال 2024 مشاهده نشده است و قیمت major برای سال 2025. خرید پایدار بالاتر از این سطح می تواند سوگیری صعودی را تقویت کند و به طور بالقوه قیمت را به سمت مرز روانی 500 دلار سوق دهد. 437 دلار - پشتیبانی نزدیک: این سطح با میانگین متحرک دوره 50 مطابقت دارد و ممکن است act به عنوان حمایت اولیه در صورت وقوع اصلاحات نزولی کوتاه مدت. 391 دلار - پشتیبانی نهایی: این سطح مربوط به پایین ترین سطح اخیر است. عقب نشینی به سمت این منطقه می تواند یک سوگیری نزولی را دوباره فعال کند و ساختار صعودی فعلی را در معرض خطر قرار دهد. نوشته شده توسط جولیان پیندا، CFA، CMT - تحلیلگر بازار
FOREXcom
Gold Breakout Bull Pennant #3
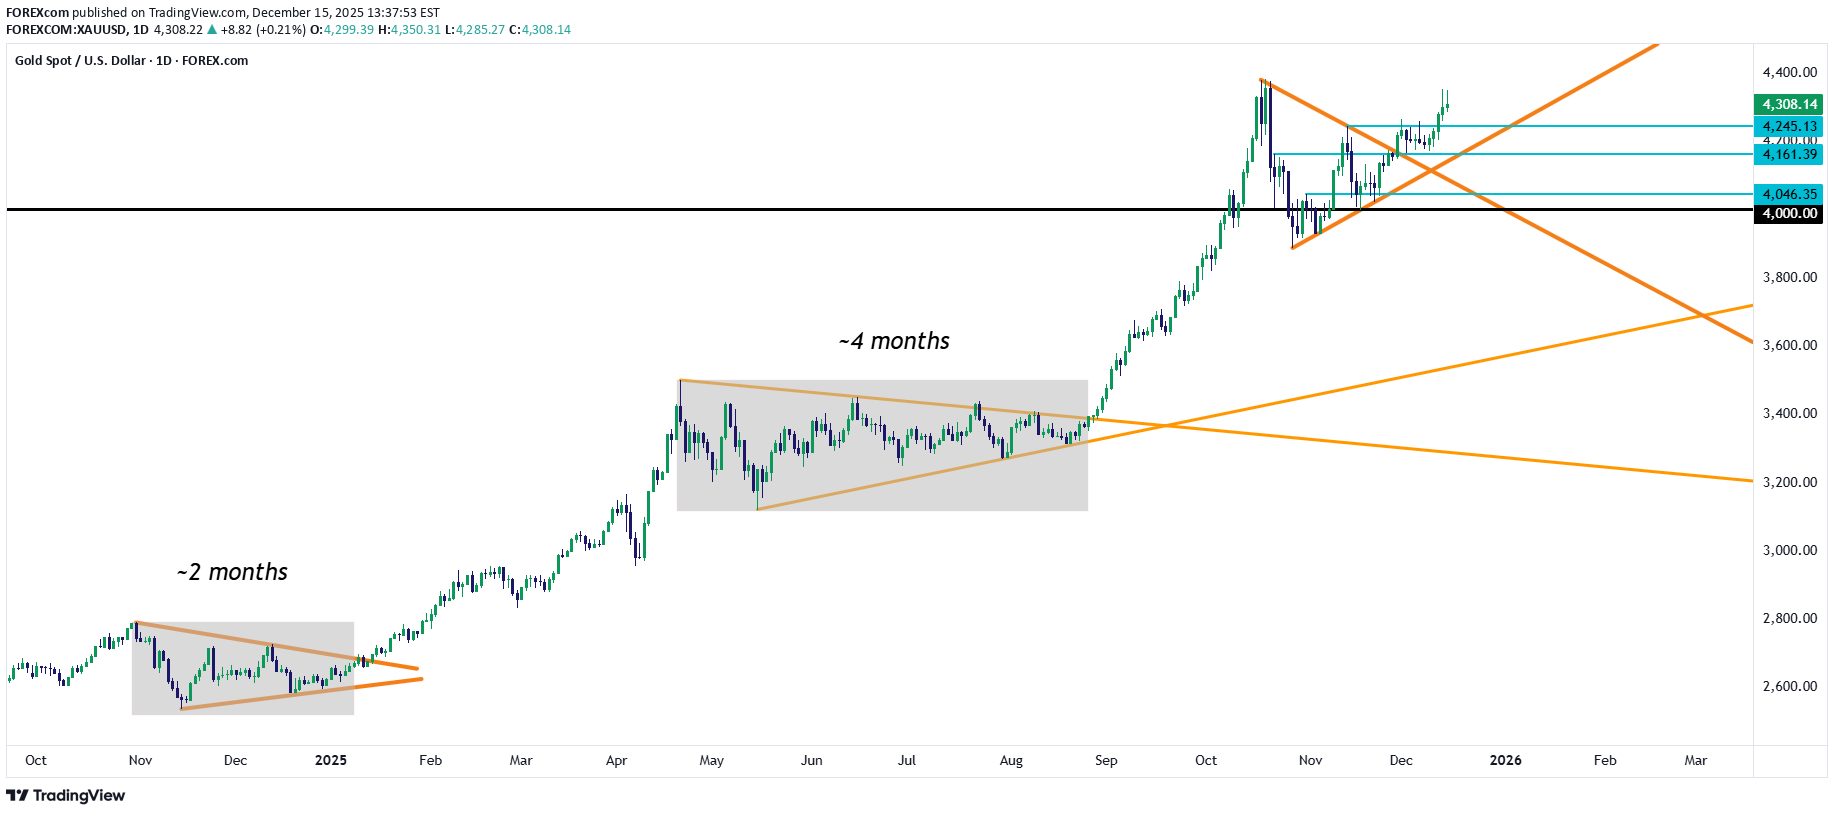
سال قدرتمند دیگری برای طلا بوده است و با توجه به اینکه رئیس جمهور Trump تصمیم دارد جانشینی را برای پست رئیس فدرال رزرو معرفی کند، درها می تواند به روی سطوح بالاتر باز شود، مشروط بر اینکه یک عامل بسیار major مشکل ساز نشود و آن تورم است. طلا از علامت گاو نر شماره 3 به دلیل این خبر که Trump کوین هاست را به عنوان رئیس بعدی فدرال رزرو معرفی می کند، بیرون آمد. Bond به نظر نمی رسید که بازارها از این خبر خوشحال شوند زیرا بازدهی خزانه داری پس از انتشار آن افزایش یافت، که احتمالاً یکی از دلایلی است که Trump از موضعی که او قبلاً گفته بود از قبل می دانست چه کسی را نام برد، تا موضع فعلی یکی از دو کوین (کوین وارش، دیگری) نرم شده است. هاست سابقه ای به عنوان یک کبوتر باردار دارد و این حتی در دولت های دموکرات نیز وجود دارد. در مقاله ای برای AEI که در سال 1999 منتشر شد، ظاهراً او آلن گرینسپن را به دلیل تهدید افزایش نرخ بهره برای ایجاد حباب اینترنت فرا خواند. آن مقاله در 3 سپتامبر 1999 منتشر شد، بنابراین حدود شش ماه قبل از اینکه سهام به اوج برسد. اما فدرال رزرو نیز چند بار بین این دو رویداد با افزایش 50 واحدی در ماه می سال 2000، پس از اینکه ارزش سهام قبلاً به بالاترین سطح خود رسیده بود، افزایش یافت (اما در آن زمان ما این را نمی دانستیم). همانطور که به سال 2026 می رویم، به نظر می رسد هر کسی که Trump کاهش نرخ های بعدی رئیس فدرال رزرو را نام می برد، درگیر شد، زیرا او قبلاً گفته است که تمایل به کاهش نرخ ها یک "آزمون تورنسل" است برای اینکه در نهایت چه کسی را برای رهبری بانک معرفی می کند. او همچنین گفته است که مایل است شاهد کاهش نرخها به زیر 1 درصد باشد که این امر باعث میشود که نرخها از FOMC به چرخهای دیگر سوق دهند، و اگر تورم مشکل ساز نشود، این امر میتواند باعث افزایش بیشتر در سهام و فلزات شود که در چند سال گذشته تثبیت شدهاند. برای طلا، هفته آینده data می تواند فرصتی را ایجاد کند زیرا metal قبلاً از سومین شکل گیری پرچم گاو نر که من در این پست ها در اواخر نوامبر برجسته کرده بودم، بیرون آمده است. در حال حاضر پتانسیل پشتیبانی در 4245، 4161 و 4046 وجود دارد، که هر کدام میتوانند برای پایینتر از عقبنشینی زیر 4k مورد استفاده قرار گیرند. - js
FOREXcom
خطر سقوط بیت کوین جدی شد؛ منتظر ریزش تا چه سطحی باشیم؟
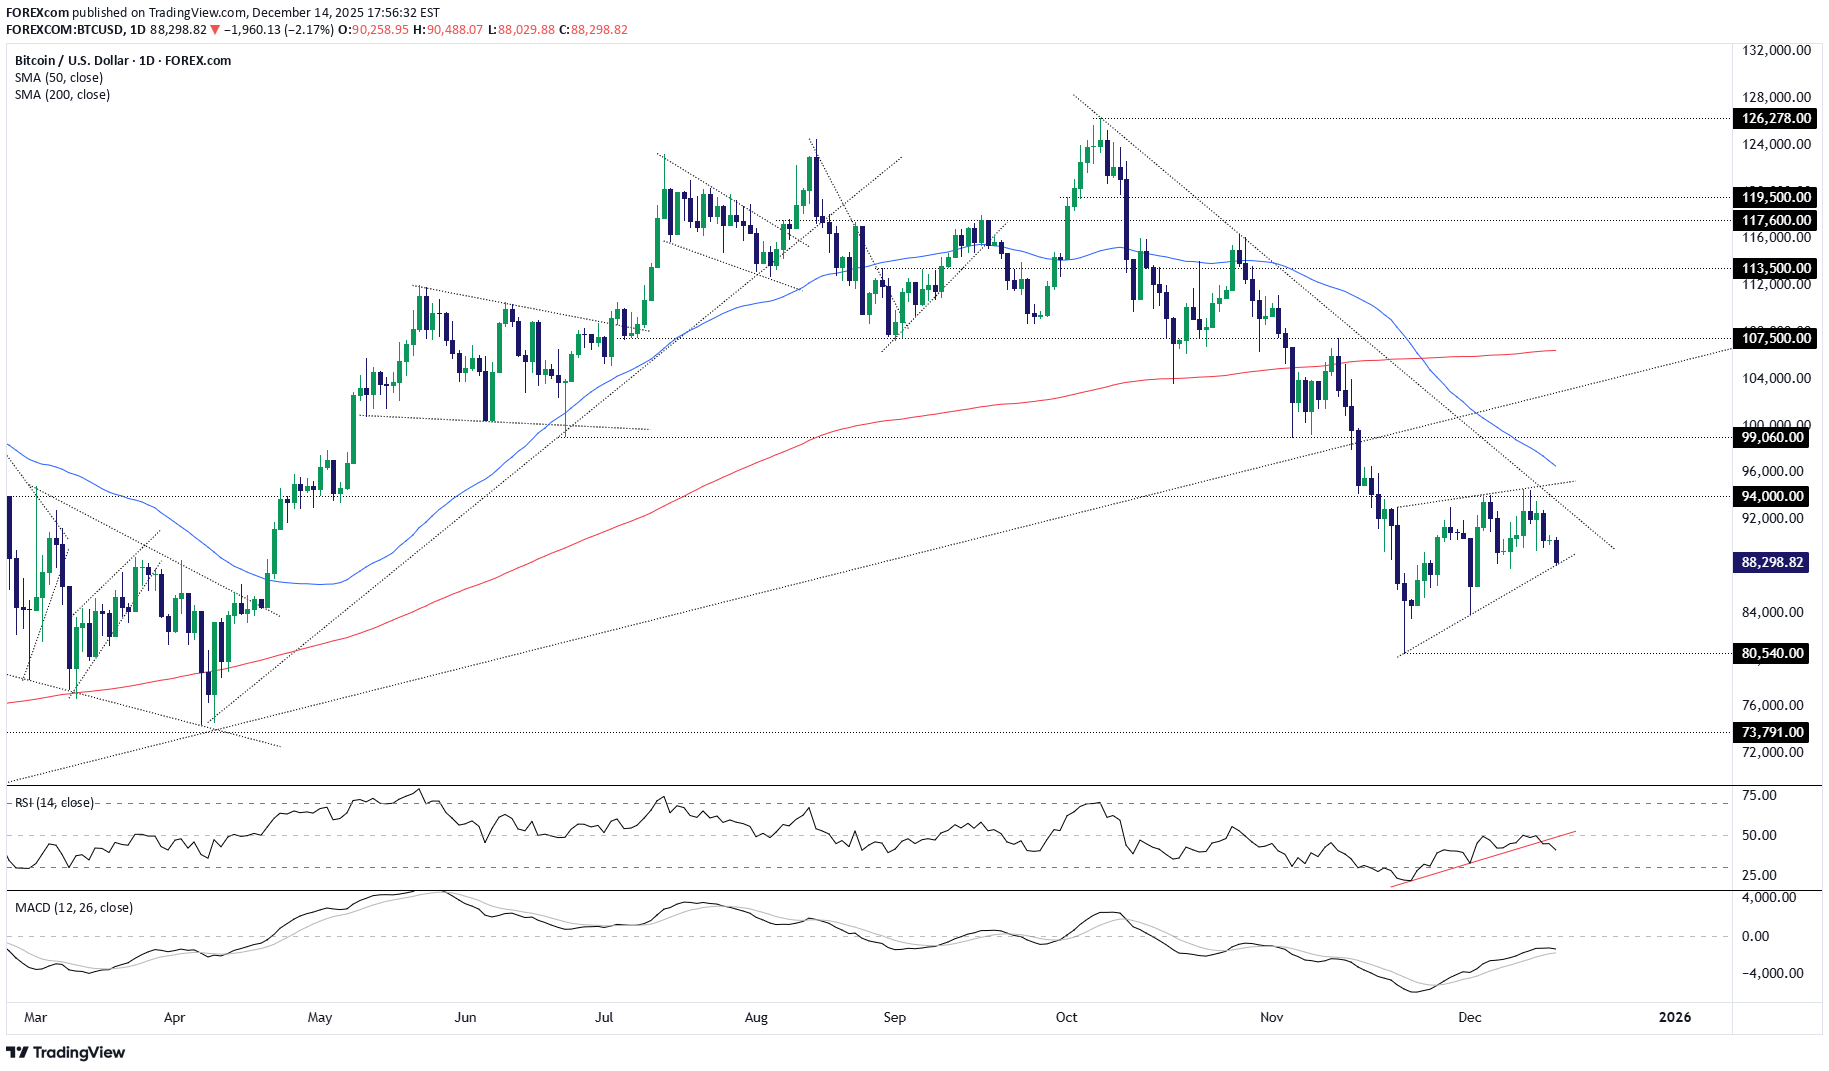
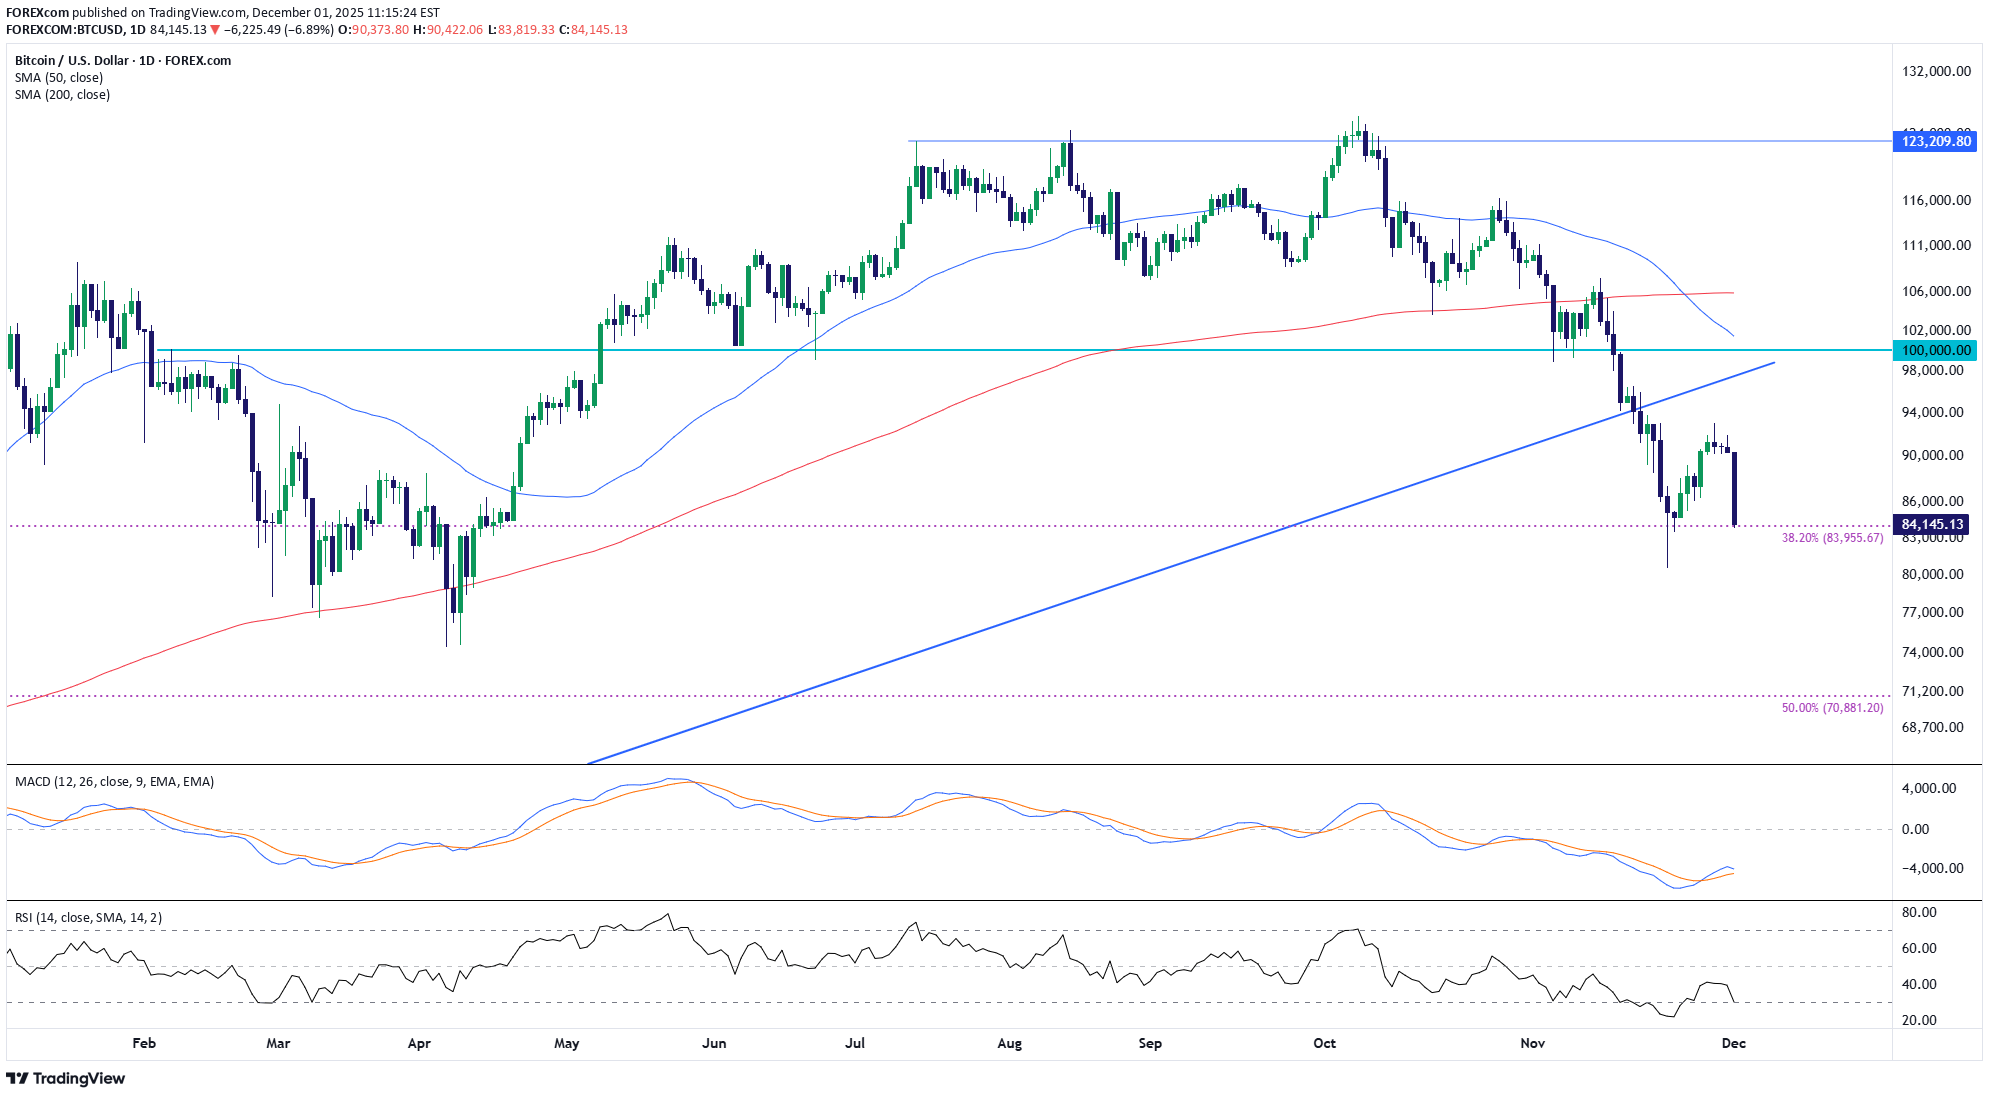
معامله گران در شرایطی که پس از یک روند نزولی طولانی مدت در یک روند صعودی قرار دارند، باید برای از سرگیری روند نزولی گسترده تر بیت کوین هوشیار باشند و پایین ترین سطح ماه نوامبر یا حتی پایین ترین سطح از سال تا کنون را مجدداً آزمایش کنند. قیمت در حال حاضر در برابر روند صعودی نوامبر قرار گرفته است، با شکستن این سطح، راه را برای موج بالقوه دیگری از فروش باز می کند. اگر شاهد شکست 87,800 دلاری باشیم - پایین ترین قیمت در 7 دسامبر که در زیر روند صعودی قرار دارد - می توان شورت را با توقف در بالا در نظر گرفت تا در برابر برگشت محافظت شود. پایین ترین سطح 1 دسامبر درست زیر صفحه نمایش 84000 دلار به عنوان هدف اولیه، با شکست زیر این سطح، نادر 21 نوامبر 80540 دلار را در منوی خرس ها قرار داد. در صورت دستیابی به این هدف، معاملهگران میتوانند بسته به عملکرد قیمت در آن زمان، موقعیت را کاهش دهند، حفظ کنند یا معکوس کنند. با شکستن روند صعودی RSI (14) و دور شدن بیشتر از سطح خنثی 50، نشان می دهد که فشار نزولی دوباره در حال افزایش است و به نفع تنظیمات نزولی است. اگرچه هنوز توسط MACD تأیید نشده است، اما به سمت خط سیگنال خمیده می شود و به یک متقاطع نزدیک می شود که سیگنال نزولی را تقویت می کند. موفق باشید! DS
FOREXcom
اتریوم در دوراهی: آیا ترس موقتی است یا سقوط در راه است؟ (تحلیل مهم ترید)
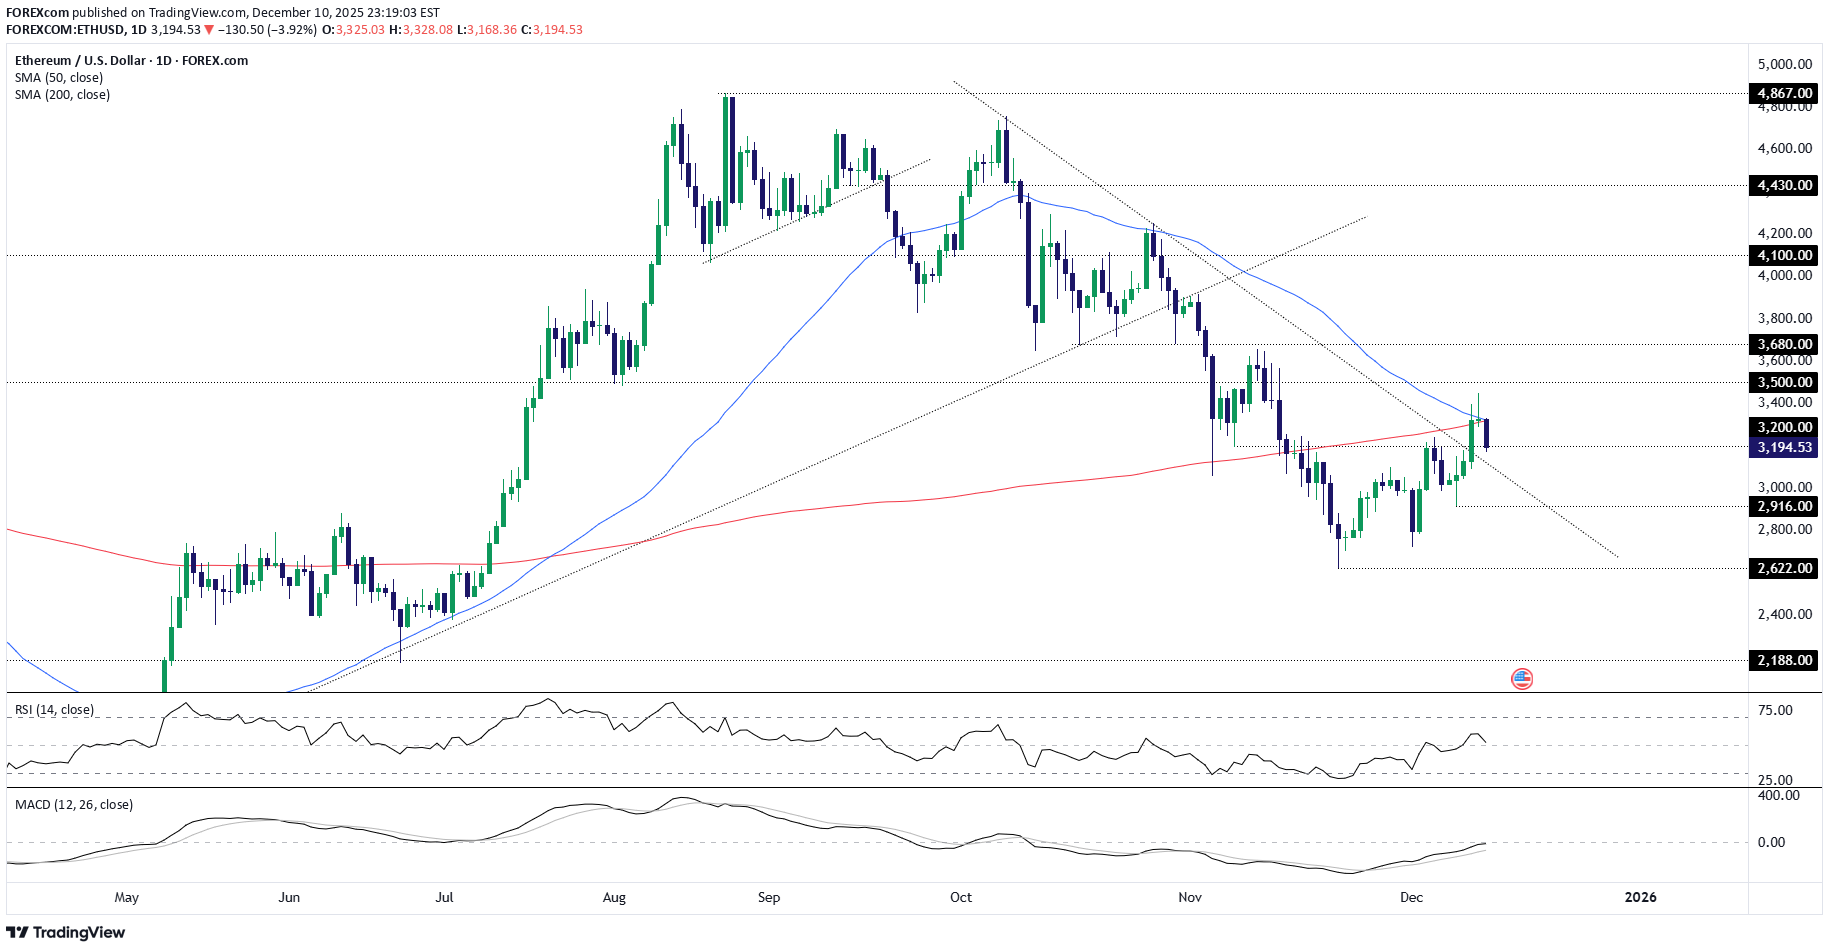
ETH/USD یک الگوی تاپینگ روی تیک روزانه قرار داده است و پس از یک کاوشگر صعودی ناموفق در بالای تعامل 50 و 200DMA، یک شمع ستاره تیرانداز چاپ می کند. همانطور که اوضاع پیش میآید، شمع پنجشنبه یک الگوی برگشت نزولی ستاره عصر را تکمیل میکند، اگر در اطراف این سطوح یا پایینتر بسته شود و سیگنال نزولی را دوبرابر کند. با این حال، من به ریسک گستردهتر move در آسیا اعتماد ندارم، که ظاهراً ناشی از نگرانیهای جدید در مورد سقف AI پس از بهروزرسانی اوراکل است. من گمان میکنم که این موضوع به همان اندازه مربوط به قدرت ین است که پس از کاهش نه چندان شاهین فدرال رزرو در روز چهارشنبه بر نیکی تأثیر میگذارد. با یک همبستگی تقریباً کامل بین معاملات آتی Nikkei و دارایی های ریسکی مانند Ethereum در یک دقیقه یک دقیقه ای در یک ساعت گذشته، به نظر می رسد که move ممکن است زمانی که اروپا راه اندازی شود و کار کند، محو شود. من قیمت 3200 دلاری را از نزدیک دنبال میکنم که در حال تغییر است زیرا به عنوان یک سطح ایدهآل برای ایجاد معاملات، با توجه به حمایت و مقاومت در ماه گذشته نمایش داده میشود. اگر قیمت در اروپا کمتر از 3200 دلار است، برای محافظت از یک شلوار کوتاه با توقف بالا، در ابتدا 3000 دلار یا 2916 دلار را هدف قرار دهید. اما اگر قیمت به بالای 3200 دلار برگردد و در آنجا باقی بماند، گزینه ای وجود دارد که برای محافظت، Long هایی را با یک توقف در زیر تعیین کنید، و محل تلاقی 50 و 200DMA یا بالاترین قیمت چهارشنبه بالای 3450 دلار را هدف قرار دهید. تصویر حرکت خنثی است و در هنگام ارزیابی هر دو تنظیم، تأکید بیشتری بر عملکرد قیمت دارد. موفق باشید! DS
FOREXcom
Bitcoin Holds 90,000 Ahead of FOMC
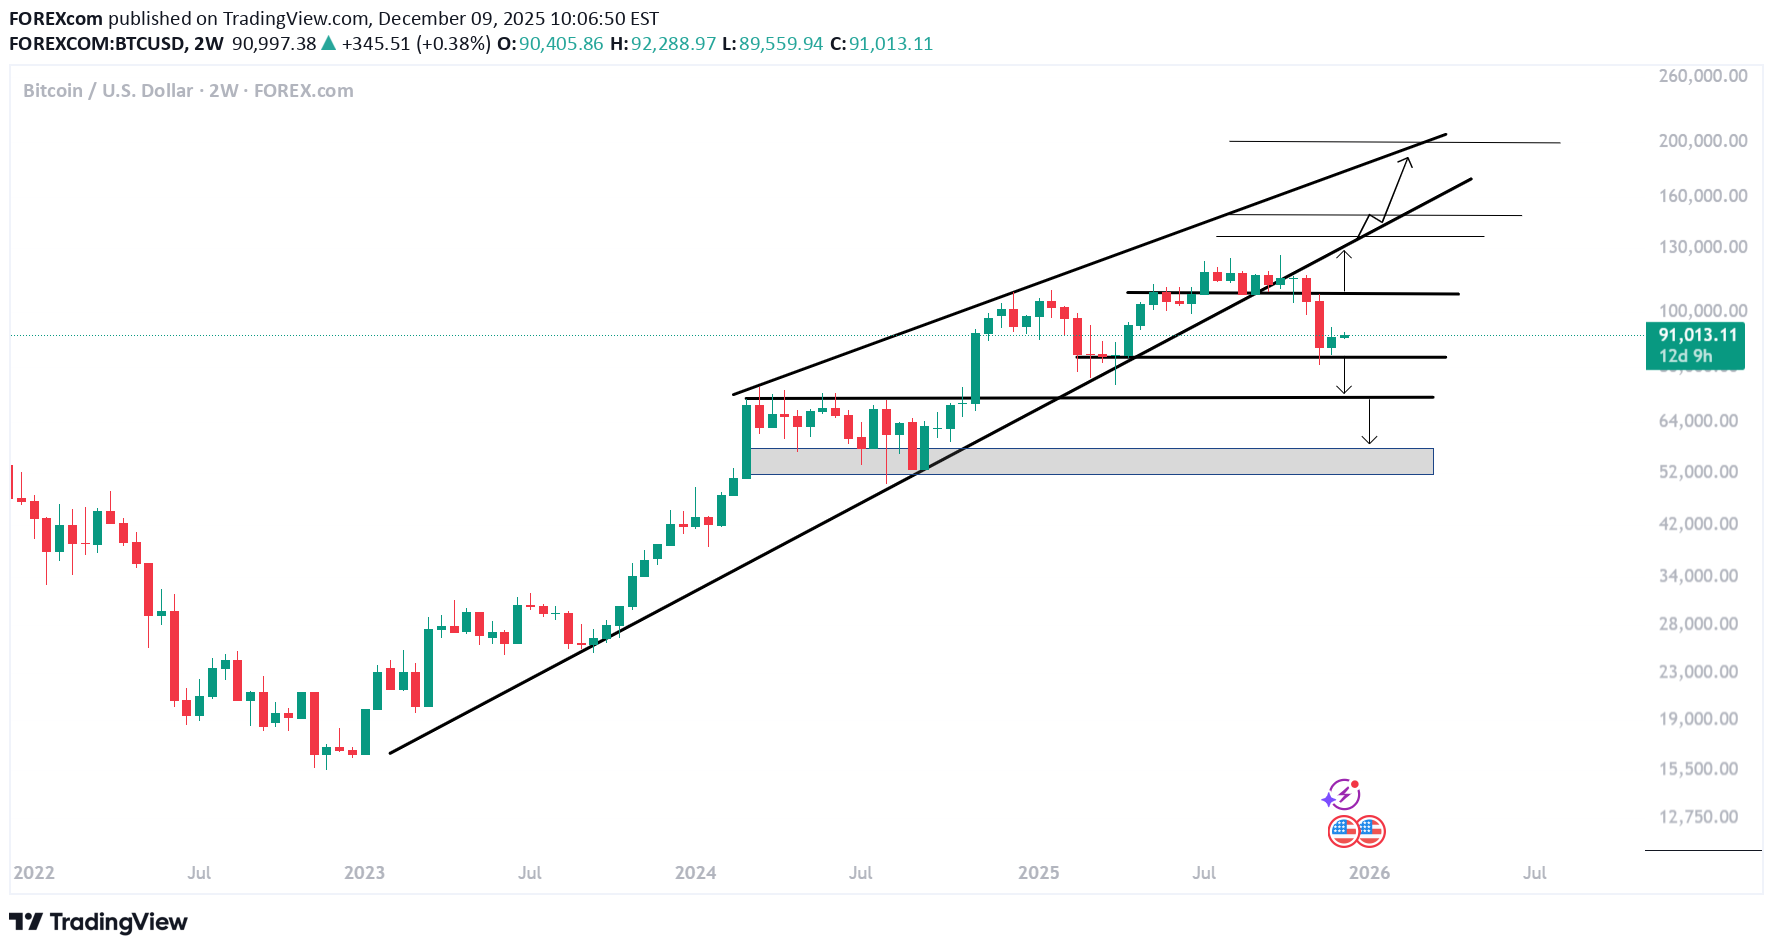
ترس بازار انتظارات Bitcoin را به 50,000 رساند، با این حال حمایت 80,000 و روایت رالی بابانوئل، زمین را پیش از نتیجه فردای FOMC حفظ کرده است. Bitcoin در حال حاضر در زیر خط روند معامله میشود که سطوح پایینتر متوالی را از نوامبر 2022 به هم متصل میکند، که نشاندهنده یک سوگیری نزولی است مگر اینکه قیمت دوباره این مانع و مقاومت 110000 را به دست آورد. بسته شدن بیش از 110000، حرکت صعودی را دوباره برقرار میکند و دری را به سوی رکورد تاریخ 126000 باز میکند و پس از آن رکوردهای بالقوه جدید نزدیک به 137000، 150000 و 190000 تا 200000 در همراستایی با بالاترین 2020 از دسامبر 2 به خط روند بالاتر از 2 مارس 2. از جنبه نزولی، انتظار می رود افت زیر 80000 باعث افزایش زیان به 70000 شود و در موارد شدیدتر، افت زیر 70000 می تواند منطقه 50000 را نشان دهد. (منطقه پشتیبانی قبلی بین مارس و سپتامبر 2024) - رزن هلال، CMT
FOREXcom
سقوط بیت کوین: سطوح حیاتی حمایت و مقاومت که باید زیر نظر بگیرید!
درست زمانی که همه چیز دوباره آرام به نظر میرسید، رمزارزها امروز مجدداً دچار افت شدیدی شدند و در نتیجه، شاخصهای ایالات متحده از اوجهای پیشین خود عقبنشینی کردند. [این دارایی] در حدود ۹۴ هزار دلار با مقاومت روبرو شد، که پیش از این یک سطح حمایتی بود؛ و امروز سطح حمایت موقت حدود ۹۱ هزار دلار را شکست، که منجر به فعال شدن دستورات حد ضرر خریدارانی شد که در افتها اقدام به خرید کرده بودند. مثل همیشه، حمایت کلیدی در سطح ۸۵.۳ هزار دلار قرار دارد، اما اگر این بار نتواند دوام بیاورد، ۸۰ هزار دلار میتواند هدف بعدی باشد. در جهت صعودی، ۹۱ هزار دلار مهمترین سطح برای یکی دو روز آینده بود، و اگر این سطح بازپس گرفته شود، ۹۴ هزار دلار نقطه مرجع بعدی برای تحت نظر گرفتن بود. از طرف فواد رزاقزاده، تحلیلگر بازار در FOREX.com.
FOREXcom
بیت کوین در مسیر سقوط؛ آیا حمایت فیبوناچی جلوی ریزش بیشتر را میگیرد؟
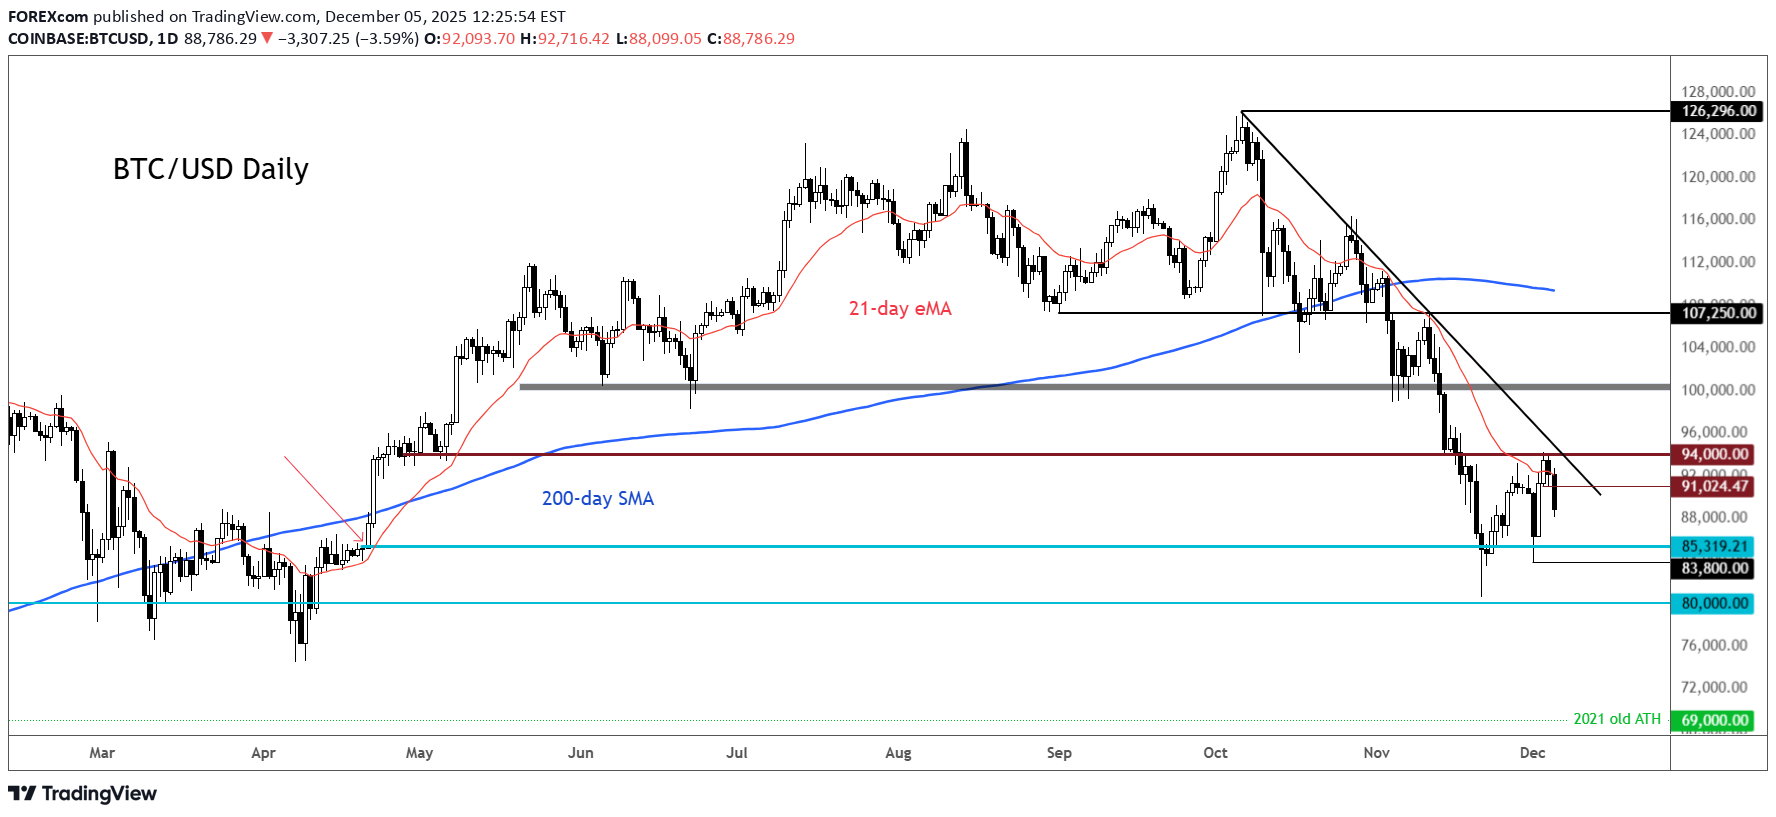
Bitcoin همچنان تحت فشار نزولی آشکاری معامله میشود، پس از آنکه در ماه نوامبر خط روند صعودی بلندمدت خود را شکست. تلاش اخیر برای جهش در نزدیکی ناحیه زیرین همان خط روند—که اکنون به عنوان مقاومت پویا عمل میکند—متوقف شد و از آن زمان تاکنون قیمت دوباره به سمت پایین چرخیده است. ساختار کلی هنگامی که قیمت به زیر میانگین متحرک ساده ۵۰ روزه (SMA) و ۲۰۰ روزه سقوط کرد، به حالت نزولی تغییر کرد، و هر دوی این میانگینها اکنون در حال مسطح شدن یا رو به پایین شدن هستند. این وضعیت، بازار را در محیطی با کاهش شتاب قرار میدهد که در آن فروشندگان کنترل را حفظ میکنند، مگر اینکه یک بازیابی پایدار در بالای میانگینهای متحرک کلیدی شکل بگیرد. همچنین، نمودار تلاقی (همگرایی) را در اطراف سطح بازگشتی ۳۸.۲٪ فیبوناچی که از کف نوسانی major ترسیم شده است، نشان میدهد؛ این سطح نزدیک به آخرین ناحیه واکنش قرار دارد. جهش اولیه از این ناحیه نشان میدهد که مشارکتکنندگان از این سطح آگاه هستند، اگرچه ادامه حرکت (پیگیری) فعلاً محدود مانده است. اندیکاتورهای شتاب، ضعف پایداری را منعکس میکنند. اندیکاتور MACD همچنان در قلمرو منفی باقی مانده است، در حالی که هر دو خط سیگنال آن زیر صفر حرکت میکنند و تنها نشانههای ناچیزی از تثبیت دیده میشود. RSI اخیراً قبل از تلاش برای صعود، وارد محدوده ۳۰ شد که نشان میدهد شرایط اشباع فروش مورد آزمایش قرار گرفته است، اما شتاب کلی به طور قانعکنندهای بهبود نیافته است. در مجموع، نمودار همچنان تمایل نزولی دارد، تا زمانی که بازار زیر خط روند شکسته شده و میانگینهای متحرک major باقی بماند. رفتار قیمت در اطراف منطقه فیبوناچی، سنجه مهمی بود برای ارزیابی اینکه آیا این کاهش به یک فاز اصلاحی عمیقتر تبدیل میشود یا شروع به کفسازی میکند. -MW
FOREXcom
سطوح کلیدی بیت کوین (BTC/USD) که باید زیر نظر بگیرید: آیا کف قیمتی تشکیل شد؟
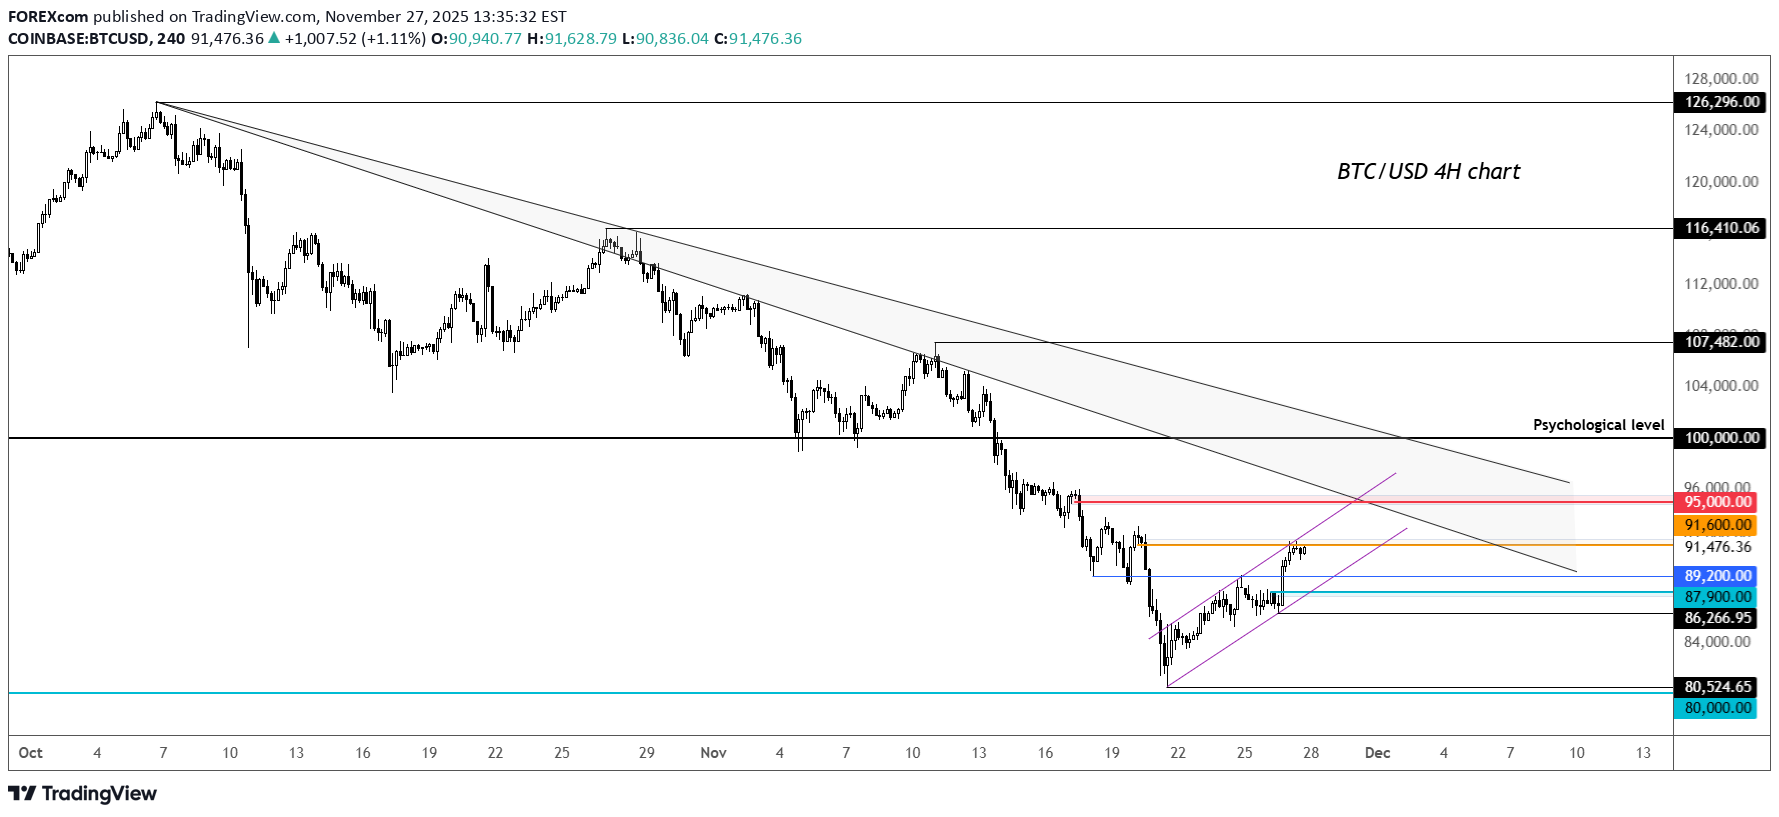
Bitcoin همچنان در حال بهبود از افتهای شدید خود است و چند سطح مهم کوتاهمدت را شکسته است، هرچند که هنوز برای قضاوت درباره اینکه آیا کفسازی کرده است یا خیر، زود است. با این وجود، خط روند نزولی همچنان پابرجا است. ۹۱.۶ هزار دلار، آخرین حمایت قبل از ریزش شدید و سقف کانال صعودی را مشخص میکند؛ ما قبلاً شاهد اندکی واکنش از این سطح بودهایم. ۹۵.۰ هزار دلار سطح مهم دیگری در جهت صعودی است. حمایتها در ۸۹.۲ هزار دلار و سپس ۸۷.۹ هزار دلار قرار دارند. اگر از کف اخیر ۸۶۲۶۶ پایینتر برویم، سوگیری (تمایل) بازار دوباره نزولی شد. از فؤاد رزاقزاده، تحلیلگر بازار در FOREX.com
FOREXcom
چکش بیت کوین و راز نوسان انویدیا: آیا کف قیمتی رسیدیم؟
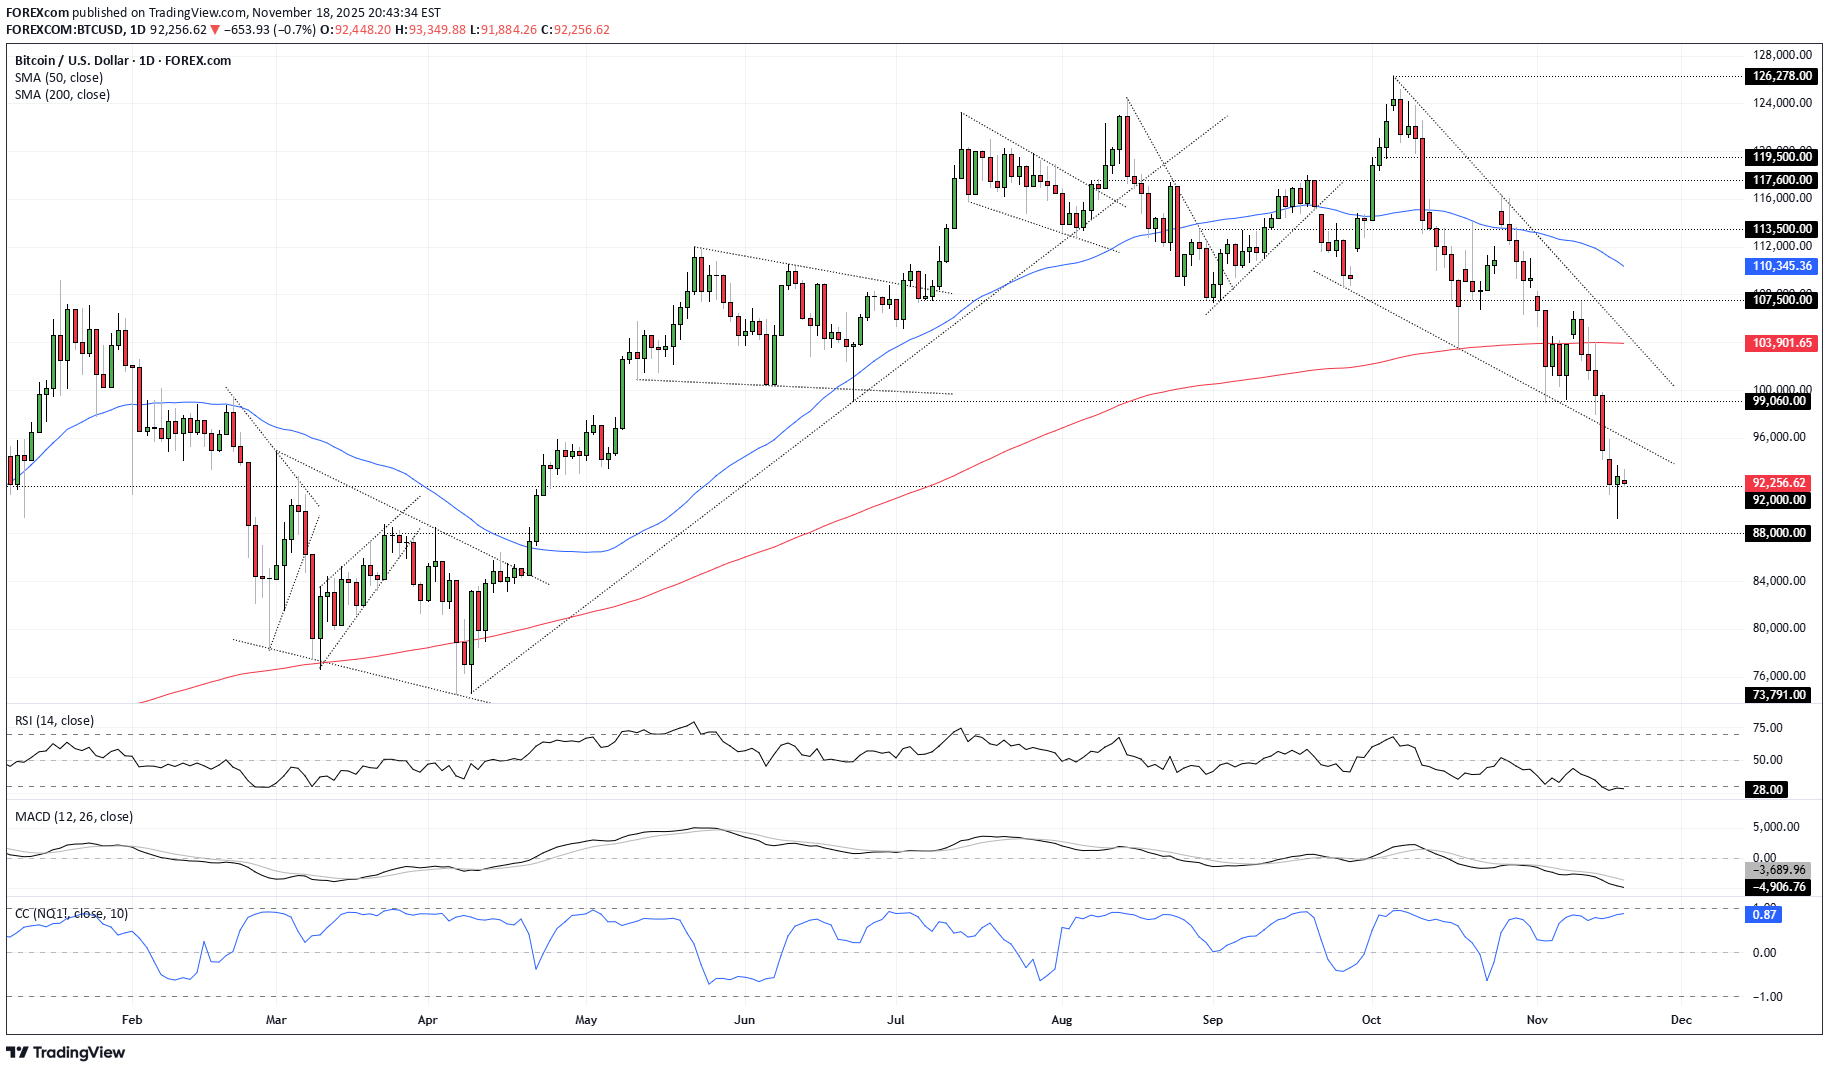
مسلماً، میتوان آن را بهراحتی بهعنوان گرفتن چاقوی در حال سقوط یا مربع شدن موقعیت قبل از یک رویداد ریسک کلیدی در نظر گرفت، اما شمع چکشی که در نمودار روزانه BTC/USD چاپ میشود، من را علاقهمند کرده است، بهویژه که از منطقهای آمده است که در گذشته خرید را جذب میکرد. این باعث میشود به این فکر کنم که آیا در حال حاضر شاهد کاهشها بودهایم و دری را برای راهاندازیهای طولانی مدت ضد روند در کوتاه مدت باز کردهایم. برای اولین بار، BTC/USD سابقه مناسبی برای ارائه سیگنالهای برگشتی صعودی و نزولی قابل اعتماد دارد. شمع ستاره تیرانداز در 6 اکتبر نزولی move را آغاز کرد، با نزولی که در 11 نوامبر مصادف شد با از سرگیری روند خرسی پس از یک جهش زودگذر. و این تنها سیگنالهایی است که اخیراً دیدهایم، و بسیاری دیگر در اوایل سال نشان دادهاند که پیشگو هستند. ثانیا، افت و برگشت از زیر 92000 دلار با توجه به عملکرد قیمتی که در سال گذشته در حدود سطح مشاهده شد، قابل توجه است. در اواخر سال 2024 و اوایل سال 2025، افت و جهش های مداومی از زیر آن وجود داشت، قبل از اینکه در نهایت پس از شکست نزولی موفقیت آمیز در فوریه، در نهایت به ارائه مقاومت تغییر کرد. اکنون با آزمایش مجدد سطح از بالا، نمی توانید سیگنال را به طور کامل رد کنید. در حالی که شاخصهای مومنتوم به شدت نزولی باقی میمانند و به تقویت فروش کمک میکنند، با RSI (14) که اکنون در قلمروی بیش از حد فروش قرار دارد، زمینههایی برای معاملات طولانی با روند مخالف برای کسانی که پیشبینی کوتاهی میکنند وجود دارد. در حال حاضر، من قیمت حدود 92,000 دلار را تماشا میکنم، زیرا ما move به رویداد کلان کلیدی هفته، گزارش درآمد Nvidia، میرسیم. با ضریب همبستگی 0.87 با معاملات آتی Nasdaq 100 طی دو هفته گذشته، نشان می دهد که چگونه معامله گران به به روز رسانی درآمد واکنش نشان می دهند احتمالاً بر نحوه معامله BTC / USD تأثیر می گذارد. اگر قیمت 92000 دلار باقی بماند، میتوان Longها را بالاتر از سطح با توقفی در زیر برای محافظت قرار داد، و یا پشتیبانی از روند نزولی سابق در حدود 96000 دلار امروز یا حمایت قبلی 99060 دلار را هدف قرار داد. در گزارش درآمد انویدیا، من فکر نمیکنم کسی بتواند با قطعیت درباره آنچه اتفاق میافتد صحبت کند، به غیر از تاریخ که نشان میدهد غول تراشه احتمالاً با راهنماییهای صعودی مدیرعامل جنسن هوانگ، پیشبینیهای درآمدی بالای خود را پشت سر گذاشت. اما این اساساً اتفاق نظر است، به این معنی که عملکرد داراییهای پرریسکتر در عواقب بعدی ممکن است منعکس کننده این باشد که آیا به اندازه کافی برای توجیه hype خوب است یا خیر. مطمئنا، عقب نشینی اخیر مقدار bar را تا حدودی کاهش داده است، اما bar فوق العاده بالا باقی می ماند. اگر بتواند تحت تاثیر قرار دهد، bitcoin ممکن است به خوبی جهش کند. موفق باشید! DS
سلب مسئولیت
هر محتوا و مطالب مندرج در سایت و کانالهای رسمی ارتباطی سهمتو، جمعبندی نظرات و تحلیلهای شخصی و غیر تعهد آور بوده و هیچگونه توصیهای مبنی بر خرید، فروش، ورود و یا خروج از بازارهای مالی نمی باشد. همچنین کلیه اخبار و تحلیلهای مندرج در سایت و کانالها، صرفا بازنشر اطلاعات از منابع رسمی و غیر رسمی داخلی و خارجی است و بدیهی است استفاده کنندگان محتوای مذکور، مسئول پیگیری و حصول اطمینان از اصالت و درستی مطالب هستند. از این رو ضمن سلب مسئولیت اعلام میدارد مسئولیت هرنوع تصمیم گیری و اقدام و سود و زیان احتمالی در بازار سرمایه و ارز دیجیتال، با شخص معامله گر است.