
CoffeeshopCrypto
@t_CoffeeshopCrypto

تریدر چه نمادی را توصیه به خرید کرده؟
سابقه خرید
تخمین بازدهی ماه به ماه تریدر
پیام های تریدر
فیلتر
نوع پیام
CoffeeshopCrypto
How To: Avoid paying Taxes on my Trading Gains?

حتماً این متن را به دقت مطالعه کنید. در انتهای این پیام، یک ایمیل آماده وجود دارد که میتوانید آن را برای حسابدار رسمی (CPA) و همچنین کارگزار (broker) دارای سرمایه خود ارسال کنید و سوالات درستی را برای شروع کار بپرسید. در ویدیوی بالا، فرآیند فکری و سوالاتی را که به صورت هفتگی از سوی بسیاری از افراد دریافت میکنم، با شما به اشتراک گذاشتم. میخواهم روشی را با شما در میان بگذارم که کاملاً به این بستگی دارد که کارگزار شما آن را ارائه میدهد یا خیر. مسئله: من از کارگزارم پرداختی دریافت میکنم، اما نمیخواهم مالیات آن را بپردازم. چه کار کنم؟ پاسخ: هیچ راهی برای اجتناب از پرداخت مالیات وجود ندارد، اما سوالاتی وجود دارد که باید از کارگزار خود (جایی که حساب دارای سرمایه دارید یا داشت) و همچنین از حسابدار رسمی خود (در صورت استفاده) بپرسید. این سوالات مشخص میکنند که آیا میتوانید «سودهای» خود را مستقیماً به یک حساب سرمایهگذاری منتقل کنید بدون اینکه مالیات بر درآمد (income tax) بپردازید یا خیر. به خاطر داشته باشید که نکته اصلی این است که اگر انجام این کار برای شما امکانپذیر باشد، به احتمال زیاد باید یک «نهاد» مانند LLC یا S-Corp برای خود ایجاد کنید. ----------------------------------------- آیا میتوان از طریق TradingView با استفاده از حساب دارای سرمایه معامله کرد؟ بله. اکثر شرکتهای پراپ (مانند Apex، My Funded Futures و غیره) از طریق سیستمهای مسیریابی شخص ثالث مانند Rithmic، CQG یا Tradovate، امکان دسترسی به TradingView را فراهم میکنند. آیا میتوان سودهای معاملاتی را مستقیماً به یک حساب سرمایهگذاری (به عنوان مثال، در Fidelity یا First Fidelity Trust) ارسال کرد؟ به طور مستقیم خیر. اکثر شرکتهای پراپ از طریق ACH / PayPal / انتقال وجه سیمی (Wire) به شما شخصاً پرداخت میکنند. این پرداخت به عنوان درآمد در نظر گرفته میشود، نه سود سرمایه - معمولاً فرم 1099 برای شما صادر میشود. بنابراین سودهای سرمایه کوتاهمدت در اینجا اعمال نمیشوند - این درآمد پیمانکاری است. آیا میتوان این وجوه را به یک حساب سرمایهگذاری یا بازنشستگی هدایت کرد؟ فقط به طور غیرمستقیم، اگر: یک نهاد حقوقی (LLC/S-Corp) ایجاد کنید شرکت پراپ اجازه پرداخت به آن نهاد را بدهد نهاد وجوه را به یک کارگزاری یا حساب بازنشستگی ارسال کند این به شما امکان میدهد: گزینههای مدیریت مالیات داشته باشید امکان تأمین مالی SEP IRA، Solo 401k یا سایر ابزارهای سرمایهگذاری را داشته باشید کسورات تجاری و ساختار درآمدی بهتری داشته باشید مهم: همه شرکتهای پراپ از این امر پشتیبانی نمیکنند. شما باید سوال کنید. اگر فقط پرداخت را به صورت شخصی دریافت کنید چه اتفاقی میافتد؟ شما باید مالیات درآمد آن سال را بپردازید. اگر مبلغ زیادی باشد و از هیچ استراتژی مالیاتی استفاده نکنید، این میتواند یک hit بزرگ باشد - و شما آن پول را در یک حساب بازنشستگی سرمایهگذاری کرد، که میتوانست بار مالیاتی را به تعویق بیندازد یا کاهش دهد. چرا معاملهگران میخواهند وجوه را به حسابهای سرمایهگذاری هدایت کنند؟ به منظور به تعویق انداختن مالیات به منظور compound سودها در محیطهای دارای مزیت مالیاتی به منظور جلوگیری از اینکه درآمد hit حساب چک شخصی آنها را مسدود کند و بلافاصله بدون ساختار مالیات بر آن وضع شود. به منظور جدا کردن درآمد تجاری از امور مالی شخصی. با چه کسی باید صحبت کنید؟ یک حسابدار رسمی (CPA) که پرداختهای شرکت پراپ + ساختار نهاد را درک میکند تیم پشتیبانی شرکت پراپ ارائهدهنده حساب سرمایهگذاری شما (به عنوان مثال، Fidelity، First Fidelity Trust) اگر از سرمایه خود استفاده میکنید (نه سرمایه شرکت پراپ) وقتی از یک حساب نقدی که با پول پس از مالیات خود تأمین مالی شده است معامله میکنید (مانند یک حساب شخصی در Tradestation، Fidelity، Interactive Brokers و غیره)، در مقایسه با یک حساب پراپ دارای سرمایه، در یک وضعیت مالیاتی کاملاً متفاوت قرار دارید. من با یک حساب نقدی معامله میکنم و این پول قبلاً مالیات داده شده است. چرا مالیات بیشتری میپردازم؟ 1. حق با شماست: آن پول قبلاً مالیات داده شده است اگر از طریق شغل، کسب و کار، فروش ارز دیجیتال یا هر چیز دیگری درآمد کسب کردهاید - و سپس حساب معاملاتی خود را با آن تأمین مالی کردهاید - بله، آن پول قبلاً به عنوان درآمد، سود سرمایه یا هر آنچه منبع اصلی لازم داشت، مالیات داده شده است. اما... 2. سودهای معاملاتی همچنان مشمول مالیات هستند - به طور جداگانه هنگامی که از آن پول مالیات داده شده برای تولید پول بیشتر از طریق معاملات استفاده میشود، آن سودها اکنون یک رویداد مالیاتی جدید هستند. دلیلش این است: IRS (سازمان امور مالیاتی آمریکا) از نظر دلار اصلی به «مالیات مضاعف» نگاه نمیکند - بلکه سود حاصل از آن دلار را مالیات میگیرد. به عنوان مثال: شما حساب خود را با 10000 دلار (که قبلاً مالیات داده شده است) تأمین مالی میکنید. شما آن را معامله میکنید و به 15000 دلار میرسانید. اکنون شما باید مالیات 5000 دلار سود را بپردازید، نه 10000 دلاری که با آن شروع کردید. بنابراین، نه، شما دو بار برای یک دلار مالیات نمیپردازید - شما برای درآمد جدیدی که از آن دلار به دست آمده است مالیات میپردازید. 3. نوع مالیات بستگی به دوره نگهداری دارد معاملات روزانه / کوتاهمدت (کمتر از 1 سال): به عنوان درآمد عادی مالیات میگیرد، همانند حقوق شما (میتواند 10-37٪ باشد) سودهای بلندمدت (1+ سال): با نرخ سود سرمایه بلندمدت مالیات میگیرد (به طور معمول 0٪، 15٪ یا 20٪) این فقط در صورتی اعمال میشود که شما در داخل یک حساب بازنشستگی (IRA، 401k و غیره) معامله نکنید. بنابراین مزیت هدایت سودها به یک حساب سرمایهگذاری چیست؟ اینجاست که مردم سعی میکنند زرنگ باشند. آنها میخواهند از تحقق سودها در حساب شخصی خود اجتناب کنند زیرا: ممکن است آنها را به یک براکت مالیاتی بالاتر برساند ممکن است پرداختهای مالیات تخمینی را فعال کند ممکن است آنها را از برخی اعتبارات مالیاتی محروم کند بنابراین ایده این است: "آیا میتوانم سودها را به جای دیگری (مانند IRA، تراست یا ابزار سرمایهگذاری) ارسال کنم تا اکنون مالیات ندهم؟" پاسخ: فقط اگر سودها از ابتدا در داخل آن حساب دارای مزیت مالیاتی به دست آمده باشند. شما نمیتوانید در یک حساب کارگزاری معمولی معامله کنید و سپس آن سودها را به یک IRA «منتقل کنید» تا مالیات را به تعویق بیندازید. پناهگاههای مالیاتی اینگونه کار نمیکنند - آنها فقط از سودهای به دست آمده در داخل آنها محافظت میکنند. آیا خود تأمین مالی وضعیت مالیاتی را تغییر میدهد؟ سناریو = شما معاملات را با دلار پس از مالیات تأمین مالی میکنید ---- دوباره برای آن پایه مالیات نمیگیرید سناریو = شما از معاملات سود تولید میکنید ---- بله، مالیاتهای جدید بر سودهای جدید سناریو = شما میخواهید از مالیات فوری اجتناب کنید ---- نمیتوانید مالیاتها را فقط با انتقال سودها به تعویق بیندازید سناریو = شما در داخل IRA/401k معامله میکنید ---- سودها به تعویق میافتند یا بدون مالیات هستند سناریو = شما از طریق یک شرکت پراپ معامله میکنید ---- مالیات بر درآمد، بدون سود سرمایه درگیر است ---------- در اینجا یک ایمیل برای شروع کار شما آورده شده است. این را برای حسابدار رسمی خود و کارگزار حساب دارای سرمایه خود ارسال کنید. ---------- سوالاتی که باید از شرکت پراپ خود بپرسید (در صورت استفاده از حسابهای دارای سرمایه) آیا اجازه میدهید پرداختها به یک نهاد حقوقی (LLC یا S-Corp) انجام شود؟ آیا میتوان پرداختها را به یک شرکت سرمایهگذاری یا متولی هدایت کرد؟ آیا میتوان حساب را به نام نهاد من نگه داشت؟ آیا فرم 1099s را برای پرداختهای نهاد صادر میکنید، یا فقط برای افراد؟ آیا محدودیتها یا هزینههایی برای مسیریابی پرداختها به یک حساب تجاری یا تراست وجود دارد؟
CoffeeshopCrypto
HOW TO: The right way to use the MACD
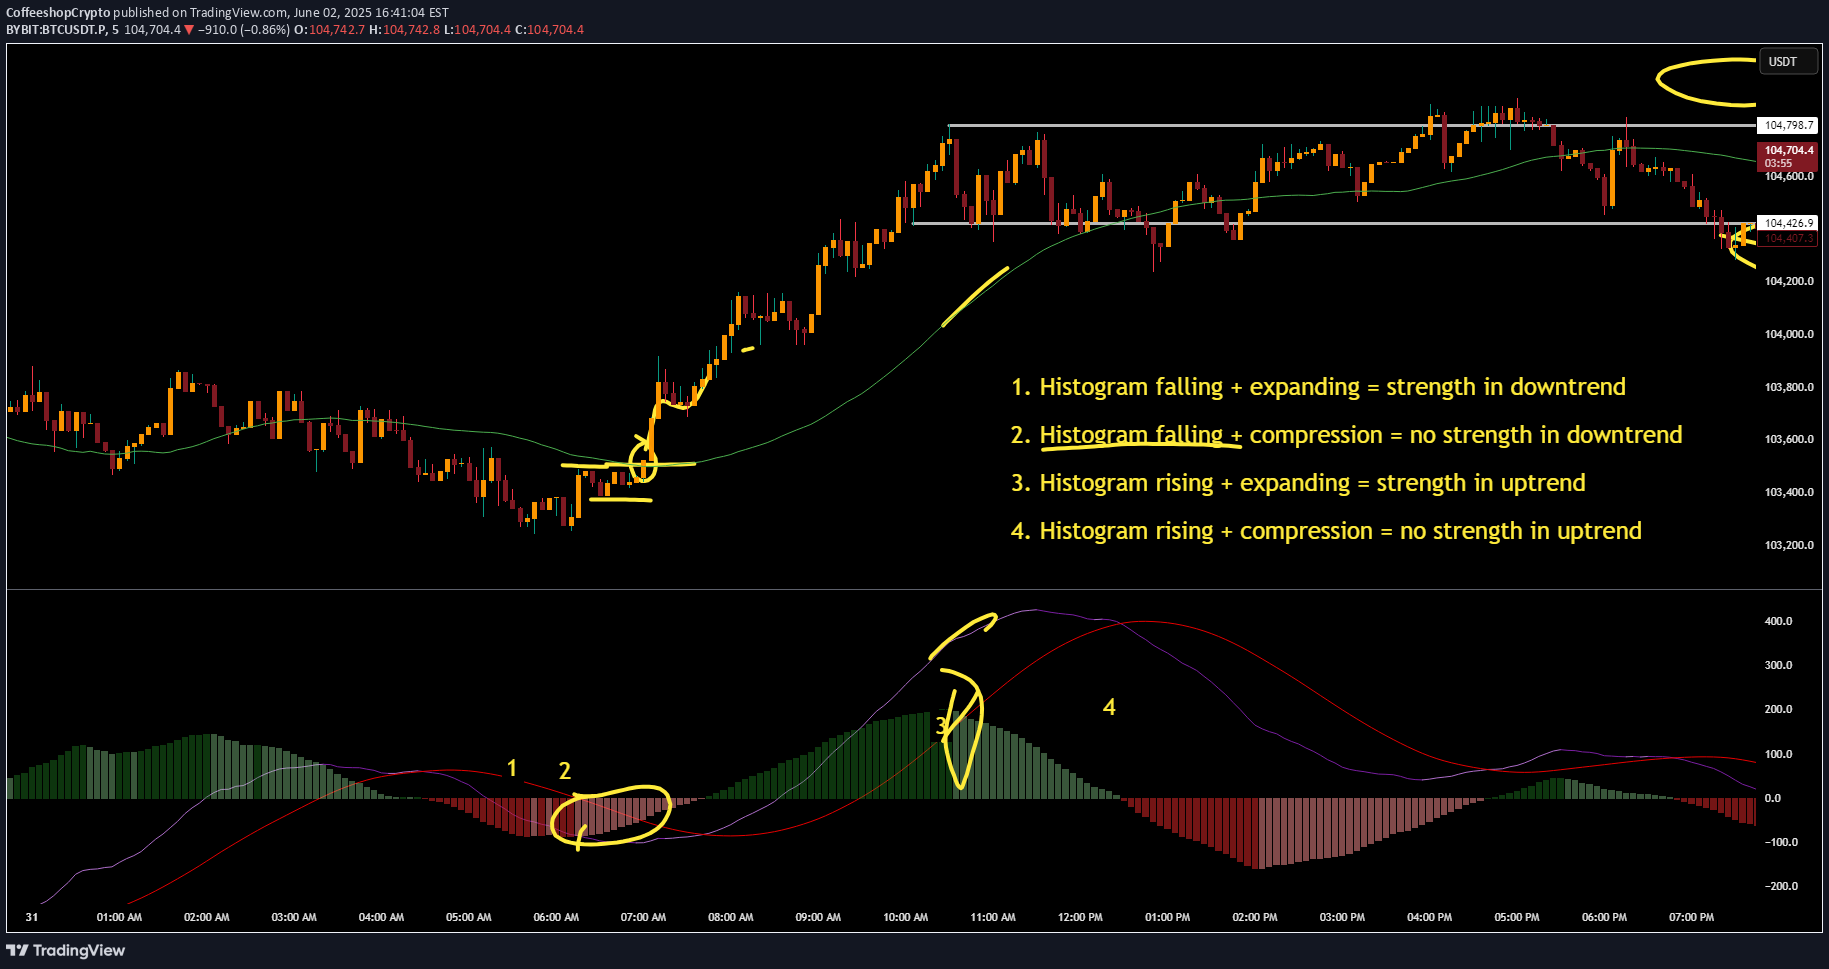
بسیاری از افراد به اشتباه از هیستوگرام MACD برای وارد کردن معاملات بدون اقدام به قیمت در متن استفاده می کنند. در این ویدیو قصد دارم به شما نشان دهم که چگونه می توانید هیستوگرام MACD را در میان بگذارید ، به چه معنی و چه زمانی به شما هشدار می دهد.
CoffeeshopCrypto
BTC Trading in Price Discovery Zones (Price analysis)

Bitcoin در کشف قیمت: درک و معامله در منطقه ناشناخته هنگامی که Bitcoin یا هر دارایی به بالاترین حد خود (ATH) می رسد، وارد مرحله ای می شود که به عنوان کشف قیمت شناخته می شود. در این مرحله، بازار بدون ارجاعات تاریخی به قیمت عمل میکند و در قلمروی ناشناخته برای تعیین ارزش منصفانه حرکت میکند. برای معامله گران و سرمایه گذاران، این یک فرصت و یک چالش است. استفاده از تکنیکهایی مانند تئوری موج الیوت و تجزیه و تحلیل پویاییهای قیمت و حجم میتواند به استراتژیبندی معاملات در این مرحله منحصر به فرد کمک کند. کشف قیمت چیست؟ کشف قیمت زمانی اتفاق میافتد که یک دارایی وارد سطوح قیمتی شود که قبلاً هرگز به آن نرسیده است - اغلب در ATH آن. بدون قبل از data برای مقاومت یا حمایت، بازار برای تعیین معیارهای قیمتی جدید به تقاضا، عرضه و سفته بازی متکی است. درک چگونگی واکنش قیمت در این مرحله نیاز به تجزیه و تحلیل کلان و خرد دارد. نظریه موج الیوت در کشف قیمت نظریه موج الیوت چارچوبی برای درک روانشناسی بازار و حرکات قیمت ارائه می دهد. در زمینه کشف قیمت، موج B تشکیل موج الیوت نقش محوری ایفا می کند: شناسایی مناطق موج B و Pullback موج B نشان دهنده عقب نشینی به یک محدوده پس از یک حرکت تکانشی به سمت بالا (موج A) است. اوج آن را مشخص کنید. حرکت تکانشی (A) و پایین عقب نشینی (B). این محدوده را در زمان به جلو پیش بینی کنید تا مناطق پشتیبانی بالقوه را شناسایی کنید. مناطق پشتیبانی در قیمت Discovery اوج قبلی (موج A) بالای ناحیه حمایت را تشکیل می دهد. موج B پایین پایین منطقه پشتیبانی را تشکیل می دهد. هنگامی که قیمت به این منطقه بازگشت، سیگنال آزمایش مجدد بالقوه پشتیبانی را می دهد و فرصت هایی را برای ورود مجدد ارائه می دهد. در روند. حفاری پایین: بازههای زمانی کوچکتر برای تأیید وقتی Bitcoin این مناطق پشتیبانی را مجدداً آزمایش میکند، برای ارزیابی واکنش قیمت و رفتار حجم، در بازههای زمانی کوچکتر بزرگنمایی کنید. به دنبال: تغییر صعودی در وضعیت تحویل باشید: این شامل اوجها و پایینهای بالاتر، افزایش حجم خرید، و الگوهای شمعدانی صعودی مانند شمعها یا شکلهای چکشی است. تأیید صدا: حجم قوی در حرکتهای رو به بالا و کاهش حجم در هنگام عقبنشینی نشاندهنده پایداری است. حرکت صعودی. در این مناطق حمایتی، در صورت بازار، احتمالاً قیمت روند صعودی خود را از سر گرفت. این نشانههای قدرت را نشان میدهد. مدیریت ریسک در مناطق کشف قیمت علیرغم تنظیمات صعودی، کشف قیمت بیثبات است و ممکن است شکستهای کاذب رخ دهد. برای محافظت از معاملات: مراقب شکافهای ارزش منصفانه (FVG) باشید. به دنبال شکافهای قیمتی بزرگ و پر نشده از مناطق مقاومت قبلی باشید. این شکافها ممکن است نشان دهنده مناطقی باشد که قیمت میتواند قبل از تأیید پشتیبانی عمیقتر شود. اگر قیمت به زیر حمایت اولیه رسید، ورودیها را تنظیم کنید و ضرر را متوقف کنید. منطقه (بالای موج A)، ممکن است پایین موج B را برای تثبیت بیشتر دوباره آزمایش کند. پایین موج B برای محافظت در برابر معکوسهای غیرمنتظره. ارزیابی حرکتهای مبتنی بر حجم. حجم ضعیف در طول آزمایش مجدد میتواند نشاندهنده تقاضای ناکافی برای حمایت از قیمت باشد، که نشان میدهد عقبنشینی یا برگشت عمیقتر محتملتر است.------------- --------------- کشف قیمت یکی از هیجان انگیزترین و با ارزش ترین مراحل برای معامله گرانی است که می دانند چگونه به آن نزدیک شوید. با استفاده از تئوری امواج الیوت، میتوانید مناطق پشتیبانی کلیدی را مشخص کنید، بهویژه در اطراف عقبنشینیهای موج B، و سپس تنظیمات خود را با تجزیه و تحلیل عملکرد قیمت و حجم تأیید کنید. نکته کلیدی در اینجا صبر و دقت است. اجازه دهید قیمت به مناطق حساسی که علامتگذاری کردهاید برسد، نحوه واکنش آن را تماشا کنید و با اطمینان حرکت خود را انجام دهید. با این حال انعطاف پذیر باشید – کشف قیمت غیرقابل پیش بینی است و اگر می از این مرحله با پتانسیل بالا در سفر بیت کوین حداکثر استفاده را ببرید، مدیریت ریسک بسیار مهم است.
CoffeeshopCrypto
How to trade using the CSC-HARSI "The Real Way"

به کافی شاپ خوش آمدید این میزبان شما و باریستا اریک است. این پادکست برای آموزش تحلیل تکنیکال که باید بدانید طراحی شده است تا بتوانید در تلاش های کریپتو خود از معاملات نادرست خودداری کنید. این پلتفرمی است که میتوانم ویرایشهای خود را از شاخصهای محبوب منتشر کنم. من به شما نشان داد که چگونه از آنها استفاده کنید، و البته گاهی اوقات استراتژی های بسیار بدی را مطرح می کنم زیرا نمی شما بچه ها اطلاعات بدی داشته باشید. با خیال راحت این محتوا را در جایی که انتخاب می کنید به اشتراک بگذارید و البته در دام کلاهبرداری قرار نگیرید. من به صورت آنلاین به شما مراجعه نمی کنم و از شما برای وام دارایی های رمزنگاری یا هر نوع حمایت مالی از شما درخواست نمی کنم. اما به خاطر داشته باشید که این به این معنی نیست که من دوست ندارم با شما صحبت کنم زیرا هر از گاهی پیامی از من پیدا می کنید که می گوید سلام وقتی آنها می به شما نزدیک شوند چگونه رفتار می کنید. بنابراین مدتی است که CSC-HARSI منتشر شده است و فکر می کنم وقت آن رسیده است که یک ویدیوی سریع از یک ورودی و خروجی برای خرید و فروش روی این اندیکاتور انجام دهم. ده ها نفر از شما در هفته درخواست کرده اند و من دیده ام. all of the videos online on the improper way to use the old version of this indicator. از آنجایی که نسخه جدید منتشر شده است و اساساً در حالت beast کار می کند، از شما بچه ها می که از حداکثر پتانسیل خود استفاده کنید. ویدیوی امروز مبتنی بر استفاده از VWAP به عنوان میانگین متحرک در برابر RSI است. پس بیایید درست وارد عمل شویم و شروع کنیم. ادامه دهید و نمودار و نمای معاملاتی خود را باز کنید جستجوی rCSC-HARSI یا "Coffeeshopcrypto" نشانگر را به نمودار خود اضافه کنید و تنظیمات پیش فرض را در چرخ تنظیمات باز نگه دارید و به برگه ورودی ها بروید و به تنظیمات میانگین متحرک RSI بروید و نوع ma را تغییر دهید. به vwap.خوب همین است که شما آماده هستید و حالا بیایید در مورد قوانین یک معامله طولانی و کوتاه صحبت کنیم. همانطور که با هر نمودار و هر روزی که می تجارت خود را شروع کنید اولین کاری که انجام می دهید این است. شما سطح حمایت و مقاومت خود را تعیین می کنید. من شخصاً این کار را در نمودار 4 ساعته انجام می دهم. توصیه میکنم زمانی که نمودار خود را در بازه زمانی 1 تا 2 * بالاتر از زمانی که استفاده میکنید، سطح حمایت و مقاومت خود را در ابتدا تنظیم کنید. به عنوان مثال، من معاملات خود را بر روی یک نمودار 1 ساعته انجام می دهم، بنابراین سطوح حمایت و مقاومت من معمولاً در نمودار 4 ساعته تنظیم می شود. شما می توانید این کار را با نگاه کردن به نقاط شدید نوسان قیمت در نمودار خود انجام دهید و فقط یک سطح را در بالا و سطح دیگری در پایین قرار دهید. از استوکاستیک در اندیکاتور. مقیاس سمت راست نشانگر عمدتاً برای استوکاستیک طراحی شده است تا به شما بگوید چگونه hard چیزها روی gas فشار می آورند. به عبارت دیگر اگر استوکاستیک از صفر تا 50 باشد تقریباً هیچ حرکتی در قیمت وجود ندارد. با این حال، هنگامی که استوکاستیک هر کاری بالاتر از 50 تا 100 انجام دهد، هر چه به 100 نزدیکتر باشد، نیروی بیشتری در بازار وجود دارد. باید به یاد داشته باشید که RSI Stochastic به گونهای طراحی شده است که RSI سریعتر باشد. بنابراین اگر استوکاستیک سبز "Bullish" باشد و به سمت بالای 70 حرکت کند، نیروی زیادی به سمت بالا رفت. اگر قرمز "نزولی" باشد و زیر 50 نیروی زیادی به سمت نزول وجود دارد. هر چه به صفر نزدیکتر باشد، نیروی بیشتری وجود دارد. استراتژی که من برای ورود و خروج با استفاده از این نشانگر استفاده کردم، تحت این قوانین خاص قرار میگیرد: ShORTS:1. استوکاستیک باید در یک روند نزولی باشد. RSI باید کمتر از میانگین متحرک خود باشد.3. RSI باید زیر 50 باشد 4. شمع های Heikin Ashi باید قرمز باشند. 5. شمع Heikin Ashi باید بالاتر از میانگین متحرک باز شود و زیر میانگین متحرک بسته شود. 6. بهینه ترین حرکت زمانی است که شمع بالای 60 باز شود و در حالی که از میانگین متحرک عبور کند زیر 60 بسته شود. یک جایگزین برای قانون شش این است. اگر شمع شما بالاتر از 50 و بالاتر از میانگین متحرک باز می شود اما بسته به طور همزمان زیر هر دوی آنها است، این نیز یک ورودی است. اکنون بدیهی است که قوانین برای قرار گرفتن در پوزیشن های طولانی دقیقا برعکس است. اول از همه، همیشه به سطوح حمایت و مقاومتی که از قبل تعیین کرده اید نگاهی بیندازید. دومین چیز این است که میانگین های متحرک خود را بررسی کنید. من معمولاً از میانگین متحرک 50 و 100 استفاده می کنم. اگر از تایم فریم های اسکالپینگ استفاده می کنید که از 30 دقیقه و کمتر است، پیشنهاد می کنم از میانگین متحرک 20 دوره و میانگین متحرک 50 دوره استفاده کنید. قوانین موقعیت های بلند: 1. استوکاستیک باید در یک روند صعودی باشد.2. RSI باید بالاتر از میانگین متحرک خود باشد.3. RSI باید بالای 504 باشد. شمع های Heikin Ashi باید سبز باشند.5. شمع Heikin Ashi باید زیر میانگین متحرک باز شود و بالاتر از میانگین متحرک بسته شود.6. بهینه ترین حرکت زمانی است که شمع زیر 40 باز می شود و در حالی که از میانگین متحرک عبور می کند بالای 40 بسته می شود. جایگزین قانون شش است. اگر شمع شما زیر 50 و بالاتر از میانگین متحرک باز می شود اما بسته شدن همزمان بالای هر دوی آنها است، این نیز یک ورودی است.
CoffeeshopCrypto
BTC support @ 20,700. Will reclaim 21,500

فقط یک بهروزرسانی سریع در BTC برای هر کسی که صعودی است. اکنون در موقعیتی قرار بگیرید که میخواهید یک سفارش خرید محدود را روی 20,700 دلار تعیین کنید. سپس سود برداشت را روی 21,500 دلار تعیین کنید. ما در حال حاضر در یک خط مسطح هستیم که قیمتها تقریباً به طور مساوی بین آنها مطابقت دارد. خرسها و گاوهای نر. افزایش جزئی در محدوده قیمت وجود دارد، اما به طور کلی خرسها کنترل این منطقه تجمیع را در دست دارند.
CoffeeshopCrypto
6 month prediction on BTC bottom achieved

#BITCOIN در پایینترین حد خود قرار دارد. (در واقع در حال حاضر در حال از دست دادن سرعت است) من فقط میخواستم این پیام سریع را ارسال کنم که نمودار را نشان میدهد. شما میخواهید هر روز بزرگنمایی کنید تا زمانی که بتوانید قبل از دسامبر 2021 ببینید که در آن من کجا هستم. وارد یک موقعیت کوتاه شد. فردا بعدازظهر میخواهم ویدیویی در مورد این حرکت ضبط کنم. چگونه آن را 6 ماه پیش پیشبینی کردم. فرمول tge RSI که خروجی را به من میگوید. چگونه fibbonacci برای تأیید حرکت قرار گرفت. و قطعات میانگین متحرک MASS EFFECT من که به من می گوید: الف) روند نزولی BTC به پایان رسیده است. ب) حرکت در چه سطحی در C از دست داده است) منطقه ای که باید از آن عبور کند، قبل از اینکه دوباره بخرید، چیست. اگر شما بودید، در این مرحله، من Bitcoin را کوتاه نمی کردم. این ایده را به اشتراک بگذارید. من واقعاً میخواهم به LIVE بروم و با شما بچههایی که ممکن است در محل سؤالی داشته باشند، بحث کنم.
CoffeeshopCrypto
$ETH is ready for a bull move

در حال حاضر ETH در محدوده 1120 تا 1150 دلار قرار دارد. من شخصاً شاهد حرکت گاو نر به 1206 دلار هستم قبل از اینکه مومنتوم از بین برود یا این کاهش سرعت بعدی است. می توانم بیشتر پیش بینی کنم اما نمی آنقدر منتظر بمانم. یک معامله. من قبلاً ورودی خود را با 1102 دلار با اهرم 3 برابری در kucoin شروع کردهام، این یک حرکت صعودی 9.54 درصدی است، بنابراین من به آن پایبند هستم. ورود 1102 دلار خروج از 1206 دلار Stoploss 1096 دلار اما نیازی به این نیست که آنقدر پایین باشد.
CoffeeshopCrypto
$ETH moving on a pullback to $1260 (watch it fall)

من در حال آزمایش اندیکاتور جدیدی هستم که ساختهام و کار بسیار خوبی انجام میدهد و به من نشان میدهد که روند عقبنشینی، و همچنین ادامه دارد. من این را به زودی با دعوت فقط برای آزمایش به صورت عمومی منتشر کرد. آن را در نمودار روزانه در مقابل #Eth بررسی کنید، به نظر می رسد من حدود 20 ساعت زودتر برای عقب نشینی هستم، اما با توجه به تعامل میانگین های متحرکی که برای این کار ساخته ام، روند به اندازه کافی کاهش یافته است که به این معنی است که حجم نیز کاهش می یابد. .Price نیز برای بستن بالای نوار اکشن قیمتی که من ایجاد کردهام در صف است. این به معنای یک روند صعودی کوتاه در روند نزولی اصلی است (کشش) در Atthispoimt من با 1:1 حرکت میکنم، زیرا این امر اساساً در چرخش (تقاطع) روبان من و چرخش همزمان RSI تصادفی اتفاق میافتد. پس از این حرکت کامل شد، من انتظار دارم که همچنان به 530.00 دلار کاهش یابد.
CoffeeshopCrypto
Dont let the rally fool you. RSI predicted a 120 day trade 100%.

نکات کلیدی BTCUSDT در اینجا باید جستجو شود:[RSI رسمی برای ورود و خروج دقیق][RSI دقیقاً به شما میگوید که حرکت تا کجا پیش رفت[اجازه ندهید این رالی اخیر شما را گول بزند] برای ورود به معامله و استفاده از این فرمول، من به اولین فرمول نیاز داشتم. شمع برای بستن زیر میانگین متحرک #EMA 50 روزه و همچنین بسته شدن زیر 50 در RSI. این در 16 نوامبر اتفاق افتاد. من به احتمال زیاد در روز بعد بسته میشوم تا زمانی که هنوز در RSI زیر 50 باشد. در پایان 17 نوامبر، این اتفاق افتاد. بنابراین در اینجا این است که چگونه بازی کرد. RSI، 16 نوامبر بسته شد، اولین RSI زیر 50 بود. در 44.75 نوامبر بسته شد، RSI بسته شدن هفدهم نیز زیر 50 بود. در 45.55 بسته شد! آخرین RSI را در نظر داشته باشید. ما برای فرمول به آن نیاز داریم. دقیقاً به ما می گوید که چقدر باید سود برداشت را تعیین کنیم. در این مرحله من کارهای زیر را انجام دادم: 1. ورود من را در افتتاحیه روز بعد (18 نوامبر) 2 قرار دهید. استاپ ضرر را در نوسان اوج 10 نوامبر تنظیم کنید. که اتفاقاً جایی است که "Bear" #WilliamsFractal ظاهر می شود. این جدیدترین Swing High.3 است. من به ارزش پایانی #RSI در 17 نوامبر نگاه کردم. [45.55] 4. فرمول RSI من را انجام دادم، که برای این نوشتار کاملاً مناسب است: تنظیم خرس: 50 - 41 RSI = نسبت 1:3. اما هنوز باید اعشار و اعداد تک رقمی را اضافه کنید. این RSI 45.55 بود. این عدد به 40 و 5.5 تقسیم می شود (آخرین عدد را حذف کردم) بله، می دانم، درست به نظر می رسد دیوانه کننده است؟ RSI 50 - 40 برابر با نسبت 1:3 است. بنابراین این همان چیزی است که برای نسبت خود نیز استفاده می کنید. اگر 40 به شما 1:3 بدهد و شما 5.5 را اضافه کنید، 1: 3.55 دریافت می کنید (در ابزار SHORT شما به نسبت 1 به 3.55 نشان داده می شود) ابزار خود را روی ورودی خود تنظیم کنیدStoploss به آن سود بالا بردن نوسان می رود به 3.55 حالا اگر به نمودار پیوست نگاه کنید، می بینید که کندل برداشت سود دقیقاً در آخرین کندل قبل از تثبیت قیمت است. این اولین شمع است که در آن قیمت در منطقه ای با فروش بیش از حد در 11 می باز شد و بسته شد. حرکت بیش از 120 روزه با افزایش 52.5 درصدی بدون قیمت گذاری حتی نزدیک به حد ضرر. این همه بر اساس یک نشانه واحد بود که من از RSI و یک فراکتال به دست آوردم. اجازه ندهید رالی شما را گول بزند (چاپ Luqidity) نکته آنچه را که در اینجا می سازم این است که باید فرمولی را که RSI به شما می گوید انجام دهید بدانید. از این حدس زدن نسبت 1:1.5 یا 1:2 دست بردارید و به ریاضیات اعتماد کنید. احساسات بازار و رسانههای خبری را کنار بگذاریم، ریاضیات دروغ نمیگویند... EVER. من فکر میکنم مقالات و وبسایتهای دیگری اخباری را ارسال میکنند که میگویند "HEY BTC در حال افزایش است." سپس آنها مانند "اوه نه، 150 متر در موقعیت منحل شدند، زیرا مردم به سمت تجمع پریدند." خب بله، همه این فعالیت هایی که در 30 می و 1 ژوئن انجام شد یک برداشت نقدینگی بود. اجازه ندهید این دست انداز شما را فریب دهد. قیمت کاهش نمییابد. هفتهها پیش (25 آوریل) من در تحلیلی BTC دیگران پست کردم که آنها اشتباه میکردند و BTC بر اساس فرمول من و سیگنال RSI به حدود 30 هزار کاهش مییابد. آنها اصرار داشتند که به دلیل بسته شدن یک شمع صعودی یک روزه، صعودی شود، اما روز بعد، 26 آوریل، شمع نزولی در حال غرق شدن بود که همه چیز را خورد. چیزی که آنها متوجه نشدند این بود که RSI تصادفی در یک روند نزولی قرار داشت، اما هنوز در آستانه شکستن به زیر سطح 50 در RSI با باندهای گسترده خوب است. شرم شرم شرم است. نکته آخر این است. فرمول RSI خود را دنبال کنید. من باید تصویری از نحوه کار آن پست کنم زیرا انجام آن در تایپ، عدالت کافی به آن نمی دهد. من در واقع از RSI خود با سطح صفر در مرکز استفاده می کنم تا کارها را آسان تر کنم. بنابراین 1-10 = 1: 3 نسبت 10-20 = 1 : 4 نسبت 20 - 30 = 1 : 7 نسبت 30 - 40 = 1 : 8 معمولاً بعد از این مرحله، یا بیش از حد خرید یا بیش از حد فروش می شود و شما نباید وارد معامله شوید، حتی با ضررهای بعدی. ده ها مکان RSI خود را بالا ببرید. اگر هر رقمی تک رقمی دارید (1 - 9) فقط آنها را به انتها اضافه می کنید. اگر اعداد اعشاری دارید، مکان 100 را رها کرده و اعشار را روی آن جابه جا می کنید. ExampleRSI = 55.75فرمول برابر است ( 1 : 3.75 )RSI = 38.29Formual = 1: 4.71 این فرمول کل حرکت را کمتر از شتاب در پایان حرکت به شما می دهد. می توانید از این برای پیدا کردن پایین ترین نقطه در تاب با هر اندازه ای استفاده کنید. یکی از نکات مهم این است که همه شما MAS باید در فاصله یکسانی از یکدیگر قرار داشته باشند و نه در یک روند صعودی یا نزولی. آنها باید تقریباً FLAT باشند. سؤالات مربوط به فرمول، لطفاً در زیر بپرسید.
CoffeeshopCrypto
XRP to drop over 12%

tradingview.com/x/ylUowyhp/به کافه شاپ خوش آمدید همه افراد رمزنگاری شده، این برای شما سریع بود xrp اگر به نموداری که من دارم نگاهی بیندازید حدود 12 و نیم درصد کاهش یافت. در زیر با خیال راحت ادامه دهید و مستقیماً در حساب آزمایشی خود کپی کنید و آن را برای خودتان آزمایش کنید، فرمولی وجود دارد که من برای RS I استفاده می کنم که شروع تا پایان دقیق حرکت را به من می گوید اکنون این یک معامله چند روزه است. احتمالاً من آن را یک معامله نوسانی نمی نامم، این می تواند خیلی سریع اتفاق بیفتد، بنابراین اجازه دهید بیانیه آخر را دوباره بیان کنم. این یک حرکت معاملاتی روزانه در نمودار زمانی 1 ساعته است و من این کار را با RSI تنظیم شده 14 یک چوب چسبیده روی 200 انجام میدهم و من به نمایشگر تقسیم صفحه نمایش شمعهای هایکن آشی و قیمت عمل میکنم. شمع های معمولی شمع های چینی، بنابراین ما در یک روند نزولی هستیم، این یک حرکت نزولی است و من قصد ندارم حرکت کنم، اما اگر می آزمایش کنید که فرمول من برای RSI روی حساب آزمایشی شما کار می کند، می توانید این کار را انجام دهید تا جایی که من میتوانم RSی را که میزدم در حدود 55.41 ببینم، فکر میکنم 54.4 + بود که به من میگوید که r s من باید همان باشد که پاداش ریسک من باید در 1 به 4.5 یا 1 تا 4.3 باشد، چیزی شبیه به من. در حال حاضر آن صفحه را در front از من ندارید، اما خیالتان راحت باشد و فقط معاملات را در تعداد دمو خود کپی کنید. اگر برای شما خوب بود، لطفاً برگردید و نظر دهید که همه چیز خوب است، و من به شما نشان داد که چگونه وارد این فرمول شوید. من مشکلی برای انجام آن ندارم. با این حال، من در آینده خیلی زود ویدیویی را تنظیم کرد که فرمول و مراحل مختلف زمانی که شما 1 به 2، 1 تا 3، 1 به 4، 1 تا 8، 1 تا 10 و 1 تا 12 را در مورد پاداش ریسک خود نشان می دهد را نشان می دهد. بر اساس آنچه RSI شما به شما می گوید. فعلاً همین است. نظرات خود را در زیر بنویسید. اگر میتوانید موسیقی را در پسزمینه بشنوید، به این دلیل که این برنامه توسط radio.com ضد FM حمایت میشود و این رمزنگاری کافیشاپ است.
سلب مسئولیت
هر محتوا و مطالب مندرج در سایت و کانالهای رسمی ارتباطی سهمتو، جمعبندی نظرات و تحلیلهای شخصی و غیر تعهد آور بوده و هیچگونه توصیهای مبنی بر خرید، فروش، ورود و یا خروج از بازارهای مالی نمی باشد. همچنین کلیه اخبار و تحلیلهای مندرج در سایت و کانالها، صرفا بازنشر اطلاعات از منابع رسمی و غیر رسمی داخلی و خارجی است و بدیهی است استفاده کنندگان محتوای مذکور، مسئول پیگیری و حصول اطمینان از اصالت و درستی مطالب هستند. از این رو ضمن سلب مسئولیت اعلام میدارد مسئولیت هرنوع تصمیم گیری و اقدام و سود و زیان احتمالی در بازار سرمایه و ارز دیجیتال، با شخص معامله گر است.