
CRYPTOMOJO_TA
@t_CRYPTOMOJO_TA

تریدر چه نمادی را توصیه به خرید کرده؟
سابقه خرید
تخمین بازدهی ماه به ماه تریدر
پیام های تریدر
فیلتر
نوع پیام
CRYPTOMOJO_TA
CRV شکست خط روند نزولی: آیا زمان پرواز فرا رسیده است؟

روند نزولی تازه شکسته شده است. این همان نقطهای است که معمولاً حرکتهای بزرگ از آنجا شروع میشوند. 👀 اگر تثبیت شکست صورت بگیرد، پرواز کرد. 🚀
CRYPTOMOJO_TA
شکست خط روند FET: آیا قیمت به ۰.۴۰ دلار میرسد؟

FET بالاخره خط روند را شکست. 🚀 ما پشتیبانی را تغییر دادیم، EMA ها به سمت بالا برگشتند، و خریداران در حال بازگشت هستند. تا زمانی که قیمت بالاتر از این شکست باقی بماند، قیمت صعودی به سمت 0.35 تا 0.40 دلار روی میز است. حرکت در حال ساخت است. 👀
CRYPTOMOJO_TA
دوج کوین ترکید! آیا این روند صعودی جدید است؟ (هدف بعدی ۰.۱۵ دلار)

#DOGE به تازگی منتشر شد. 🚀 روند نزولی در نهایت به پایان رسید و حرکت به سمت صعودی حرکت می کند. تا زمانی که قیمت بالاتر از شکست باقی بماند، 0.15 دلار هدف بعدی است. قوی به نظر می رسد. 👀
CRYPTOMOJO_TA
نقطه عطف حیاتی SUI: آیا اوج میگیرد یا سقوط میکند؟
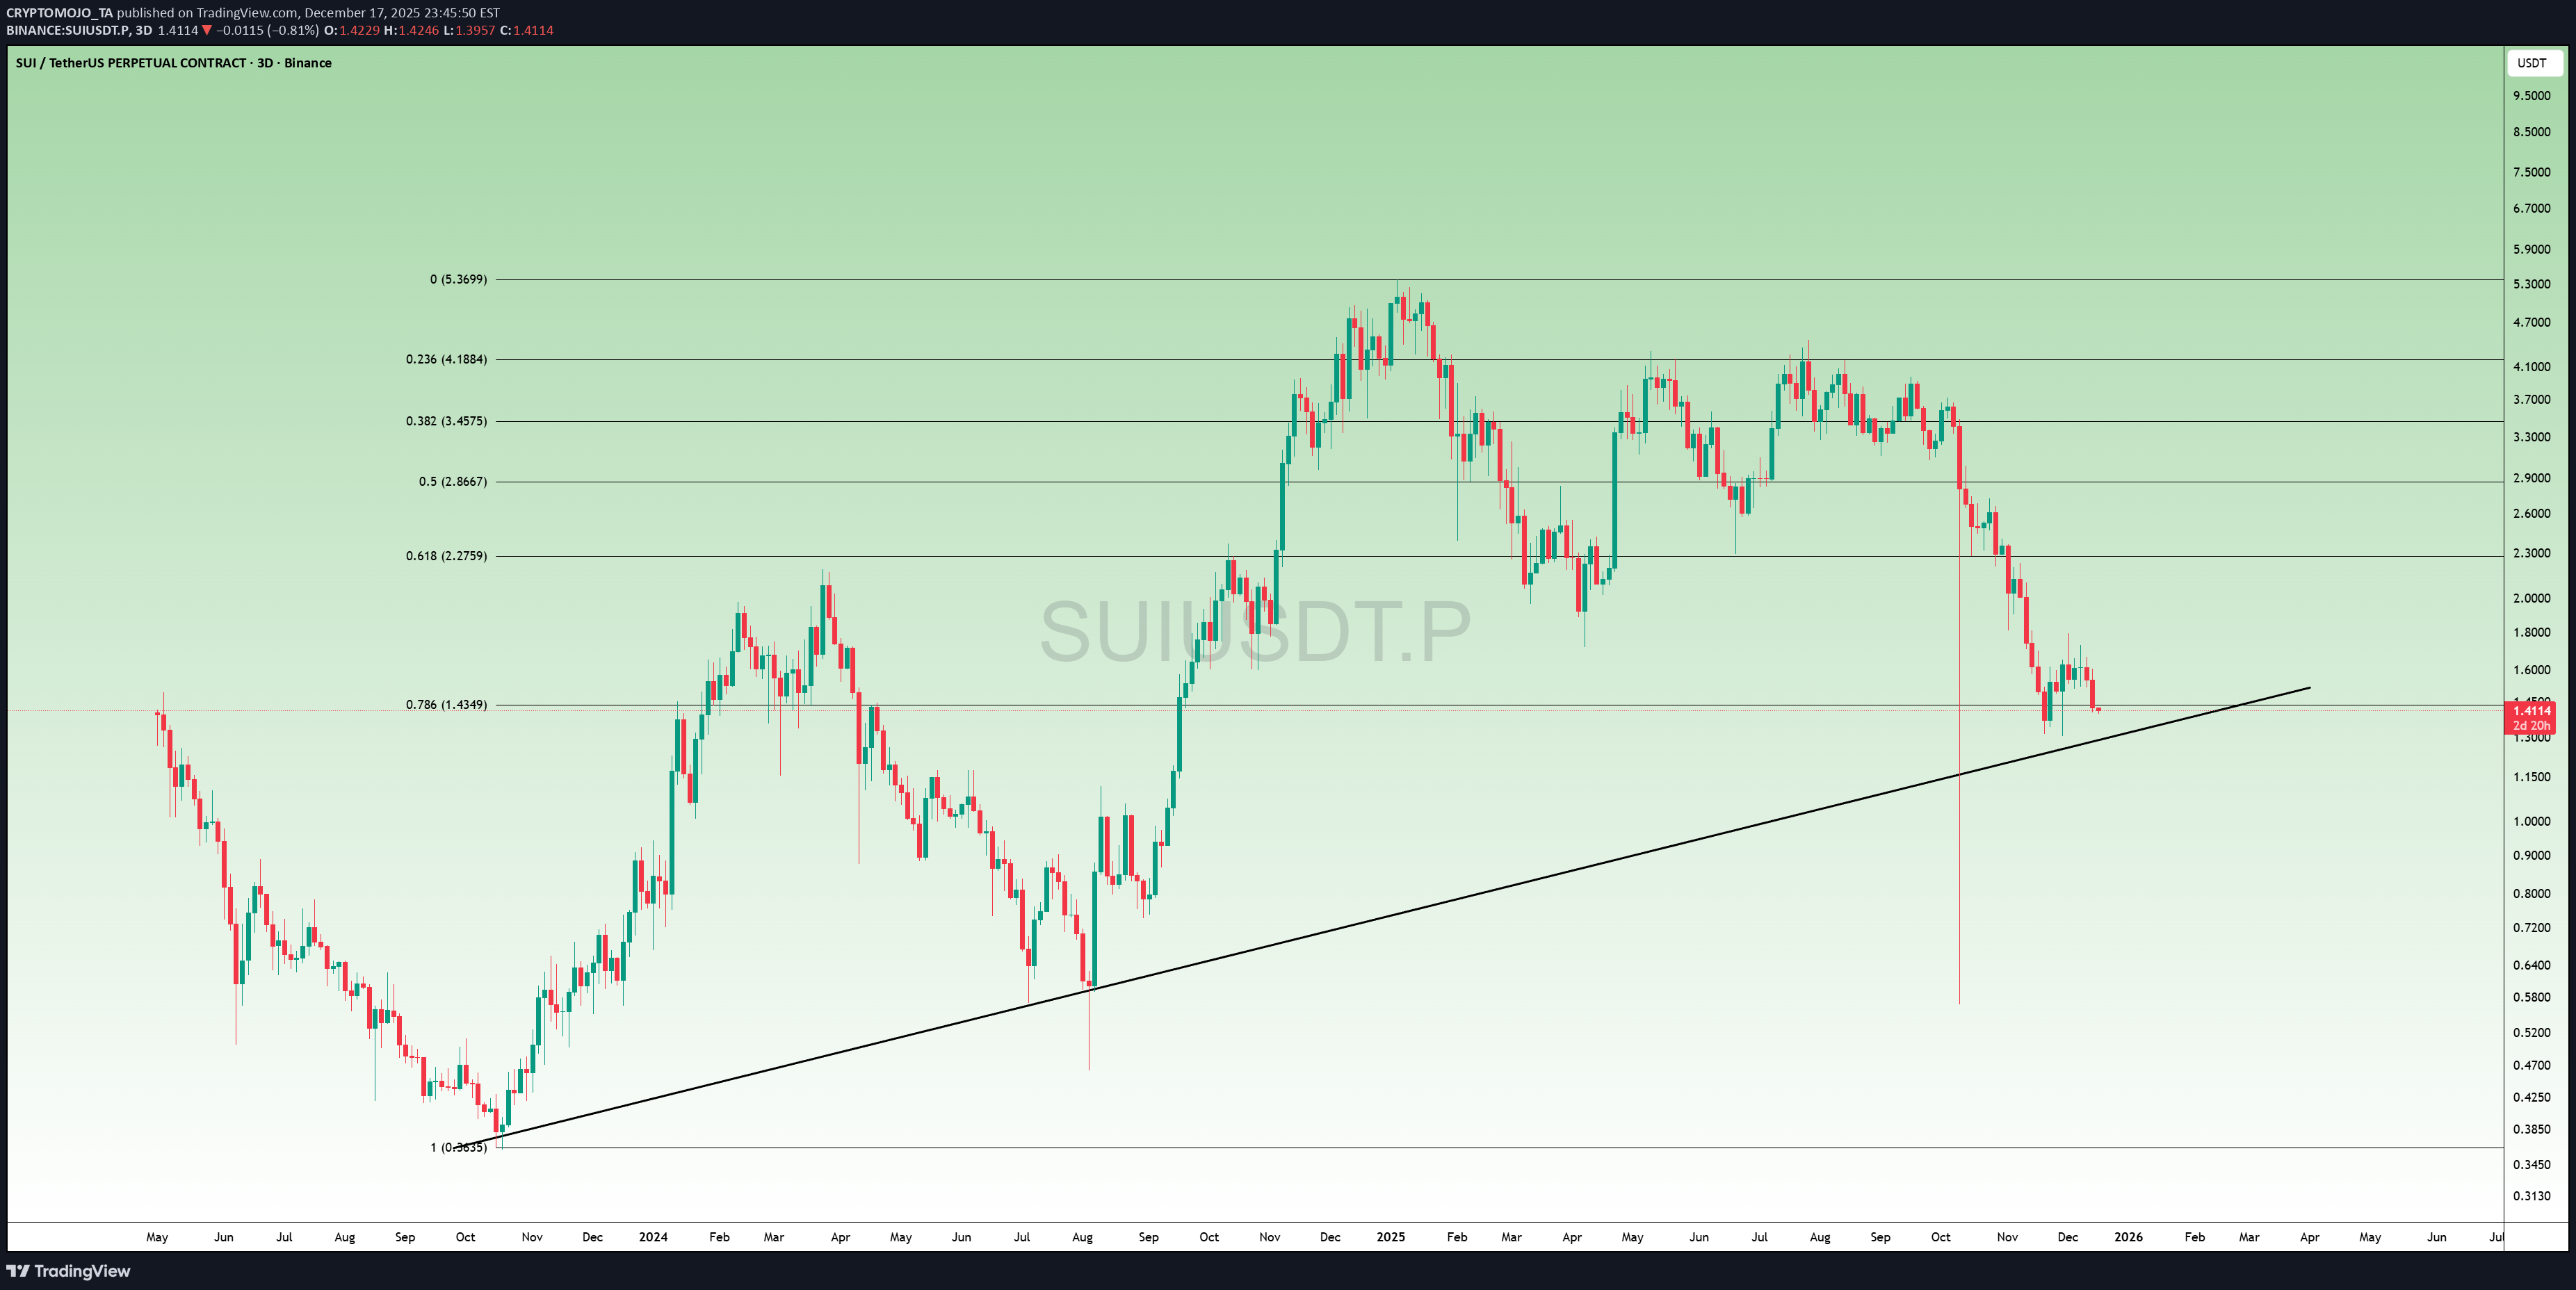
#SUI اکنون در یک خط روند بلندمدت major نشسته است، سطحی که از زمان راه اندازی حفظ شده است. 👀 هر بار که قیمت این خط روند را لمس کرد، SUI یک move قوی را شروع کرد. ما دوباره به اینجا برگشتیم ... درست در پشتیبانی + نزدیک منطقه 0.786 Fib. اگر خریداران وارد عمل شوند، جهش به سمت 2.2 دلار → 2.8 دلار هدف کلیدی بعدی است. اگر این سطح بشکند، تنها در این صورت است که ما پایین تر به نظر می رسیم. لحظه بزرگ برای SUI. هوشیار باشید #رمز
CRYPTOMOJO_TA
Calm Before the SOL Breakout!
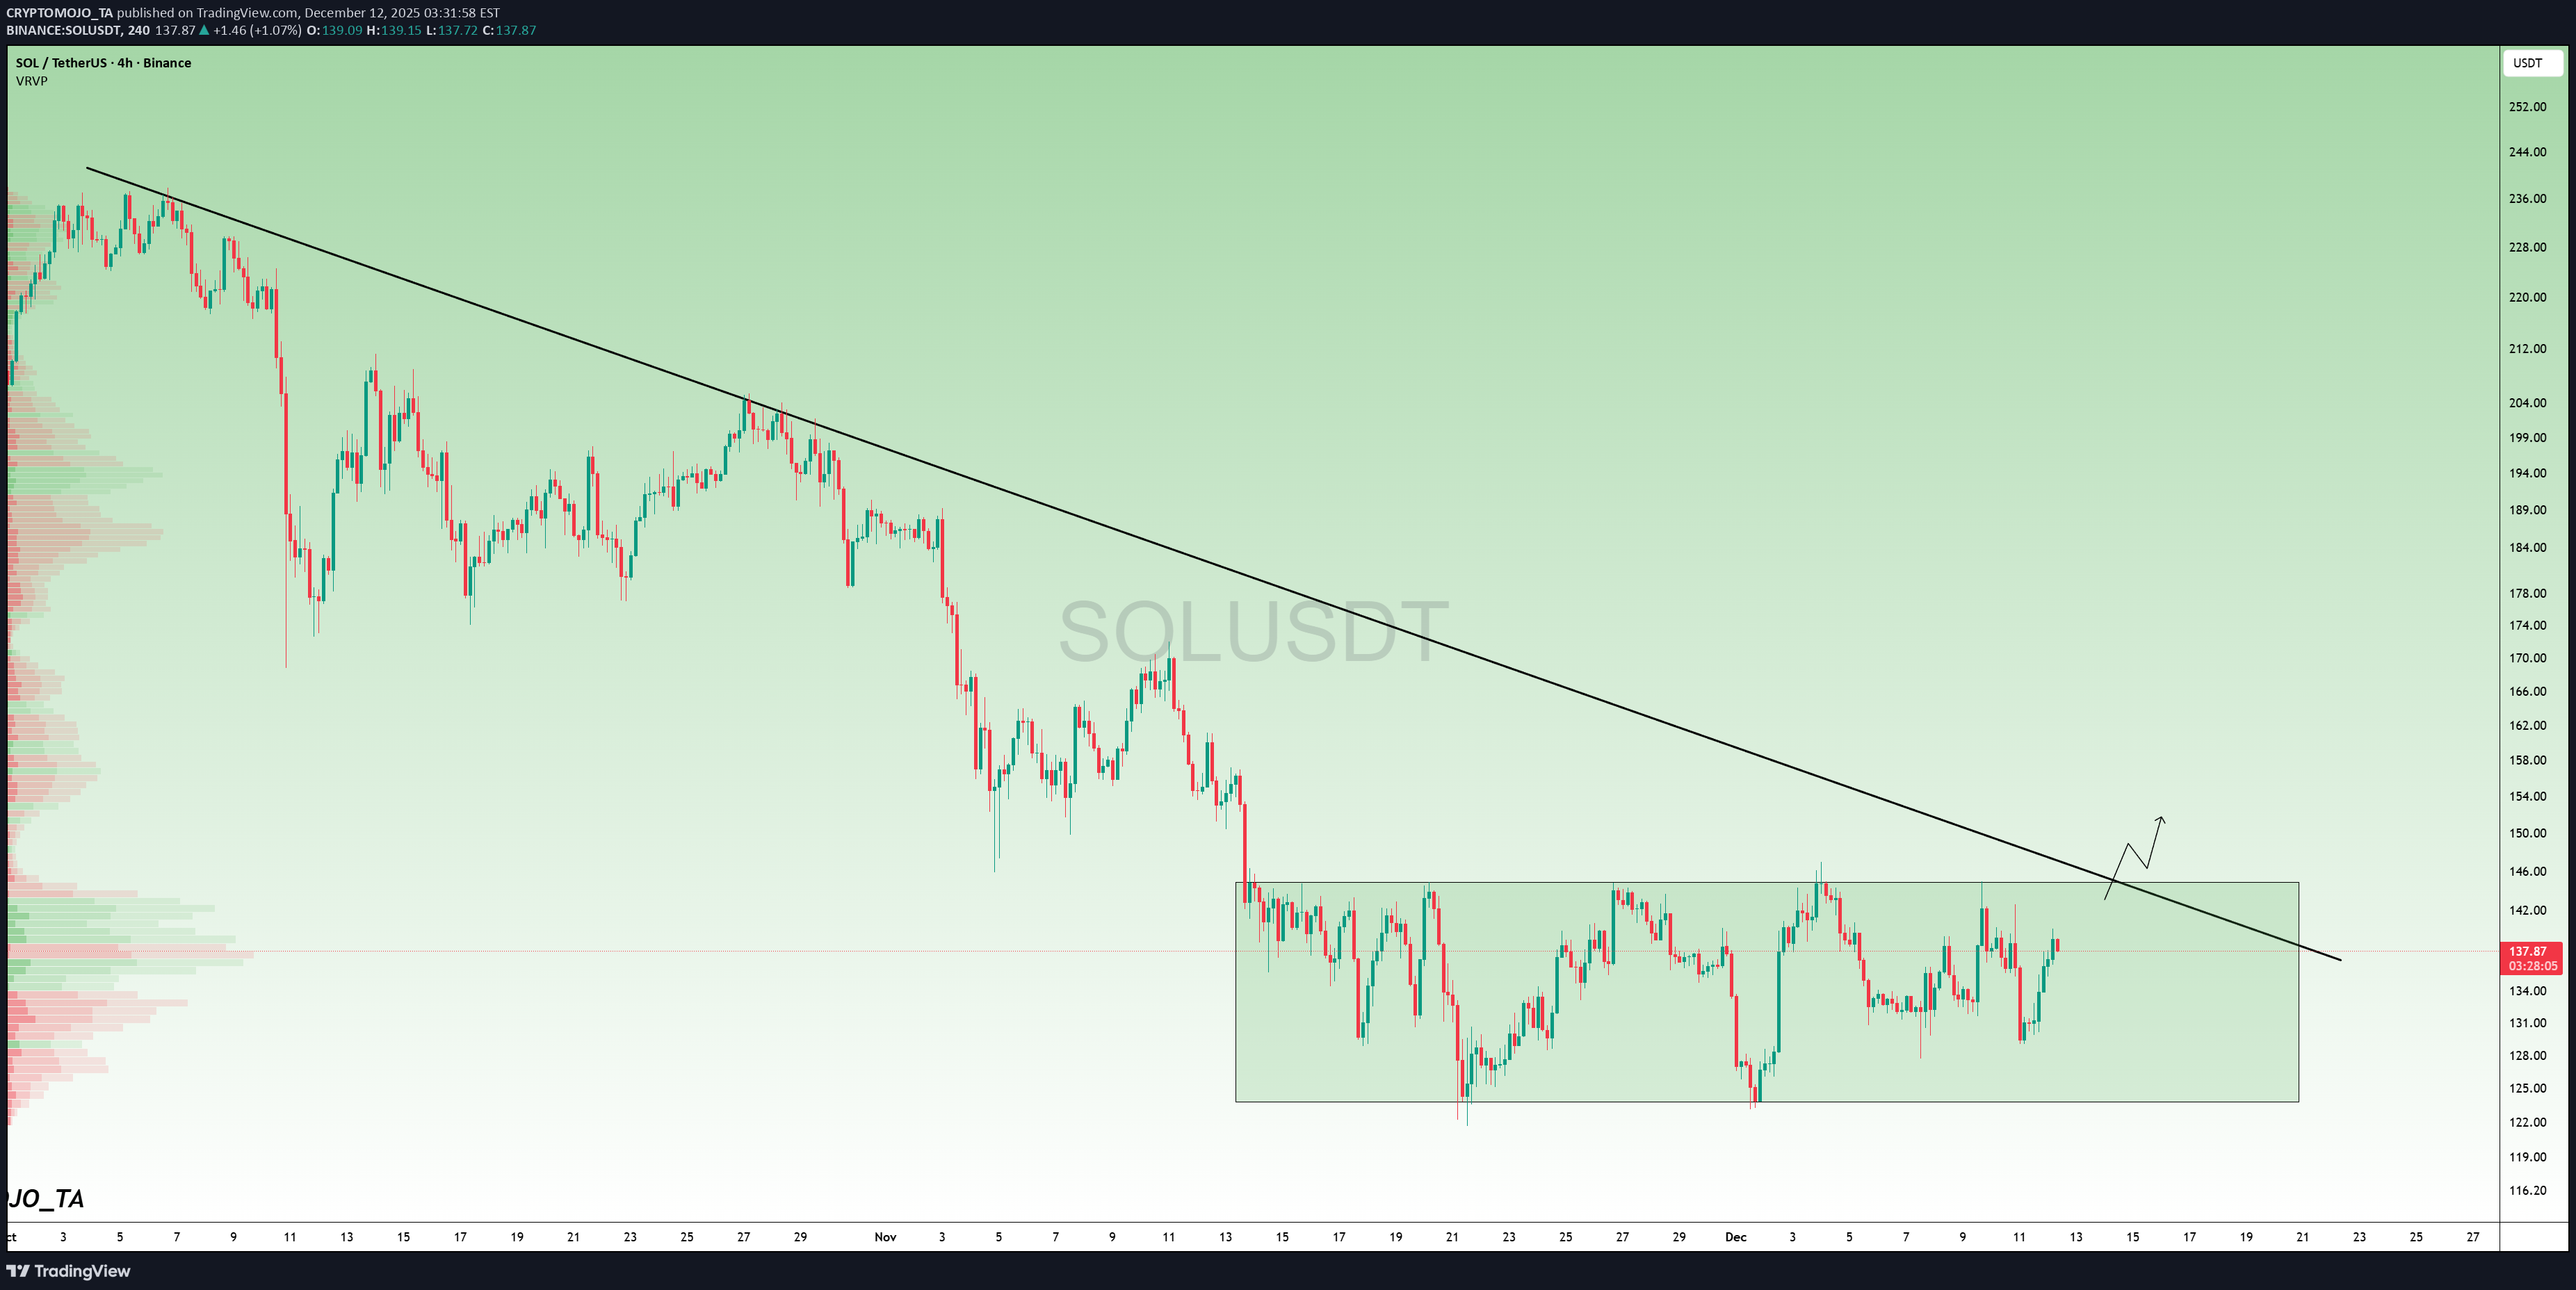
#SOL هنوز در حال ترید شدن داخل یک منطقه انباشت بزرگ است، در حالی که دقیقاً زیر خط روندِ major قرار گرفته است. این آرامش قبل از یک شکست بزرگ است... هنگامی که SOL این خط روند را بشکند، یک move قوی، با پتانسیل افزایش ۵۰ درصدی، بسیار واقعی میشود. انباشت در این ناحیه هفتههاست که در حال شکلگیری است. آماده بمانید.
CRYPTOMOJO_TA
QNT's Big Move Is Coming!
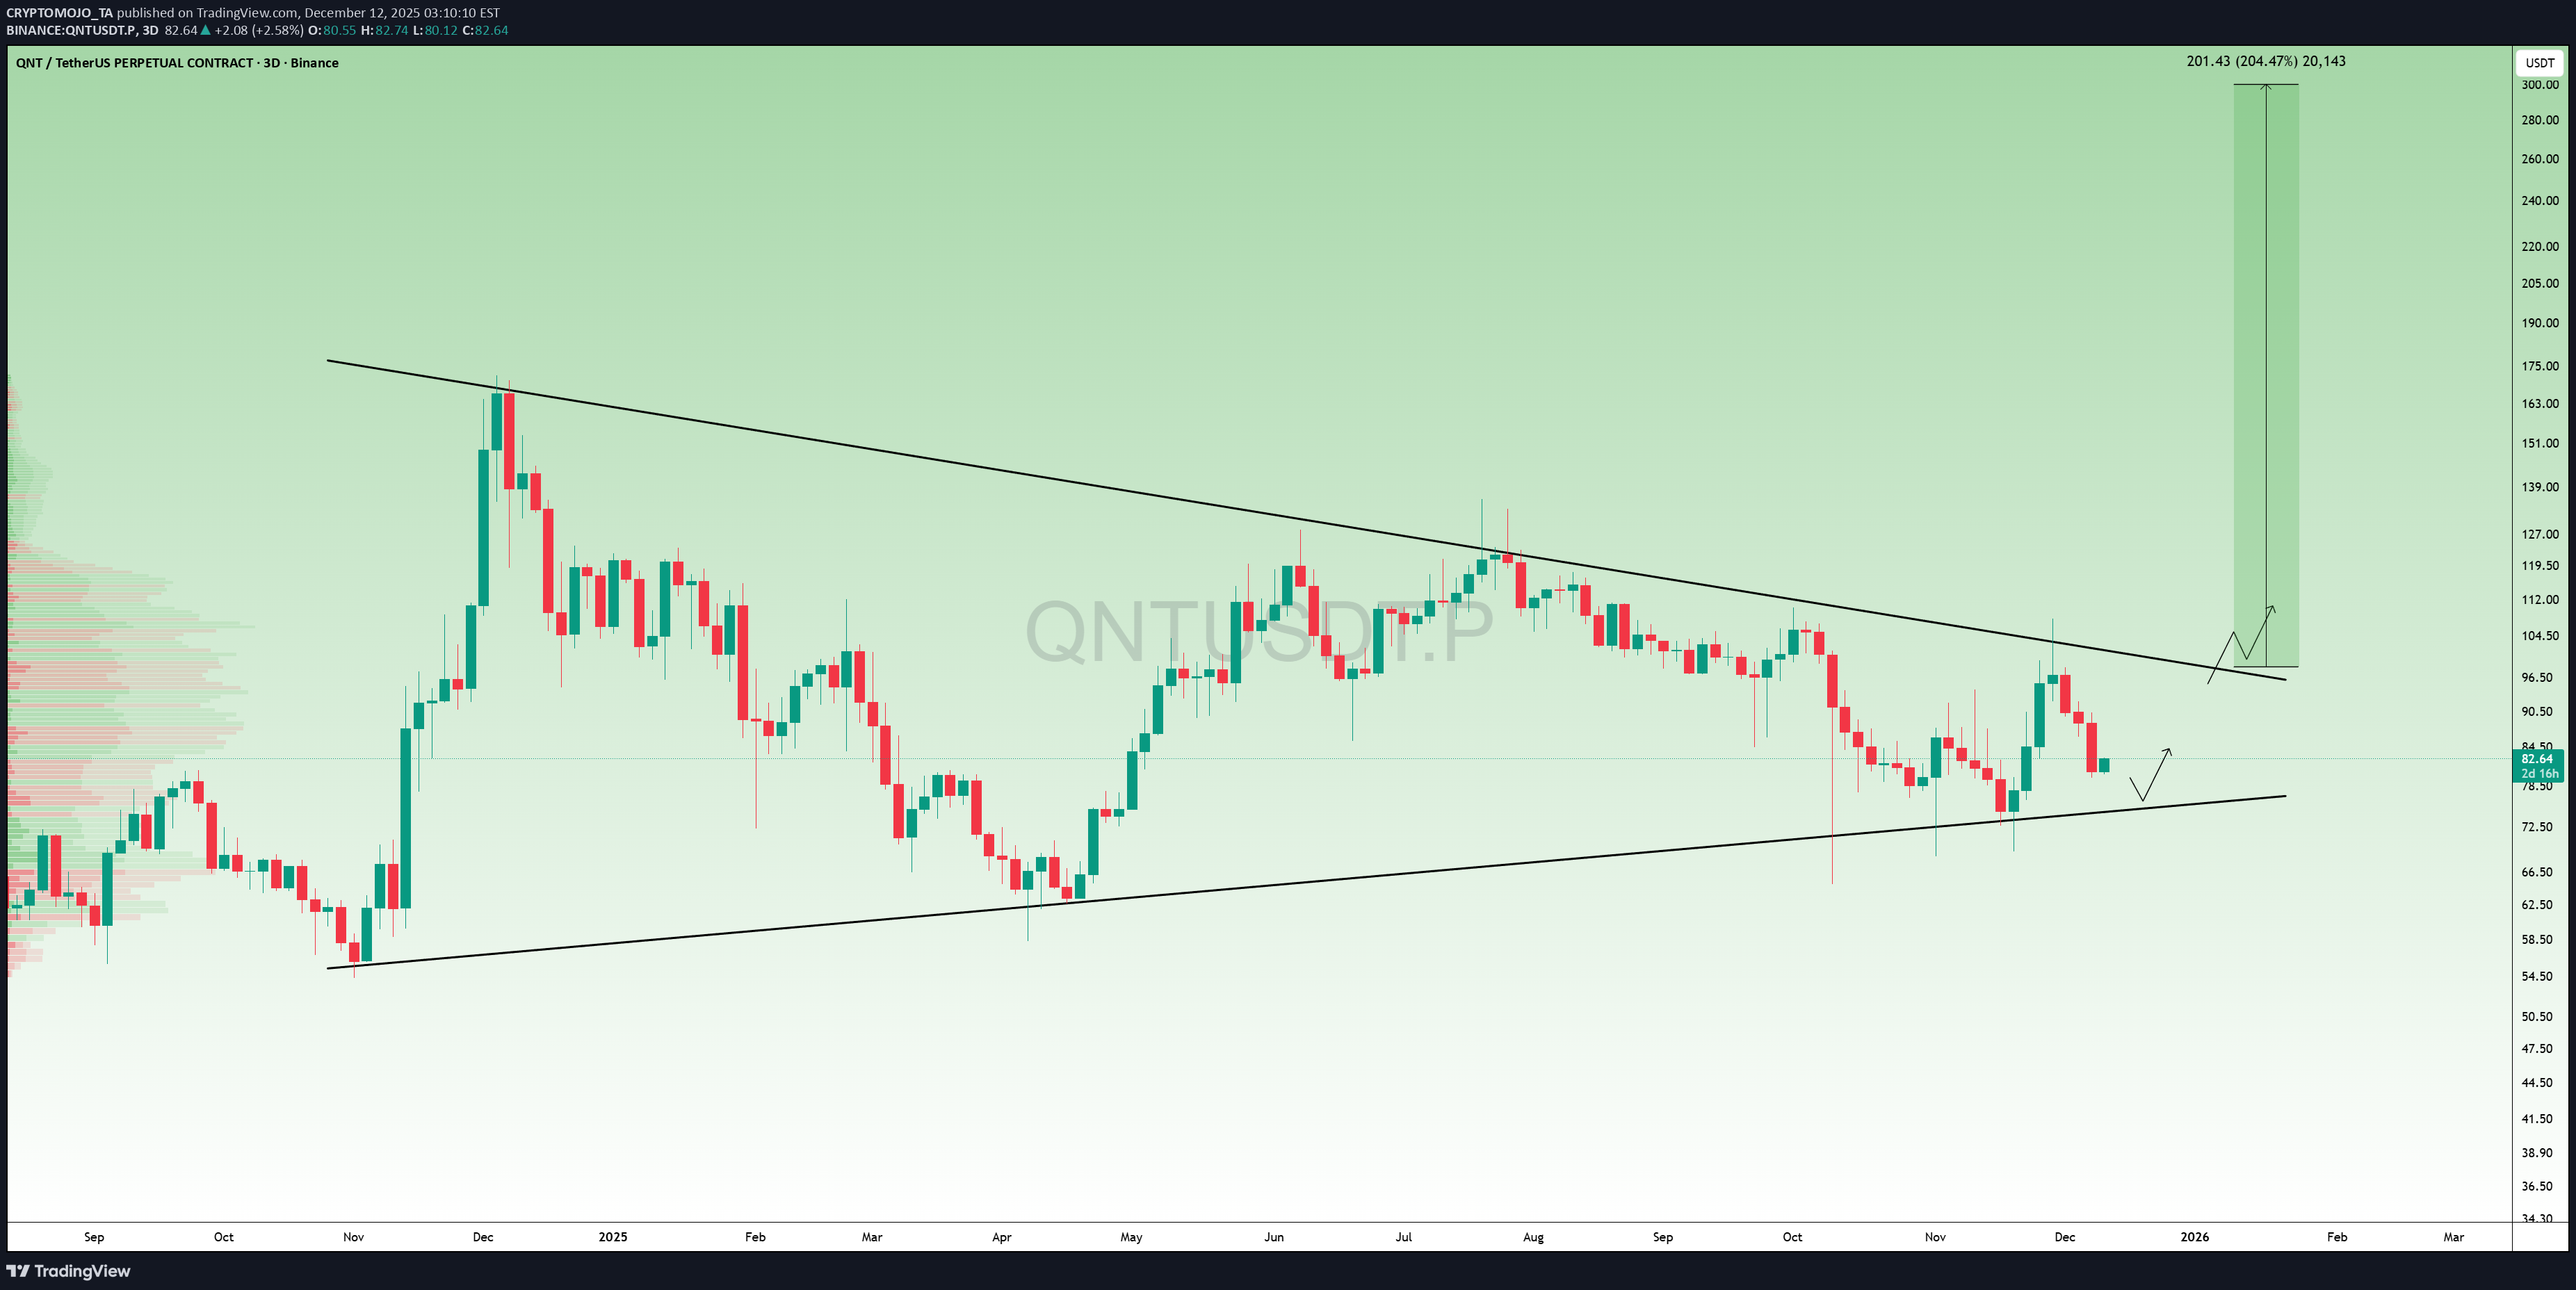
QNT در سکوت در حال ترسیم یکی از تمیزترین الگوهای ماکرو در بازار است. قیمت بیش از یک سال است که در حال فشرده شدن درون این گُوِه نزولی عظیم است... و هر بار که QNT خط روند پایینی را لمس کرده، hard جهش کرده است. اکنون در حال نزدیک شدن به منطقه شکست هستیم. شکست از این نقطه، یک move ۲۰۰ درصدی را به سمت محدوده ۲۵۰ تا ۳۰۰ دلار نشان میدهد. این توصیه مالی نیست؛ فقط احترام به نمودار است. این ممکن است افراد زیادی را شگفتزده کند.
CRYPTOMOJO_TA
LINK at Critical Bounce Point, Historically Where Rallies Begin
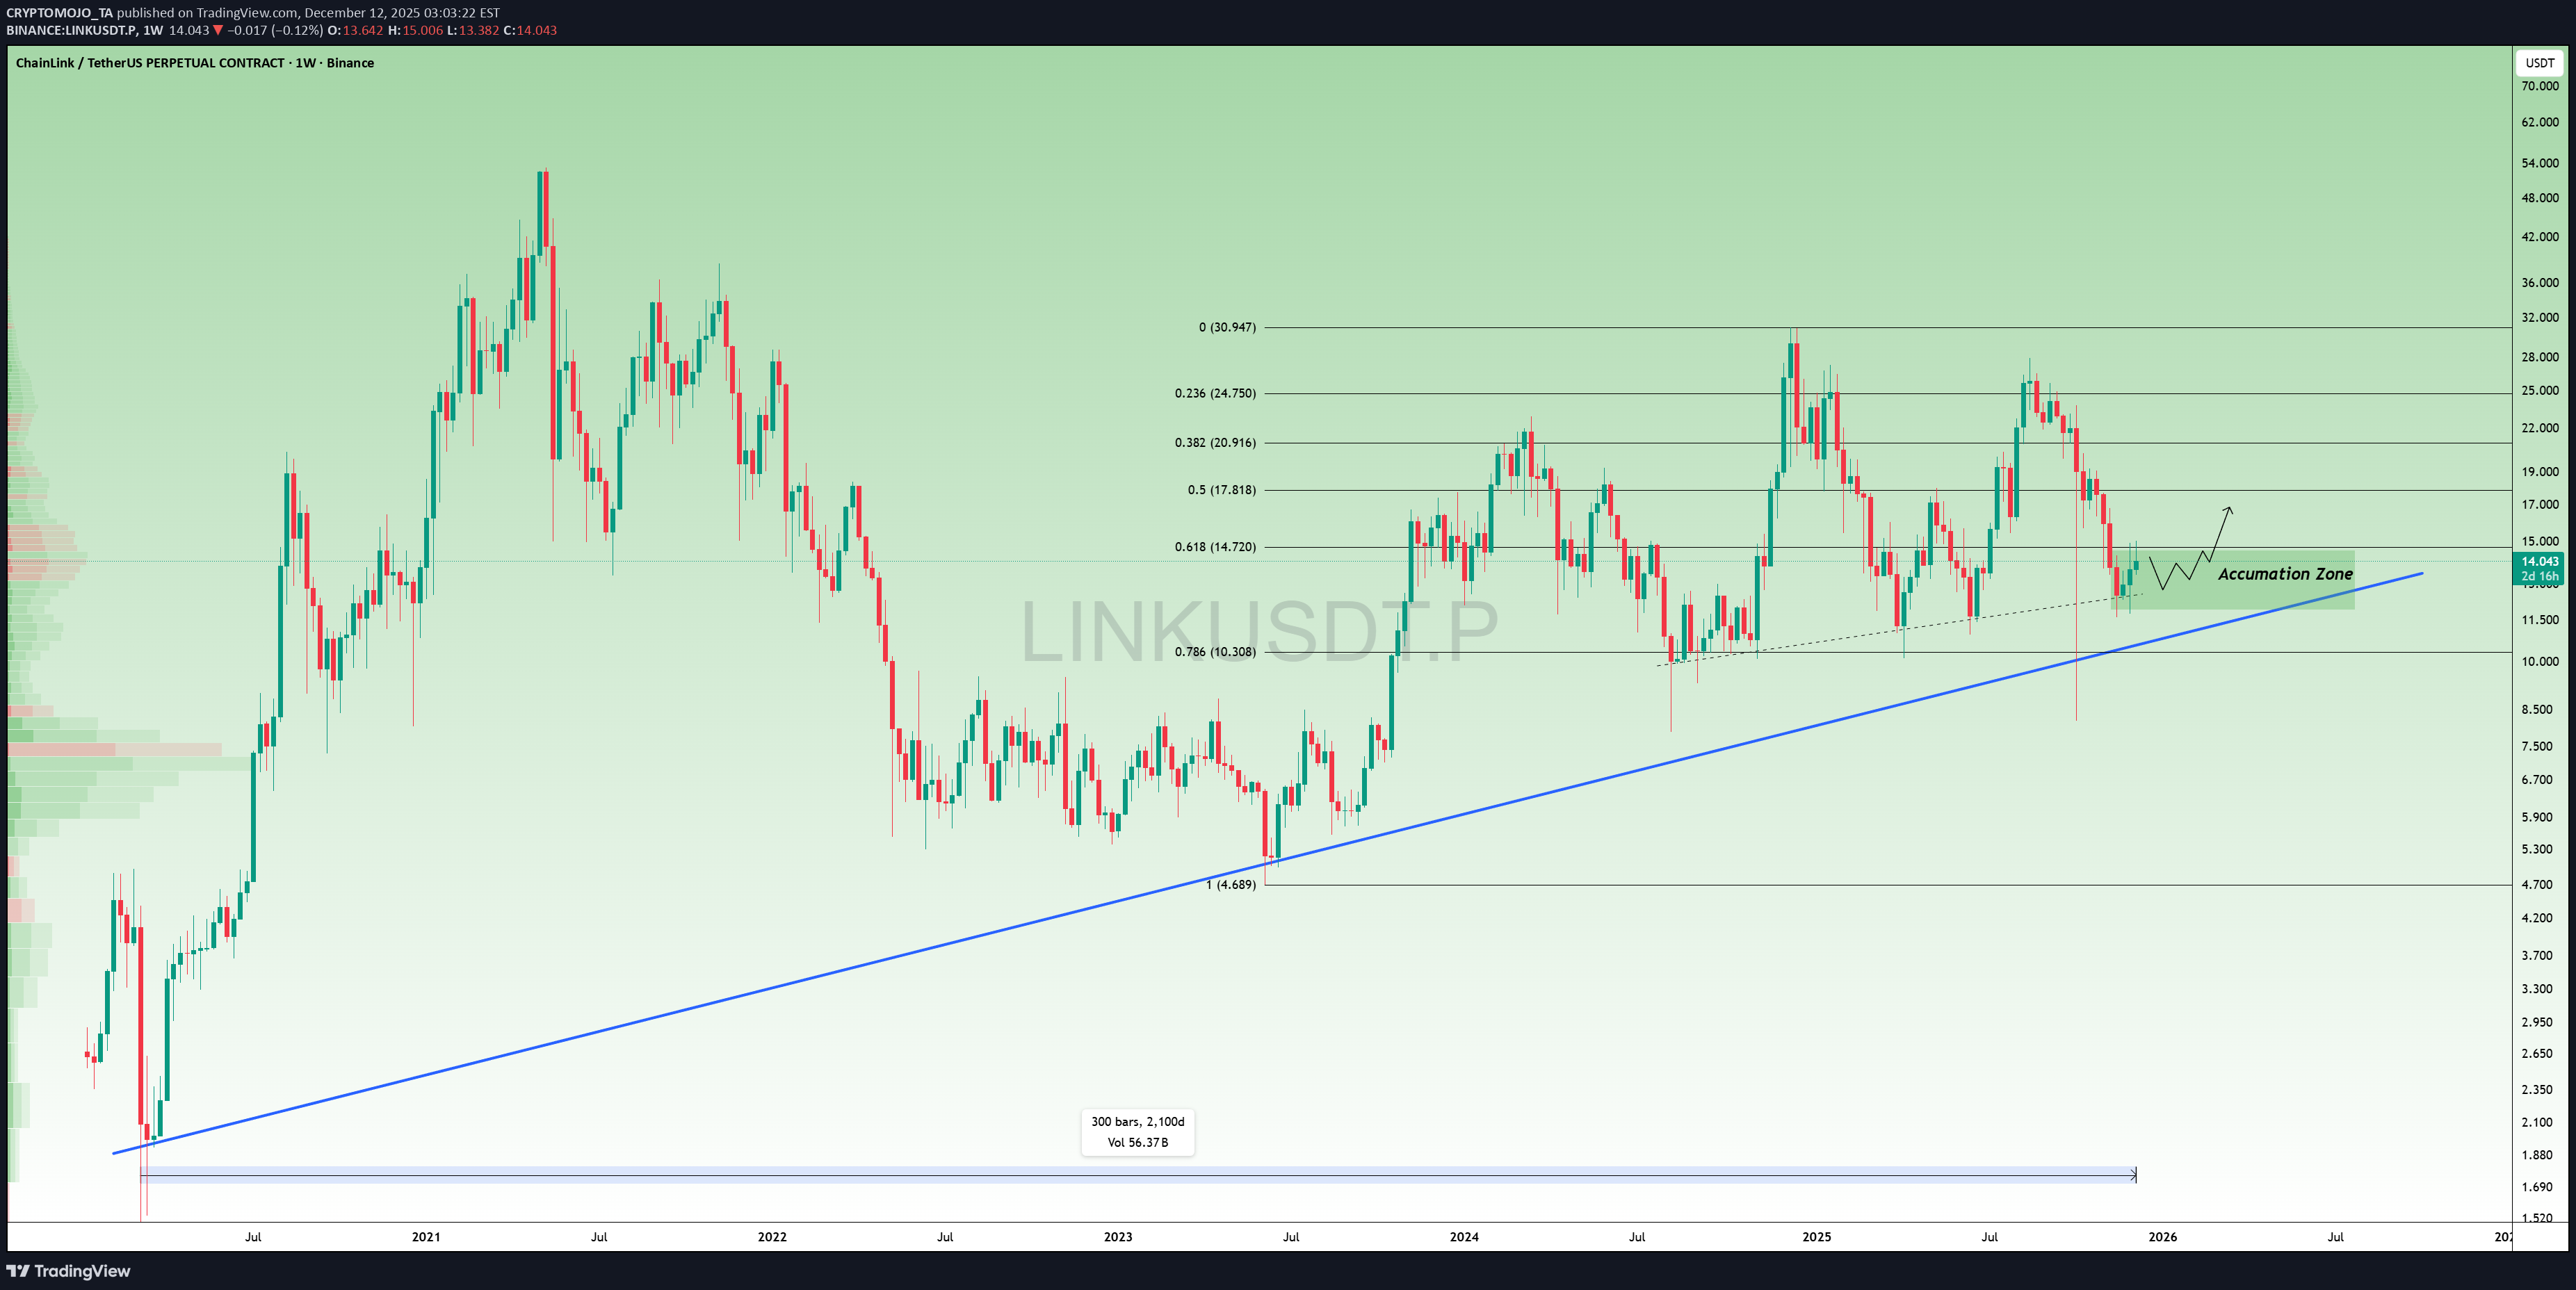
قیمت مجدداً وارد یکی از قویترین مناطق انباشت (Accumulation Zones) روی نمودار شده است. این خط روند تقریباً به مدت ۵ سال حمایت شده و هر بار برخورد به آن منجر به یک صعود قوی شده است. در حال حاضر، قیمت دقیقاً روی حمایت و سطوح فیبوناچی ۰.۶۱۸ و ۰.۷۸۶ قرار دارد؛ ناحیهای که معمولاً پول هوشمند در آنجا اقدام به خرید (Load) میکند. اگر این سطح در اینجا حفظ شود، حرکت دوباره به سمت ۱۷ تا ۲۱ دلار روی میز است. این همان ناحیهای است که اغلب حرکتهای بزرگ بازار از آنجا آغاز میشوند.
CRYPTOMOJO_TA
CRYPTOMOJO_TA
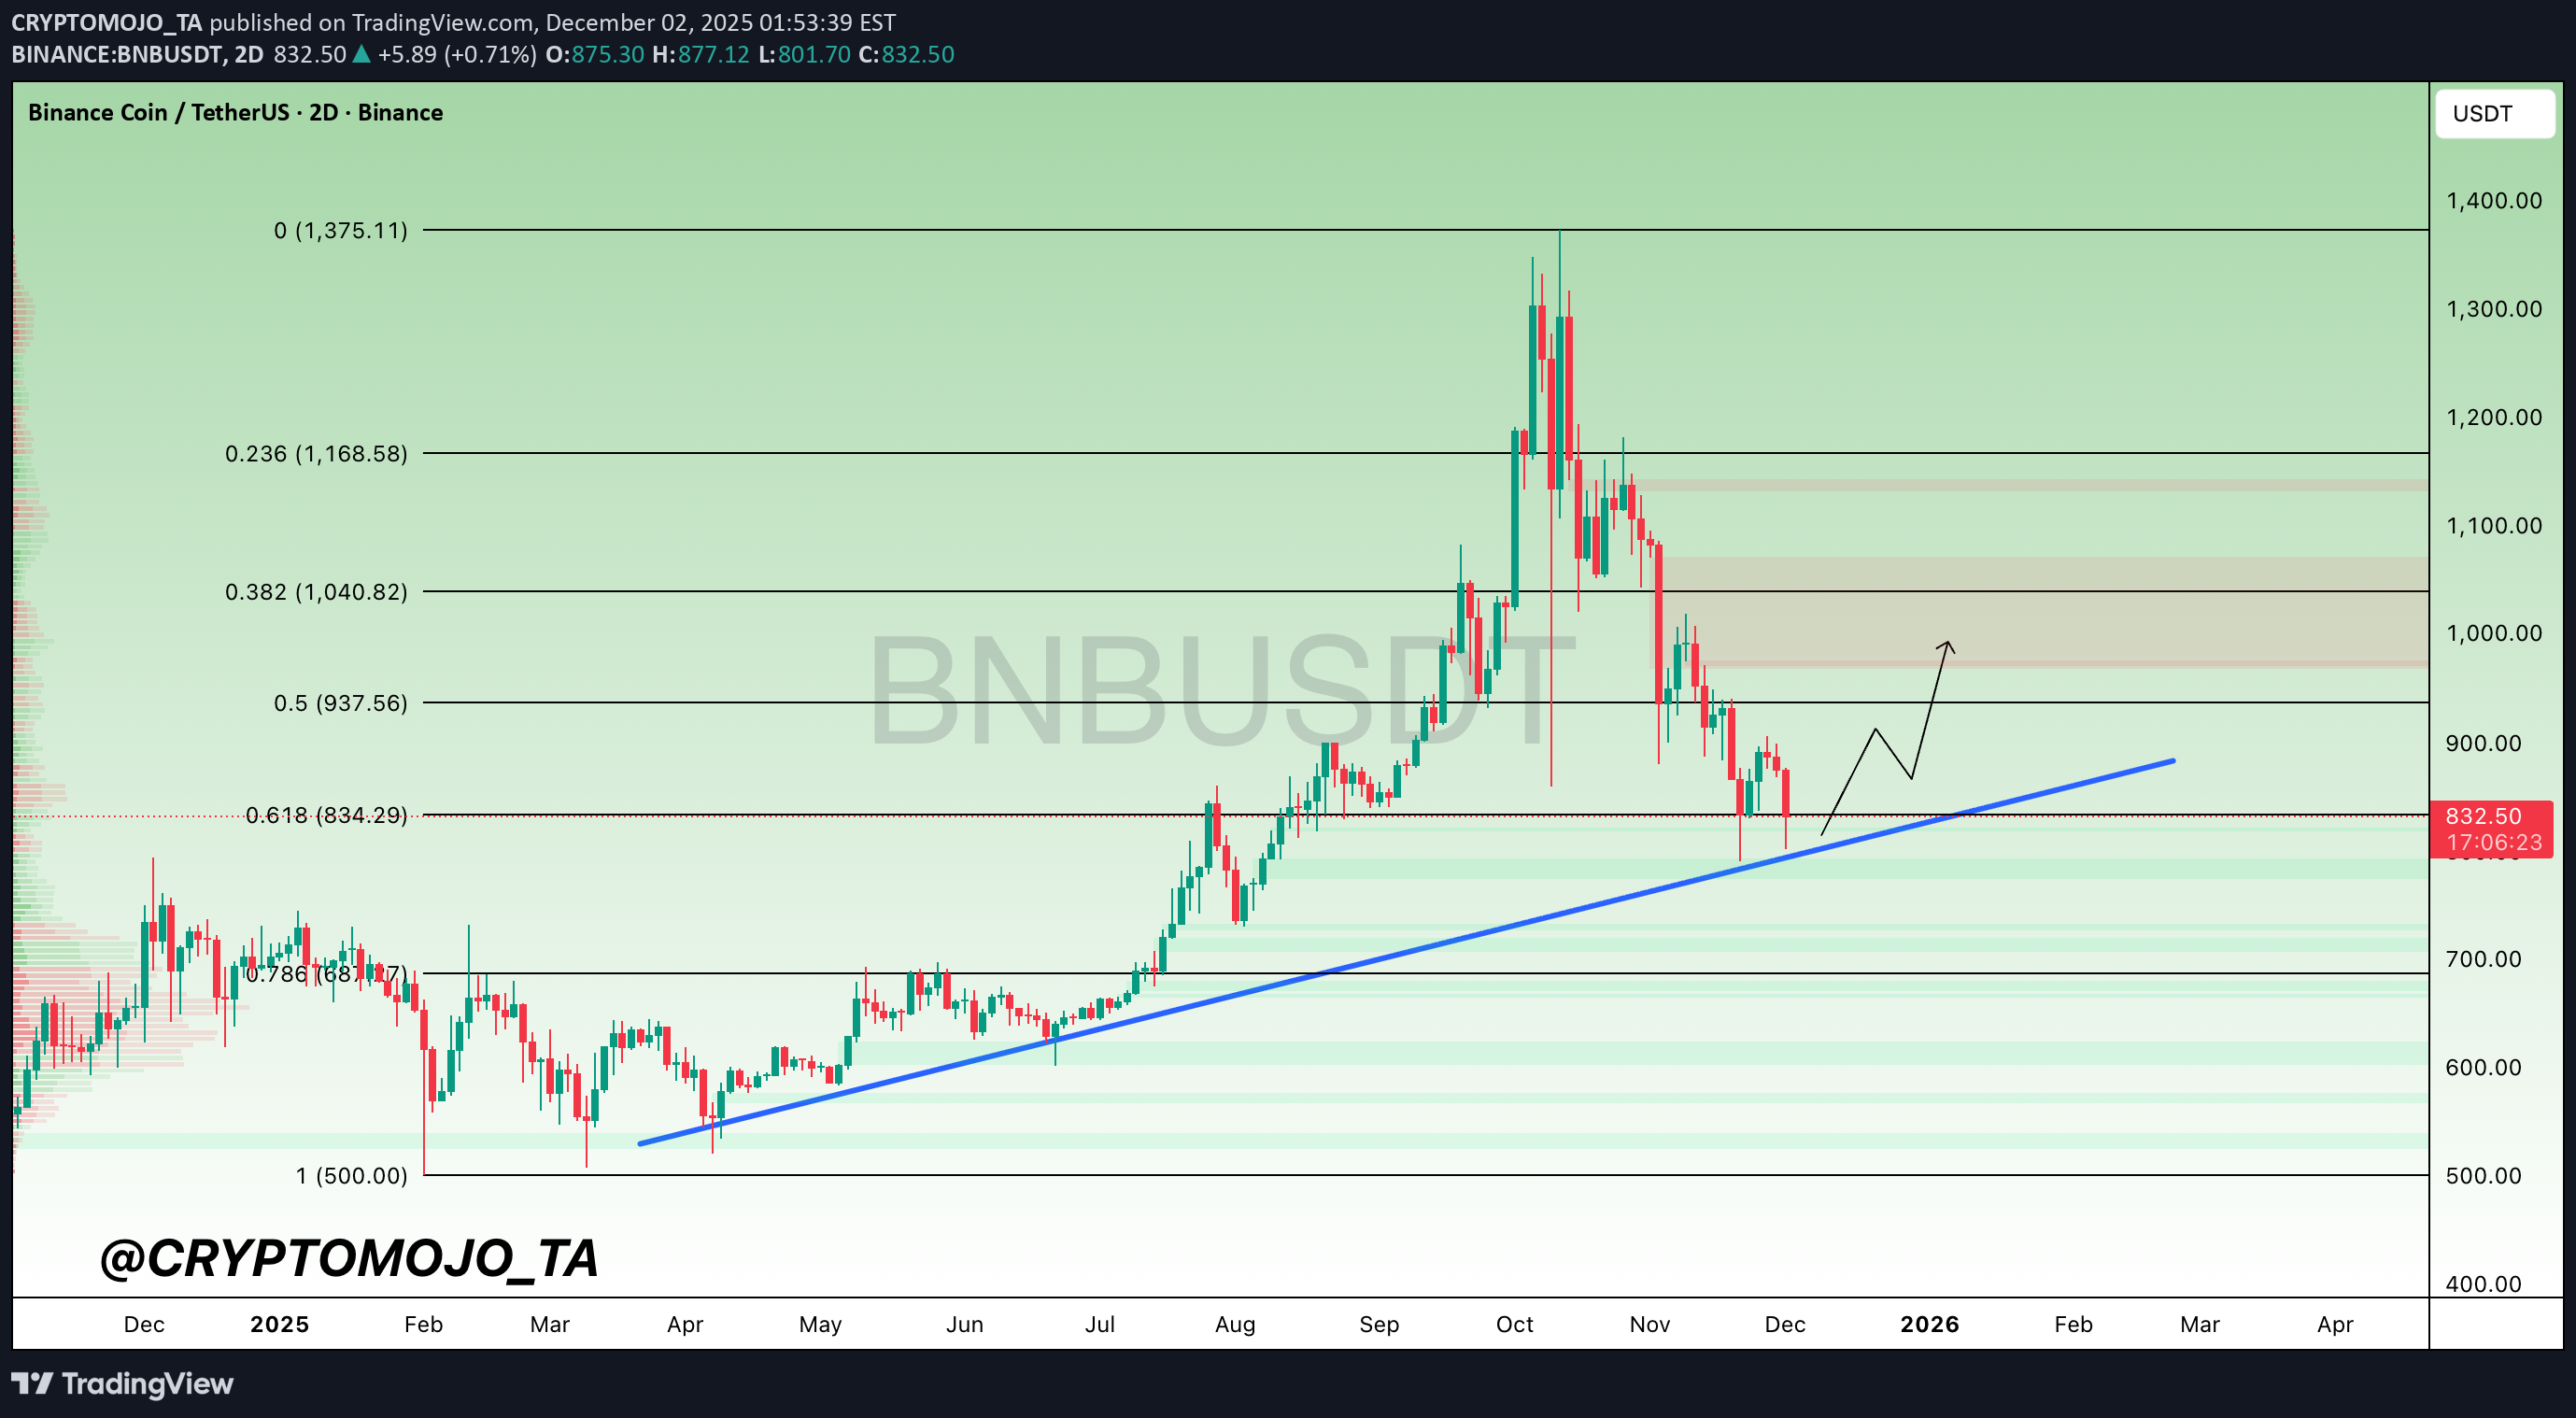
خط قرمز سرنوشتساز بیتکوین (BNB): آیا حمایت تاریخی میشکند یا به قله جدید میرسد؟
CRYPTOMOJO_TA
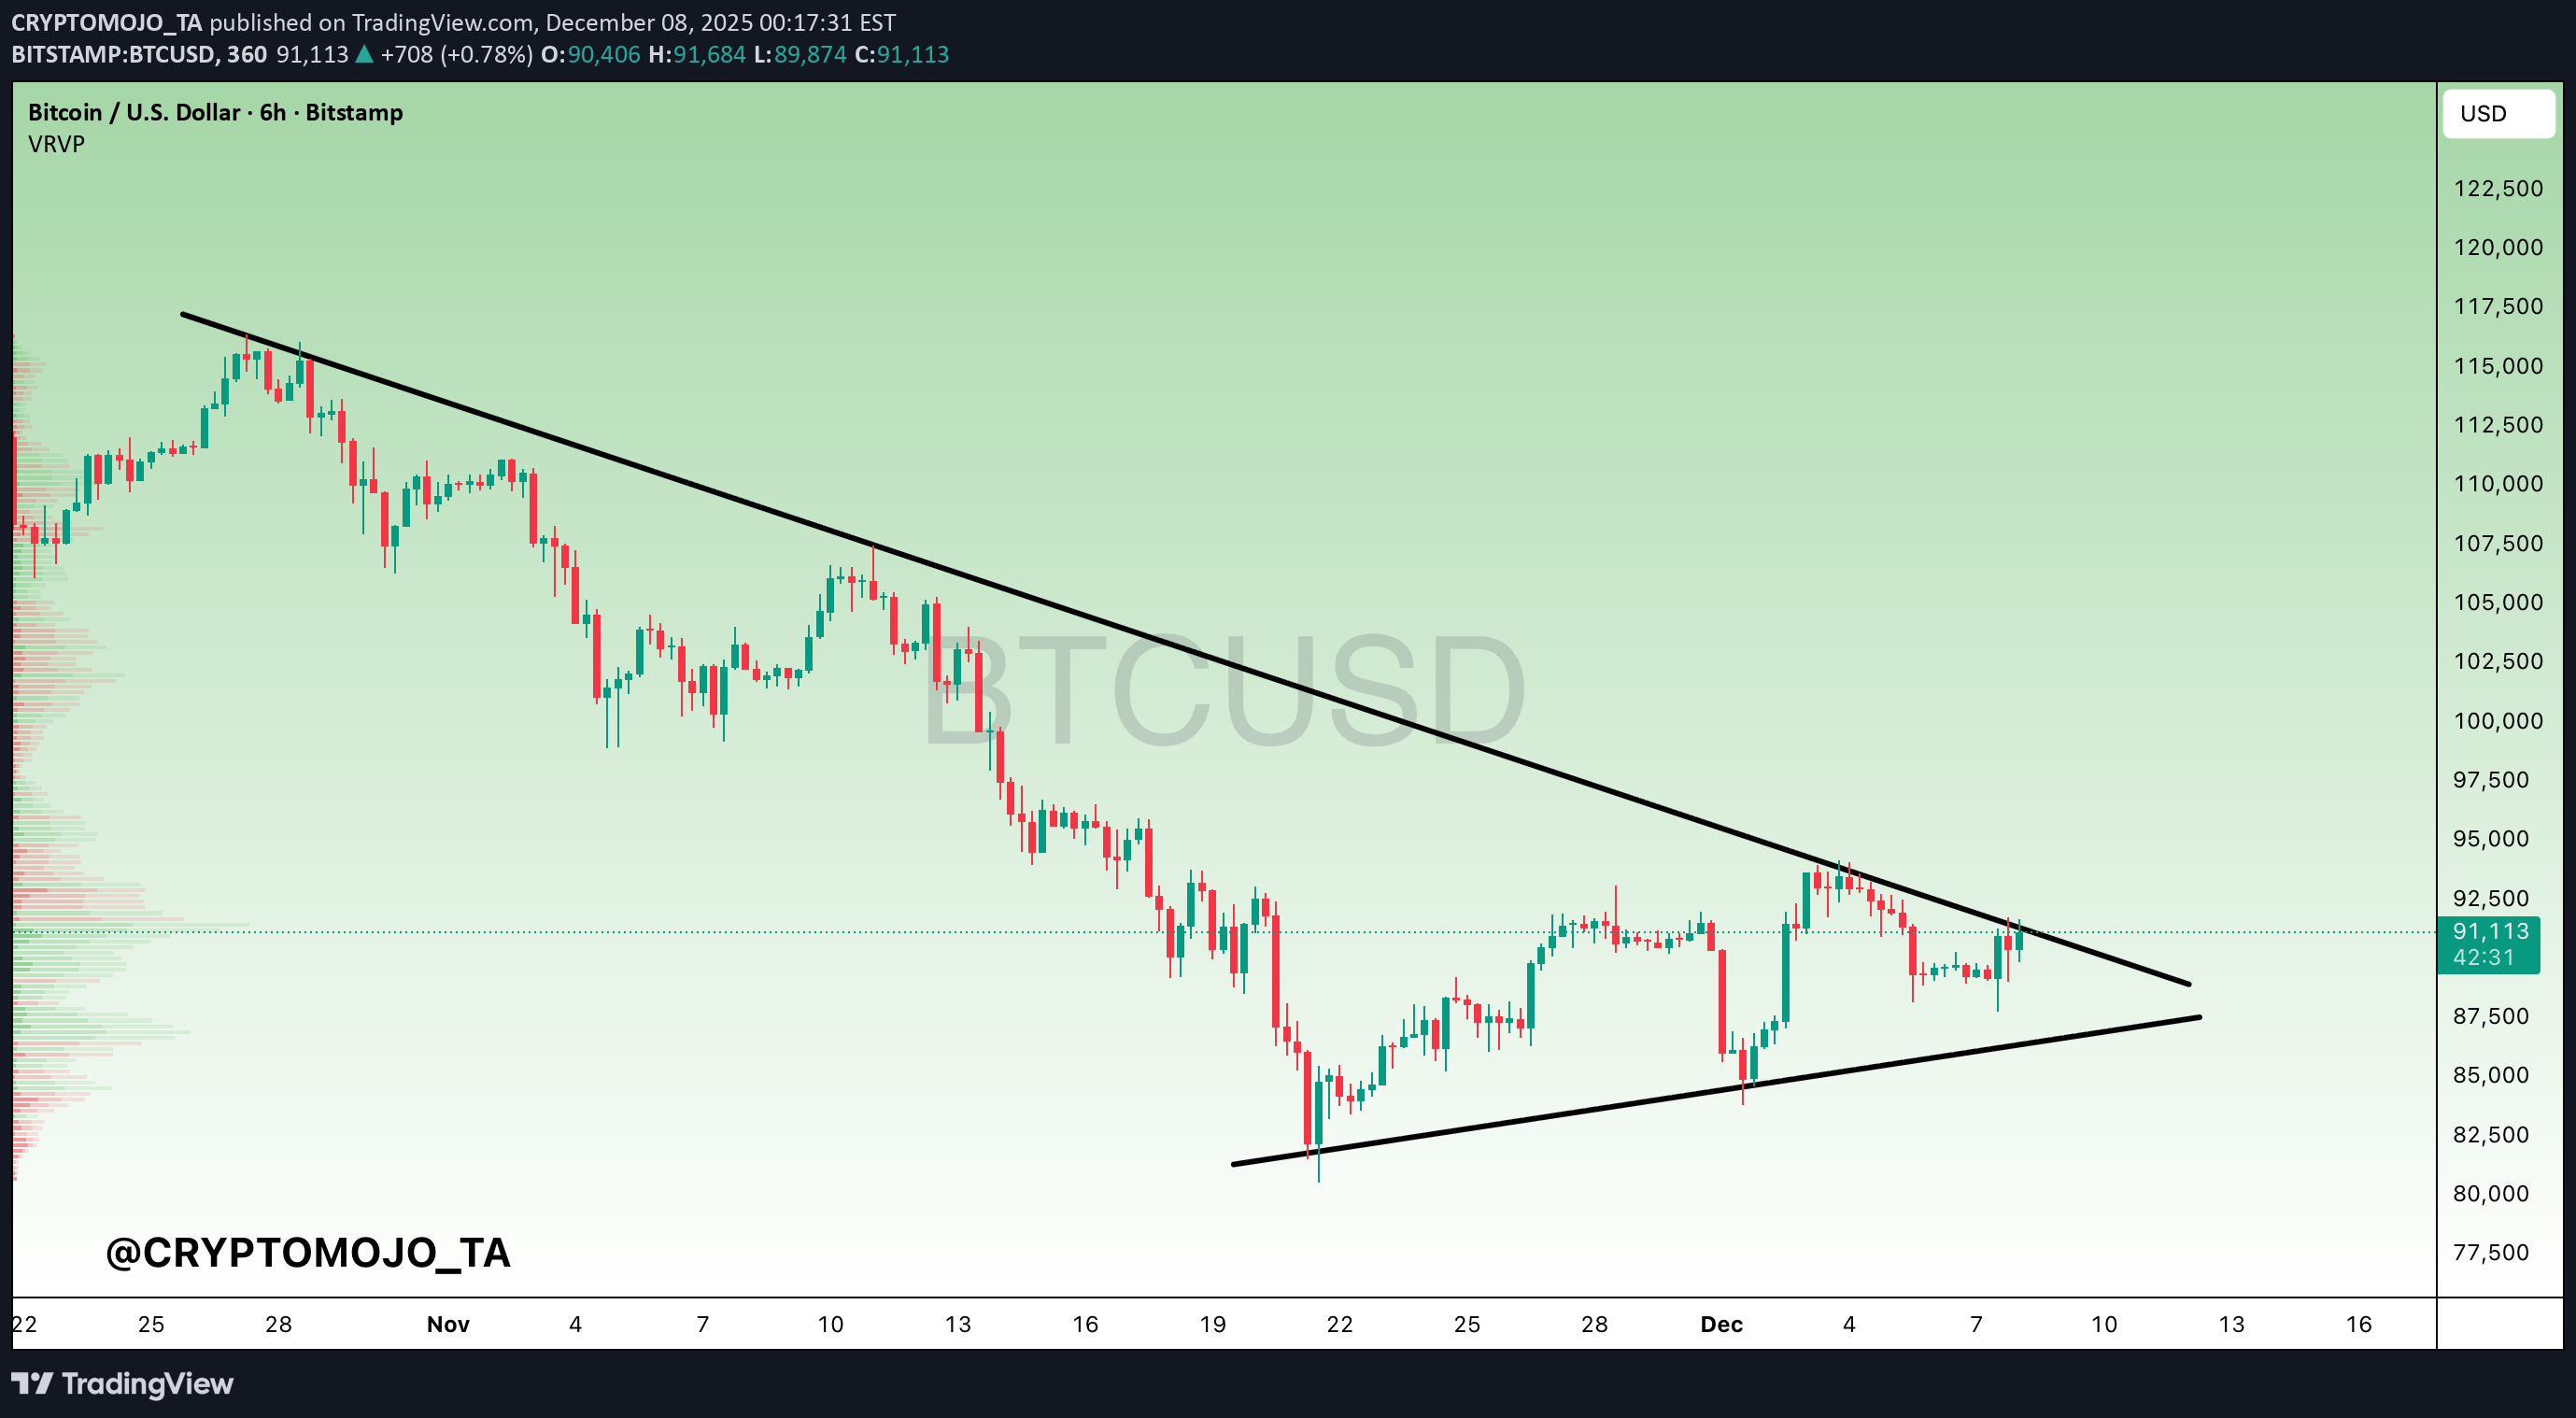
شکست خط روند بیت کوین: آیا سقوط به ۹۳ هزار یا ۸۵ هزار قطعی است؟
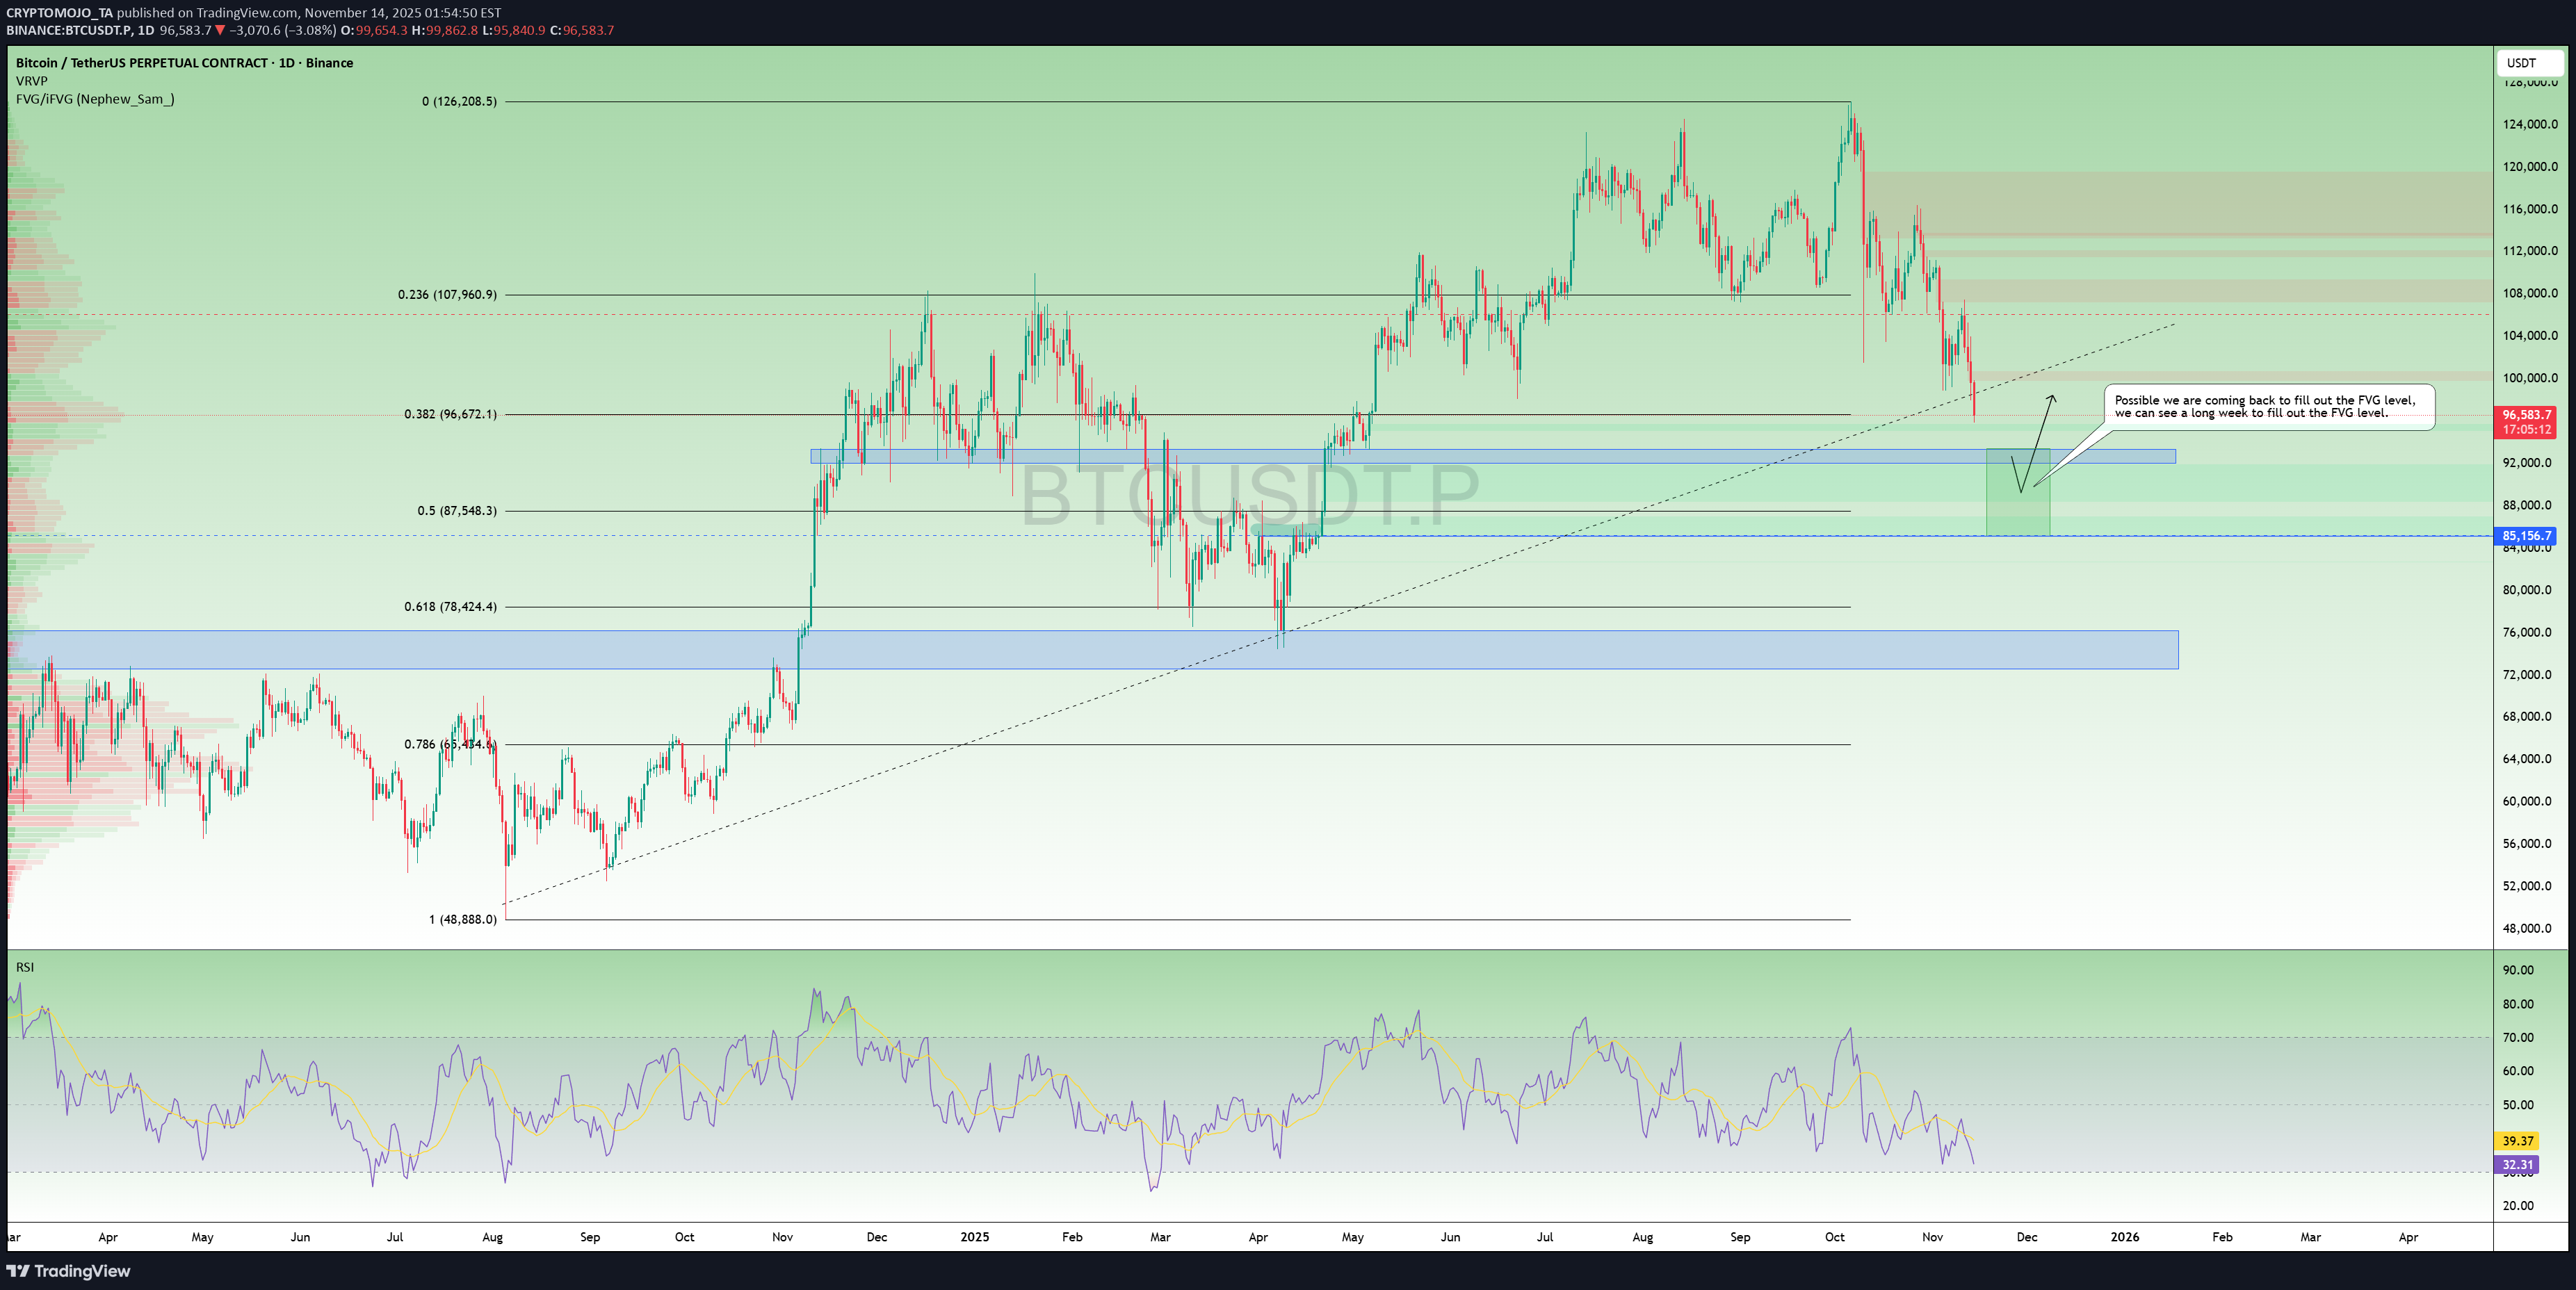
BTC به روز رسانی ساختار روزانه - خط روند از دست رفته، چشم در پشتیبانی 92–93K! Bitcoin رسماً به زیر سطح حمایت روزانه خط روند شکسته است، که نشان دهنده تغییر به سمت ضعف بیشتر در ساختار بازار فعلی است. این تفکیک احتمال افزایش سطوح اصلاحی عمیقتر را قبل از هر جهش معنیداری افزایش میدهد. 🔹 سطوح کلیدی برای تماشا ▪️ منطقه پشتیبانی 92K–93K قیمت در حال حاضر به سمت اولین منطقه پشتیبانی major حرکت می کند. این منطقه با تقاضای قبلی مطابقت دارد و می تواند یک واکنش کوتاه مدت ارائه دهد. ▪️ سطح فیبوناچی 0.5 (≈87.5K) اگر 92K-93K نتواند نگه داشته شود، آهنربای بعدی منطقه اصلاح 0.5 FIB است. از لحاظ تاریخی، BTC در طول اصلاحات میانه چرخه به 0.5 اصلاحی احترام می گذارد، بنابراین این ناحیه قابل توجه است. ▪️ شکاف ارزش منصفانه (FVG) - هدف گذاری 85 هزار یک FVG قابل مشاهده در زیر وجود دارد، و ساختار اکنون بازگشت احتمالی برای پر کردن آن را پیشنهاد میکند. اگر حرکت به سمت پایین ادامه یابد، یک فیتیله بلند به 85K کاملا روی میز است. نظرات خود را کامنت کنید و برای به روز رسانی های بیشتر دنبال کنید.
سلب مسئولیت
هر محتوا و مطالب مندرج در سایت و کانالهای رسمی ارتباطی سهمتو، جمعبندی نظرات و تحلیلهای شخصی و غیر تعهد آور بوده و هیچگونه توصیهای مبنی بر خرید، فروش، ورود و یا خروج از بازارهای مالی نمی باشد. همچنین کلیه اخبار و تحلیلهای مندرج در سایت و کانالها، صرفا بازنشر اطلاعات از منابع رسمی و غیر رسمی داخلی و خارجی است و بدیهی است استفاده کنندگان محتوای مذکور، مسئول پیگیری و حصول اطمینان از اصالت و درستی مطالب هستند. از این رو ضمن سلب مسئولیت اعلام میدارد مسئولیت هرنوع تصمیم گیری و اقدام و سود و زیان احتمالی در بازار سرمایه و ارز دیجیتال، با شخص معامله گر است.