
Andrey_Crypto
@t_Andrey_Crypto

تریدر چه نمادی را توصیه به خرید کرده؟
سابقه خرید
تخمین بازدهی ماه به ماه تریدر
پیام های تریدر
فیلتر
نوع پیام
LINKUSD

Link خوب نگه می دارد. بعد از اینکه به پشتیبانی رسیدیم ، خیلی سریع به عقب برگشتیم. ما در این مرحله LINK خریداری نمی کنیم. اگر در موقعیتی قرار دارید ، با 19.84 دلار به مقاومت نزدیک توجه کنید. اگر Link می تواند از طریق آن شکسته شود و جای خود را به دست آورد ، می توانیم اهداف بعدی را با خطوط آبی مشخص کنیم. همچنین می توانید فقط 1 تجزیه و تحلیل altcoin را بخواهید و من سعی کرد تمام تلاش خود را انجام دهم تا بتوانم به همان اندازه که می توانم پوشش دهم ، قیمت بالاتر از مقاومت 19.84 $ است این قیمت برای اولین بار نتوانست جای خود را بالاتر از سطح 19.84 دلار بدست آورد. واگرایی نزولی در نمودار روزانه به وضوح قابل مشاهده است. نتیجه بیشتر این وضعیت به طور مستقیم به Bitcoin بستگی دارد. برای رشد بیشتر ، مرز بالایی کانال سبز باید در برابر فشار بعدی فروشندگان مقاومت کند.
SOLUSDT

بیایید نگاهی دقیق تر به Solana بیندازیم. اگر قیمت بتواند از طریق خط سبز شکسته شود و بالای آن تلفیق شود ، اهداف مشخص شده توسط خطوط آبی را در نظر گرفت. هدف 1 - 101.21 هدف 2 - 106.59 هدف 3 - 112.40 هدف 4 - 119.79 همچنین می توانید به خط red نقطه توجه کنید. این همچنین مقاومت است ، که در آن قبلاً یک شکست کاذب وجود داشته است. هنگام برنامه ریزی برای خرید سولانا ، بسیار مراقب باشید. همچنین می توانید فقط 1 تجزیه و تحلیل altcoin را بخواهید و من سعی می کنم تمام تلاش خود را انجام دهم تا به همان اندازه که می توانم انجام دهم-1-هدف گرفته شده tainget
SOLUSDT

پیش بینی هر چیزی در مورد سولانا هنوز دشوار است. قیمت هنوز کانال جانبی را ترک نکرده است. نقدینگی زیادی در حدود 60 دلار جمع شده بود. در مورد ، ما سفارشات خرید را در این سطوح قرار دادیم. همچنین می توانید فقط 1 تجزیه و تحلیل altcoin را بخواهید و من سعی می کنم تمام تلاش خود را انجام دهم تا بتوانم تا آنجا که می توانم پوشش دهم
BTCUSDT Bitcoin Halving

btcusdt: Bitcoin نصف ما دو گزینه را در نظر می گیریم: گزینه رشد - ما انتظار داریم که قیمت برای مدتی به پهلو آویزان شود. برای رشد بیشتر ، شما باید جای خود را در بالای کانال بدست آورید. اگر تجارت می کنید و ریسک می کنید ، ما خطوط آبی را به عنوان اهداف رشد به شما پیشنهاد می دهیم. ما هنوز در حال خرید Bitcoin نیستیم. گزینه نزولی - در حال حاضر وضعیت بسیار پرتنش است با توجه به اینکه از ابتدای سال 2023 ، بیت کوین 200 ٪ و بدون هیچ رکود خوبی رشد کرده است. حتی با وجود خبرهای مربوط به نصف ، اکنون خرید بیت کوین خطرناک است ، زیرا نهنگ ها اغلب در چنین خبرهایی Bitcoin می فروشند. همچنین نقدینگی بزرگ را در حدود 33.900 دلار در نظر داشته باشید. در حال حاضر ، هیچ نکته ای برای حدس زدن توپ نشانه به کجا نمی رود. این به معنای واقعی کلمه یک قرعه کشی 50/50 است. همانطور که قبلاً نیز اشاره کردیم ، ما هنوز توپ نشانه ای را خریداری نمی کنیم ، زیرا بهتر است سود کمتری نسبت به نشستن در red کسب کنیم. در این مرحله ، ما سفارشات خرید را دقیقاً بالاتر از منطقه 34،000 دلاری قرار داده ایم. 1 هدف 50499 $
ETHUSD

به احتمال زیاد ، چنین رشد قوی در برابر پس زمینه اخبار مربوط به ETF در Ethereum رخ داده است. مهلت تصویب برنامه های Ethereum ETF 24 مه است. برای رشد بیشتر ، باید مقاومت را با 2732 دلار از بین ببرید و بالاتر از این سطح ادغام شوید. اهداف در صورت رشد بیشتر با خطوط آبی مشخص می شوند. همانطور که در مورد بیت کوین ، ما هنوز Ethereum خریداری نمی کنیم ، زیرا خطرناک است. همچنین به خاطر داشته باشید که نقدینگی زیادی در منطقه 1870 دلار وجود دارد. همچنین می توانید فقط 1 تجزیه و تحلیل altcoin را بخواهید و من سعی می کنم تمام تلاش خود را انجام دهم تا به همان اندازه که می توانم پوشش دهم این قیمت توانست مقاومت بزرگی را با 2732 دلار از بین ببرد. ما در حال حاضر از نزدیک اوضاع را کنترل می کنیم. اگر اتر بتواند جایگاهی را در این سطح به دست آورد ، ما رشد بیشتری را به سمت اهداف نشان داده شده توسط خطوط آبی 2937 دلار - 3148✅ 1 هدف در نظر گرفت.
BTCUSDT: Medium-term idea

ما انتظار داریم که Bitcoin برای مدتی به پهلو حرکت کند. در صورت حرکت صعودی ، اهداف مشخص شده توسط خطوط آبی را در نظر می گیریم: 50،499 دلار - 56،396 دلار. اگر یک خروج رو به پایین بدست آوریم ، اهداف زیر را در نظر گرفت: 35178 دلار - 31،866 دلار همچنین می توانید فقط 1 تجزیه و تحلیل AltCoins را بخواهید و من سعی کرد تمام تلاش خود را برای پوشش تا آنجا که می توانم انجام دهم Bitcoin از مرز بالایی کانال شکسته شده است. اگر قیمت می تواند بالای کانال ادغام شود ، اهداف مشخص شده توسط خطوط آبی را در نظر گرفت. از آخرین بررسی ، ما یک هدف دیگر اضافه کردیم. مراقب باشید ، تمام نقدینگی زیر است و ممکن است قیمت آن پایین بیاید تا آن را از بین ببرد. اگر می اکنون وارد شوید ، آن را با درصد کمی از سپرده انجام دهید. اگر تغییراتی وجود داشته باشد ، ما می نویسیم. Update قیمت Bitcoin دوباره به کانال جانبی بازگشت. اگر به نمودار نگاه کنید ، می توانید بگویید که قیمت سعی در دستیابی به جایگاه بالای کانال نداشته است. همانطور که در تجزیه و تحلیل قبلی نوشتیم ، بیشتر نقدینگی در پایین است و به احتمال زیاد قیمت آن را دنبال می کند. منطقی بود که فرض کنیم نقدینگی به وضوح عوارض خود را به همراه دارد. قسمت اول نقدینگی تقریباً 33.900 دلار است. ما به شما توصیه می کنیم که این منطقه را توجه کنید. ما انتظار داریم که قیمت مدتی در یک کانال جانبی حرکت کند. ما الان چیزی خریداری نمی کنیم. در صورت بروزرسانی های مهم ، ما می نویسیم. اخبار جعلی در مورد تأیید نقطه Bitcoin ETF ، ما به هدف اول رسیدیم - 47،613 دلار کمیسیون اوراق بهادار و بورس گفت که با اجرای قانون در تحقیق در مورد هک که منجر به پیام دروغین در مورد تصویب A Bitcoin ETF شد ، همکاری کرد.
BTCUSDT: Short term idea

در حالی که قیمت بالاتر از خط روند رو به رشد است. اگر خط روند صعودی شکسته شود ، قیمت به احتمال زیاد به مرز پایین کانال جانبی سقوط می کند. اهداف زیر ارزش توجه دارند: 1) 40348 2) 39587 3) 38450 همچنین می توانید فقط 1 تجزیه و تحلیل AltCoins را بخواهید و من سعی کرد تمام تلاش خود را انجام دهم تا بتوانم تا آنجا که می توانم مطابق با گزینه کوتاه مدت ، آن را بپوشانم ، قیمت فقط به وسط کانال رسیده و دوباره ریخته شده است. قیمت Bitcoin از کانال جانبی به سمت بالا بیرون آمد. اکنون ادغام بالاتر از سطح وجود دارد. این همه به دلیل اخبار اتفاق می افتد. #Bitcoin ETF احتمالاً در روز چهارشنبه و به طور بالقوه در روز جمعه یا پنجشنبه تصویب می شود. اگر #bitcoin ETF تأیید شود ، Bitcoin می تواند حرکت به سمت بالا را فراهم کند. اگر ETF تأیید نشده باشد ، می توانید انتظار سقوط خوبی داشته باشید. همچنین نقدینگی بزرگ را در حدود 33.900 دلار در نظر داشته باشید.
SOLUSDT

اگر قیمت موفق به تحکیم بالاتر از پشتیبانی با 86 دلار شود ، ارزش آن را دارد که اهداف زیر را در نظر بگیرید: 97.99 - 109.16 - 119.91 - 134.29. در صورت بروزرسانی مهم ، بلافاصله در اینجا نوشت. فراموش نکنید که اعلان ها را روشن کنید. همچنین می توانید فقط 1 تجزیه و تحلیل altcoin را بخواهید و من سعی می کنم تمام تلاش خود را انجام دهم تا به همان اندازه که می توانم انجام دهم-2-هدف گرفته شده 3 هدف گرفته شده
IOTAUSD
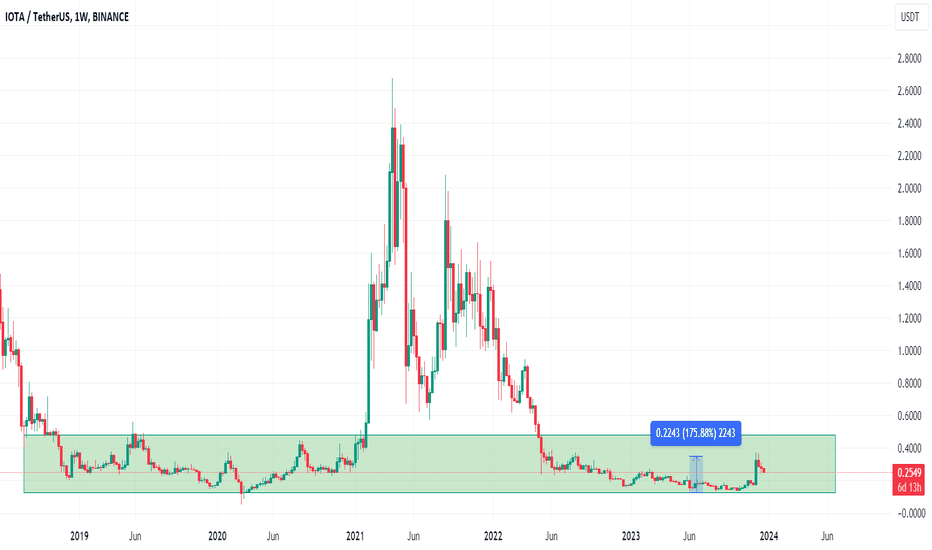
مرور من پیشنهاد می کنم از منظر بلند مدت به این سکه نگاه کنید ، زیرا این یکی از آن دارایی هایی است که می توانید در نمونه کارها خود استفاده کنید. در طول بازار خرس ، خریداران توانستند از 2 سال پشتیبانی خود را حفظ کنند. از ژوئن سال 2023 ، قیمت 175 ٪ افزایش یافته است که چشم اندازهای بسیار خوبی برای رشد بزرگ در طول فصل گذشته به ما می دهد. در حال حاضر ارزش خرید سکه را ندارد ، زیرا بسیار محتمل است که بتوانیم افت خوب دیگری را در ALT مشاهده کنیم. در آینده نزدیک ، ما همچنین انتظار داریم که سکه در کانال حرکت کند ، که از سال 2018 شروع به form کرد. چرا ارزش نگاه دقیق تر به این سکه خاص را دارد؟ IOTA اولین صندوق ثبت شده لجر توزیع شده (DLT) تحت نظارت بازار جهانی ابوظبی (ADGM) در امارات شد. این اقدام IOTA را به عنوان یک رهبر در امور مالی دیجیتال در منطقه خاورمیانه و شمال آفریقا (MENA) برجسته کرد. همچنین می توانید فقط 1 تجزیه و تحلیل altcoin را بخواهید و من سعی می کنم تمام تلاش خود را انجام دهم تا بتوانم تا آنجا که می توانم پوشش دهم
BTCUSDT

btcusdt بروزرسانی خط افزایش به رنگ سبز این پشتیبانی است. تا زمانی که BTC بالاتر از این خط باشد ، Altcoins می توانند به شدت رشد کنند. اکنون باید اوضاع را از نزدیک نظارت کنیم ، زیرا دفعه بعد که خط روند افزایش ممکن است در برابر فشار فروش مقاومت نکند. ما در صورت بروزرسانی برای شما می نویسیم. فراموش نکنید که پشتیبانی خود را توسط مانند (موشک) و اظهار نظر نشان دهید؟ Bitcoin قیمت از خط روند رو به بالا شکسته شده است. همچنین در شکل شما یک موج اصلاحی الیوت (مشخص شده توسط Purple ABC) را مشاهده می کنید ، که هنوز کاملاً شکل نگرفته است. اگر ساختار موج اصلاحی مطابق با الیوت ادامه یابد و ما در نهایت به سطح 39.566 دلار برسیم ، می توانید Bitcoin را در 2-5 ٪ سپرده خریداری کنید ما در صورت بروزرسانی برای شما برای شما می نویسیم. قیمت BTC به پشتیبانی 39.566 دلار نرسید و پرواز کرد. خط سبز پشتیبانی ما باقی مانده است ، اما نباید آن را به عنوان یک "دیوار" قوی درک کرد. اگر شاهد وقفه در پشتیبانی باشیم ، احتمالاً قیمت بسیار پایین تر شد. اکنون ما به شما توصیه می کنیم که اوضاع را از نزدیک نظارت کنید و انگشت خود را بر روی نبض بازار نگه دارید. در صورت بروزرسانی های قابل توجه ، ما بلافاصله برای شما می نویسیم.
سلب مسئولیت
هر محتوا و مطالب مندرج در سایت و کانالهای رسمی ارتباطی سهمتو، جمعبندی نظرات و تحلیلهای شخصی و غیر تعهد آور بوده و هیچگونه توصیهای مبنی بر خرید، فروش، ورود و یا خروج از بازارهای مالی نمی باشد. همچنین کلیه اخبار و تحلیلهای مندرج در سایت و کانالها، صرفا بازنشر اطلاعات از منابع رسمی و غیر رسمی داخلی و خارجی است و بدیهی است استفاده کنندگان محتوای مذکور، مسئول پیگیری و حصول اطمینان از اصالت و درستی مطالب هستند. از این رو ضمن سلب مسئولیت اعلام میدارد مسئولیت هرنوع تصمیم گیری و اقدام و سود و زیان احتمالی در بازار سرمایه و ارز دیجیتال، با شخص معامله گر است.