تحلیل تکنیکال PHANT0M درباره نماد BTC : توصیه به خرید (۱۴۰۴/۵/۲۹)

PHANT0M
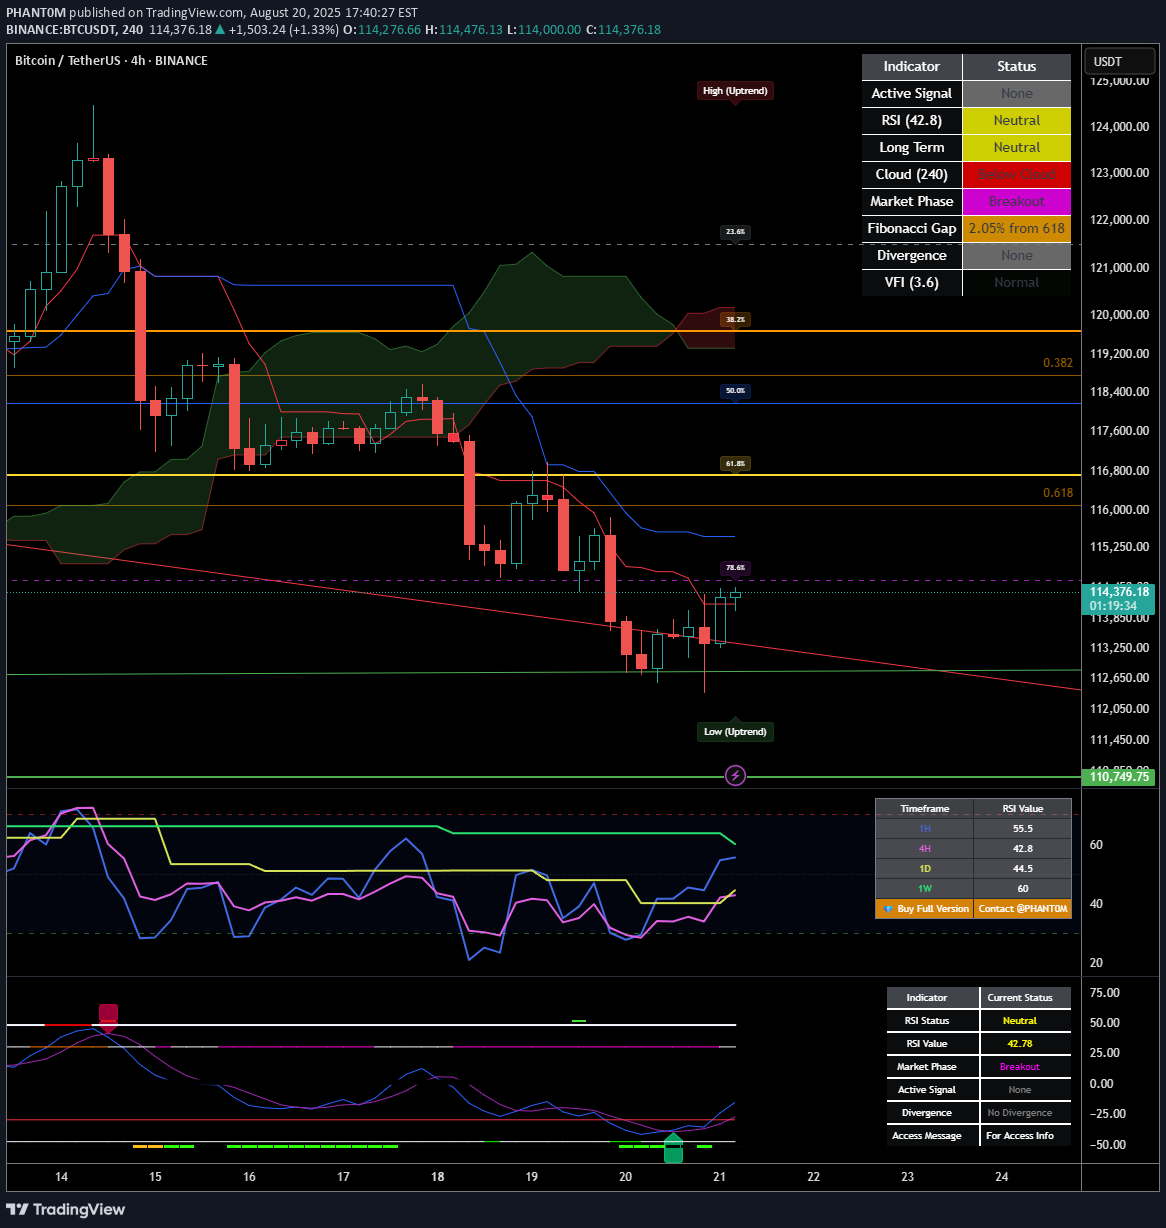
Breaking New Records: Bitcoin's Path Beyond the August Correction With Bitcoin currently trading at $114,352 after reaching its all-time high of $124,474 on August 14, 2025, we find ourselves at a critical technical juncture. Ill examine Bitcoin's potential trajectory through the remainder of 2025. Current Market Context Bitcoin has climbed from around $85,000 in January to establish a new all-time high of $124,474 in mid-August. Following this peak, we've seen a corrective phase with price action forming a potential bull flag pattern between $112,000-$118,000. The most recent data shows Bitcoin trading around $114,352, representing a pullback of approximately 8.13% from the all-time high. This moderate retracement suggests a healthy reset rather than a reversal of the primary trend. Ichimoku Cloud Analysis The Ichimoku Cloud indicators provide critical insights: • Tenkan-sen: $114,127.92 • Kijun-sen: $115,477.50 • Senkou Span A: $119,324.70 • Senkou Span B: $120,176.36 The price is currently trading below the cloud, indicating short-term bearish sentiment. However, the relatively narrow cloud formation ahead suggests potential for a breakout if Bitcoin can reclaim the $119,324-$120,176 range. Wyckoff Analysis The price action following the August peak displays characteristics that align with Wyckoff re-accumulation rather than distribution: • Initial decline represents a "Preliminary Support" phase • Trading range between $112,000-$118,000 shows decreasing volatility • Volume characteristics show diminishing selling pressure • Recent price action suggests we're approaching the "Spring" phase This structure indicates institutional accumulation is still occurring at these elevated levels, projecting a move toward the $132,000-$145,000 range in the coming months. Supply/Demand Zone Analysis Critical price levels that will influence Bitcoin's next directional move: • Major demand zone: $114,600-$116,700 (Fibonacci 61.8%-78.6% retracement) • Secondary support: $111,920-$114,000 (recent low and psychological support) • Primary resistance: $124,474-$127,889 (all-time high region and 127.2% Fibonacci extension) Moving Average Analysis The moving average configuration reveals a strong underlying bullish structure: • 4H EMA 50: $116,284.41 • 4H EMA 100: $116,781.30 • 4H EMA 200: $116,214.57 • Daily EMA 50: $114,939.55 • Daily EMA 100: $110,513.11 • Daily EMA 200: $103,162.36 The hierarchical alignment of these moving averages confirms the primary bull trend remains intact. The current price is finding support near the Daily EMA 50, a critical level that has historically served as a springboard during bull markets. Fibonacci Extension Framework Potential targets using Fibonacci extensions from the recent swing points: • 127.2% extension: $127,889 • 161.8% extension: $132,232 • 200% extension: $137,028 • 261.8% extension: $144,786 Elliott Wave Analysis The current price action suggests an extended wave structure: • Wave 1 high (ATH): $124,474 • Wave 2 low (Recent Low): $111,920 • Wave 3 target range: $144,786 to $157,340 • Wave 4 target: $132,231 • Wave 5 target range: $152,545 to $165,100 This wave count suggests potential for continued appreciation toward the $152,000-$165,000 range before a more significant corrective phase begins. Bitcoin Dominance Factor Bitcoin's market dominance currently stands at 59.3%, indicating a strong position relative to the broader cryptocurrency market, providing additional support for the bullish case. Price Projection Timeline August-September 2025: Completion of the current consolidation phase with potential final support tests in the $114,600-$116,700 range. A decisive break above $120,000 would confirm the end of the consolidation phase. October 2025: Renewed momentum pushing Bitcoin toward the $127,889-$132,232 range, potentially coinciding with seasonal strength typically observed in Q4. November-December 2025: Final wave extension potentially reaching the $144,786-$157,340 range, followed by a Wave 4 correction before the final Wave 5 push toward $152,545-$165,100 by year-end or early 2026. Key Levels to Monitor Support Zones: • Primary: $114,600-$116,700 (Fibonacci retracement zone) • Secondary: $111,920-$114,000 (recent low and psychological support) • Tertiary: $103,162-$110,513 (Daily EMA 100-200 zone) Resistance Zones: • Immediate: $119,324-$120,176 (Ichimoku Cloud base) • Secondary: $124,474-$127,889 (all-time high region and 127.2% Fibonacci extension) • Target 1: $132,232-$137,028 (161.8%-200% Fibonacci extensions) • Target 2: $144,786-$157,340 (Wave 3 target range) • Target 3: $152,545-$165,100 (Wave 5 target range) Strategic Considerations With Bitcoin having already achieved a new all-time high at $124,474 in August, strategic approaches might include: • Maintaining core positions while implementing trailing stop strategies • Adding to positions during retests of key support levels ($114,600-$116,700) • Considering partial profit-taking at key Fibonacci extension levels • Remaining vigilant for signs of distribution patterns at higher levels Conclusion: The Path to $165,000 The weight of technical evidence suggests Bitcoin has entered a new paradigm of price discovery. While the path may include periods of consolidation and volatility, the underlying trend remains firmly bullish with multiple technical frameworks projecting targets in the $152,000-$165,000 range by year-end 2025 or early 2026. The current correction phase represents a healthy reset rather than a trend reversal, creating an ideal technical foundation for Bitcoin's next major advance. Bitcoin appears well-positioned to achieve new record highs in the coming months.
