تحلیل تکنیکال Magister_Arcanvm درباره نماد BTC : توصیه به خرید (۱۴۰۴/۴/۲۸)

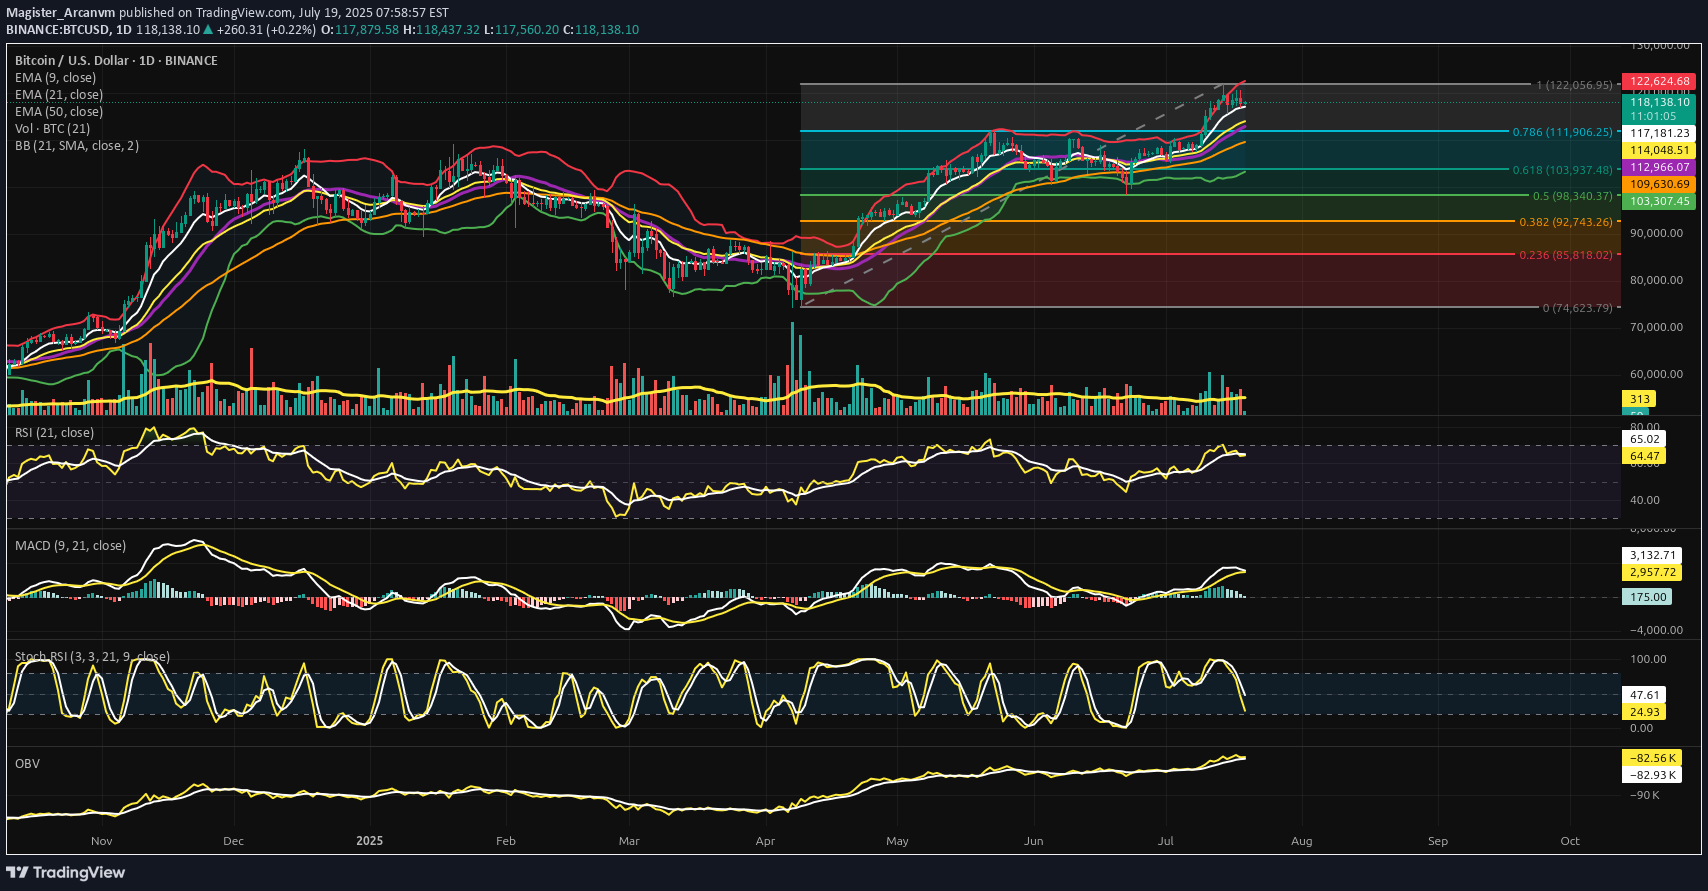
⊢ BTC/USD – BINANCE – (CHART: 1D) – (July 19, 2025). ◇ Analysis Price: $118,325.31 ⊣ ⨀ I. Temporal Axis - Strategic Interval - (1D): ▦ EMA9 - (Exponential Moving Average - 9 Close): ∴ Price is currently positioned above EMA9 at $117,218.67, confirming immediate bullish alignment; ∴ EMA9 is upward sloping and tightly hugging price candles, serving as the dominant intraday dynamic support; ∴ Every recent dip has been absorbed above or at EMA9, with no candle body close below it in the last 7 sessions. ✴️ Conclusion: Logic sealed - EMA9 holds command over short-term price structure; tactical momentum remains alive. ⊢ ▦ EMA21 - (Exponential Moving Average - 21 Close): ∴ EMA21 currently rests at $114,658.53, forming the median layer of structural trend guidance; ∴ Price action remains significantly elevated above this level, showing that bulls retain medium-range control; ∴ EMA21 has not been tested since late June, reflecting a strong upside deviation from equilibrium. ✴️ Conclusion: Logic sealed - EMA21 serves as untested trend backbone; control remains firmly in favor of buyers. ⊢ ▦ EMA50 - (Exponential Moving Average - 50 Close): ∴ EMA50 is currently located at $109,638.03, tracking long-range structural health; ∴ The moving average is gradually steepening, suggesting long-term strength and momentum acceleration; ∴ No violations or shadows have tested EMA50 since early May - reinforcing its strength as deep support. ✴️ Conclusion: Logic sealed - EMA50 anchors the structural uptrend; market remains far from long-term threat zone. ⊢ ▦ Fibonacci Retracement – (1 = $122,056.95 / 0 = $74,623.79): ∴ The full Fibonacci range spans from the April low at $74,623.79 (0.0) to the July high at $122,056.95 (1.0) - anchoring the complete structure of the current macro move; ∴ Price is now positioned at $118,325.31, precisely above the 0.786 retracement level at $111,906.25, and beneath the 1.0 top - this zone represents the “golden upper quadrant,” a region where euphoria meets exhaustion; ∴ The 0.618 level ($103,937.45) remains untouched since early June, acting as the gravitational pull of equilibrium - its preservation confirms that no structural breakdown has occurred; ✦ Additional Level Mapping: • 0.500 - $98,340.37: The neutral midpoint, remains far below - unchallenged; • 0.382 - $92,743.26: The "warning belt" for medium-term trend decay; • 0.236 - $85,818.02: A deep corrective zone, untouched and far from current price. ∴ Multiple zones of confluence exist between EMA21, BB midline, and 0.786, forming a strategic consolidation platform in the current price region; ∴ Failure to reclaim above 1.0 extension suggests bulls may be entering exhaustion while still structurally intact. ✴️ Conclusion: Logic sealed - price is trapped in the Fibonacci Gate (0.786 – 1.0); breakout requires decisive volume or reversion to golden support. ⊢ ▦ Bollinger Bands - (SMA21 / 2 Standard Deviations): ∴ The current Bollinger structure shows band expansion, not contraction - upper band is at $122,653.00, lower band at $103,296.96, midline (SMA21) at $112,974.98; ∴ Price is moving above the midline, but no longer hugging the upper band - signaling that explosive momentum has waned while structure remains bullish; ∴ Last major push toward the upper band resulted in rejection near $122k, followed by sideways compression - implying the bands are preparing to resolve a volatility coil; ✦ Interpretative Observations: • The midline (SMA21) is converging with the EMA21 and 0.786 Fib, forming a triple convergence layer - a key strategic battlefield; • The distance between bands is approximately $19,356, indicating elevated volatility, but not chaos - directional tension remains unresolved; • Band curvature suggests no imminent squeeze, but a potential for re-expansion if price reclaims upper territory. ∴ This structure shows a calm above chaos - volatility is present, but muted by the upper Fibonacci gate and internal exhaustion. ✴️ Conclusion: Logic sealed - volatility bands are wide and reactive, signaling buildup pressure; the next directional breach will likely define the next 30-day trend. ⊢ ▦ Volume + EMA21 - (Volume Activity and Trend Average): ∴ The latest daily volume candle stands at 312 (unit scale), notably below the Volume EMA21, which trends around 418 - indicating waning participation post-breakout; ∴ The most recent breakout above $120k was accompanied by a singular spike in volume, followed by five consecutive days of volume decay - a typical exhaustion profile without follow-through; ∴ There has been no bullish volume expansion to defend price levels above $118k, suggesting that the upward move is unsupported by fresh demand; ✦ Tactical Observations: • Volume is currently below the average trend line, which implies a lack of conviction on both sides - a vacuum state; • The EMA21 of volume acts as a barometer of trend health - its breach to the downside indicates structural weakening beneath a seemingly bullish price; • The low volume + high price condition signals silent divergence, often a precursor to compression, reversal, or manipulation. ∴ Price is elevated but unsupported, indicating the presence of “surface strength, internal fragility.” ✴️ Conclusion: Logic sealed - declining volume below trend average confirms demand fatigue; continuation is suspect without new influx. ⊢ ▦ RSI (21) + EMA9 - (Relative Strength Index with Signal Smoothing): ∴ The RSI (21) reads at 64.72, having pulled back from a recent high near 74, suggesting a transition from euphoric thrust to reflective consolidation; ∴ The RSI line has dipped below its EMA9 signal, forming a soft negative crossover, typically interpreted as a waning of short-term momentum; ∴ Despite the loss of angle, RSI remains comfortably above the 50-line, which acts as the threshold between bullish continuation and structural deterioration; ✦ Interpretative Layers: • The EMA9 of RSI functions here as a short-term momentum oscillator overlay - its breach confirms weakening, not reversal; • RSI holding above 60 implies the presence of continued buy-side pressure - though fading; • The divergence between price (near high range) and RSI (descending) establishes the groundwork for potential hidden weakness. ∴ RSI shows the archetype of a post-breakout exhaustion slope, yet refuses to break structurally - a signal of suspended momentum, not decay. ✴️ Conclusion: Logic sealed - momentum is cooling but not reversing; bulls remain structurally in control while energy dissipates. ⊢ ▦ Stochastic RSI (3,3,21,9) - (Momentum Cycle Oscillator): ∴ The current values are: %K = 26.27, %D = 48.05 - showing a completed bearish crossover, with %K trailing beneath %D; ∴ The oscillator has already dipped into oversold (<20) and is now rebounding, yet fails to regain dominance over the signal line - this marks a failed bullish recovery pattern; ∴ Recent structure shows multiple failed attempts to reclaim high-band cycles, indicating that short-term traders are exiting, while major holders observe; ✦ Tactical Interpretations: • The system has transitioned from bullish impulsive to corrective reflective - momentum is coiling instead of thrusting; • The flattening of %D around the midline reflects indecision in micro-timeframe velocity; • The double-rejection of %K near 80 last week forms a tactical top signal under stochastic doctrine. ∴ This oscillator, sensitive to short-term flows, declares the loss of tactical initiative by the bulls. ✴️ Conclusion: Logic sealed - short-term momentum cycle is decaying; the structure now favors consolidation or soft pullback. ⊢ ▦ MACD (9,21) - (Moving Average Convergence Divergence): ∴ Current MACD line: (+2,961.80), Signal line: (+3,153.14) - indicating an active bearish crossover, as the MACD line has dropped below the signal; ∴ Histogram bars are negative and expanding, a key sign that downward momentum is growing, even as price remains elevated; ∴ This crossover has occurred at a relatively high amplitude, meaning the pullback potential is non-trivial - it is not a shallow fluctuation, but a structural transition; ✦ Structural Implications: • The bearish crossover happened after divergence with price action - while Bitcoin reached new highs, MACD momentum did not, forming a classical bearish divergence; • Momentum began decaying several sessions before price peaked - the indicator warned of exhaustion before price responded; • The slope of the MACD line has steepened downward - a sign of gathering corrective force. ∴ This marks the first true warning from the momentum engine beneath the price - a shift from thrust to counter-pressure. ✴️ Conclusion: Logic sealed - MACD confirms structural momentum exhaustion; corrective forces are now in motion, though price has yet to reflect full impact. ⊢ ▦ OBV + EMA9 - (On-Balance Volume with Trend Smoothing): ∴ Current OBV stands at (–82.93K), now below its EMA9, which reads (–82.57K) - indicating a loss of volume-weighted trend force from the buyers; ∴ While price remains elevated, OBV has been descending gradually, forming a clear bearish divergence between volume flow and price action; ∴ Over the last 7 daily sessions, OBV has failed to form any new high - even as BTC printed a new price peak - revealing that volume is silently exiting the market; ✦ Interpretative Reading: • OBV below EMA9 confirms that cumulative volume pressure is negative - this undermines surface-level price strength; • Divergence with price often precedes major pivot zones - the “hidden drain” effect; • The OBV curve is now sloping downward with consistency, indicating that larger hands may be distributing while price remains deceptive. ∴ This structure carries the seal of silent distribution, a hallmark of late-cycle phases in bullish trends. ✴️ Conclusion: Logic sealed - OBV confirms internal outflow; market strength is no longer aligned with volume reality. ⊢ 🜎 Strategic Insight – Technical Oracle: ∴ The 1D structural framework remains formally bullish, as price holds firmly above all exponential anchors (EMA9, 21, 50) and resides within the golden quadrant of the Fibonacci matrix; ∴ However, a triad of momentum signals - MACD, Stochastic RSI, and OBV - are all flashing early warnings of underlying exhaustion; ∴ The market breathes the air of height, yet the blood of energy runs thin; ∴ Volume no longer fuels ascent - momentum coils, not climbs; ∴ The surface remains calm, but the substructure contracts in silence; ∴ This is a phase of strategic suspension; ∴ Not yet a reversal - but no longer thrusting forward; ∴ A condition of uptrend fatigue, awaiting external force or internal reset. ✴️ Conclusion: The Oracle speaks - the trend is structurally preserved, but internally untrustworthy. The next move, when it comes, will be definitive. ⊢ ▦ Structurally: Bullish. ∴ Price remains well above EMA50, EMA21, and EMA9; ∴ No bearish cross has occurred; ∴ Structure is elevated within upper Fibonacci zones - not broken. ⊢ ▦ Momentum-wise: Bearish Divergence. ∴ MACD has crossed bearishly; ∴ OBV is declining despite price holding high; ∴ RSI and Stoch RSI confirm exhaustion. ⊢ ✴️ Final Codex Interpretation: ∴ Structurally Bullish - Tactically Suspended; ∴ The frame holds, but the fuel has faded; ∴ Bulls possess the hilltop - but lack fire to advance; ∴ A breach or retreat shall define the next archetype. ⊢ ⧉ · Cryptorvm Dominvs · MAGISTER ARCANVM · Vox Primordialis · ⚜️ ⌬ - Wisdom begins in silence. Precision unfolds in strategy - ⌬ ⚜️ ⧉ ⊢
