
zahid_iqbal6220
@t_zahid_iqbal6220

What symbols does the trader recommend buying?
Purchase History
پیام های تریدر
Filter
zahid_iqbal6220
خرید فوری بیت کوین کش (BCH): سیگنال صعودی قوی در سطح ۵۷۲ دلار!
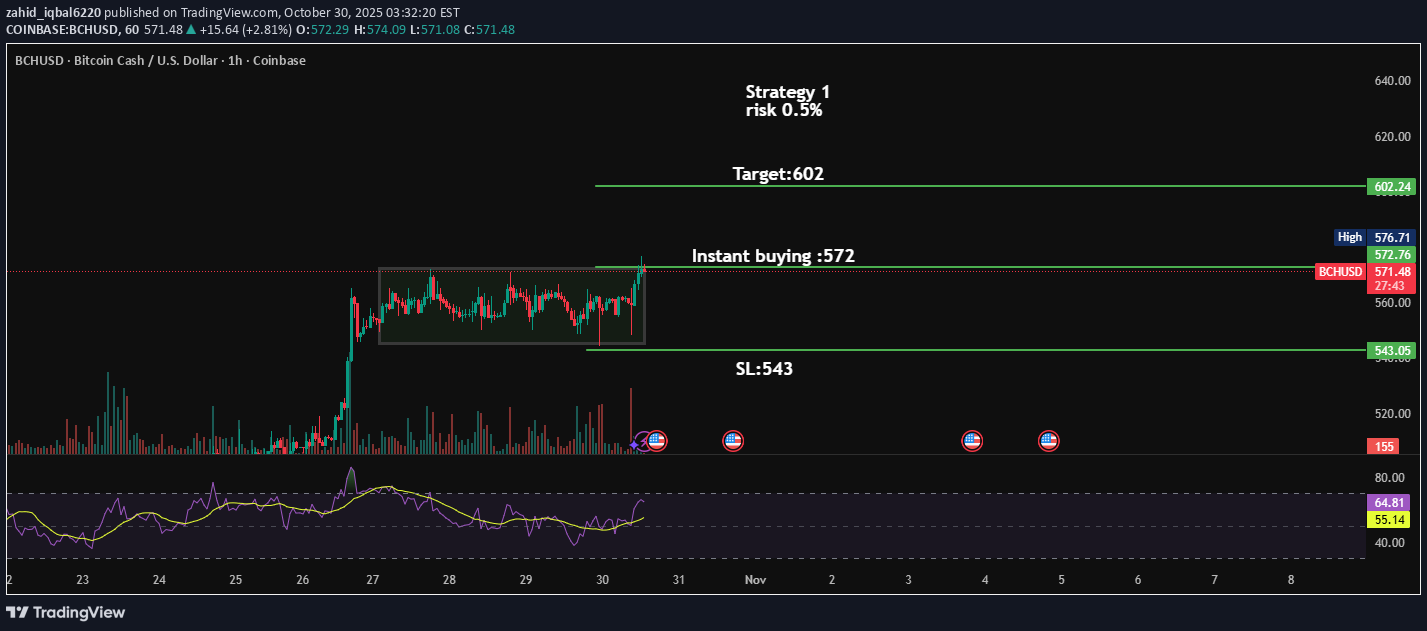
Instant Buying: 572 The chart shows BCH consolidating inside a horizontal range (a box) between roughly 543 and 572. The current candle has broken above the range resistance (~572) — signaling a potential breakout. That’s why “Instant buying” is suggested at 572.
zahid_iqbal6220
تحلیل طلای جهانی (XAUUSD): سیگنال صعودی قوی با الگوی کف دوقلو و واگرایی مثبت RSI!
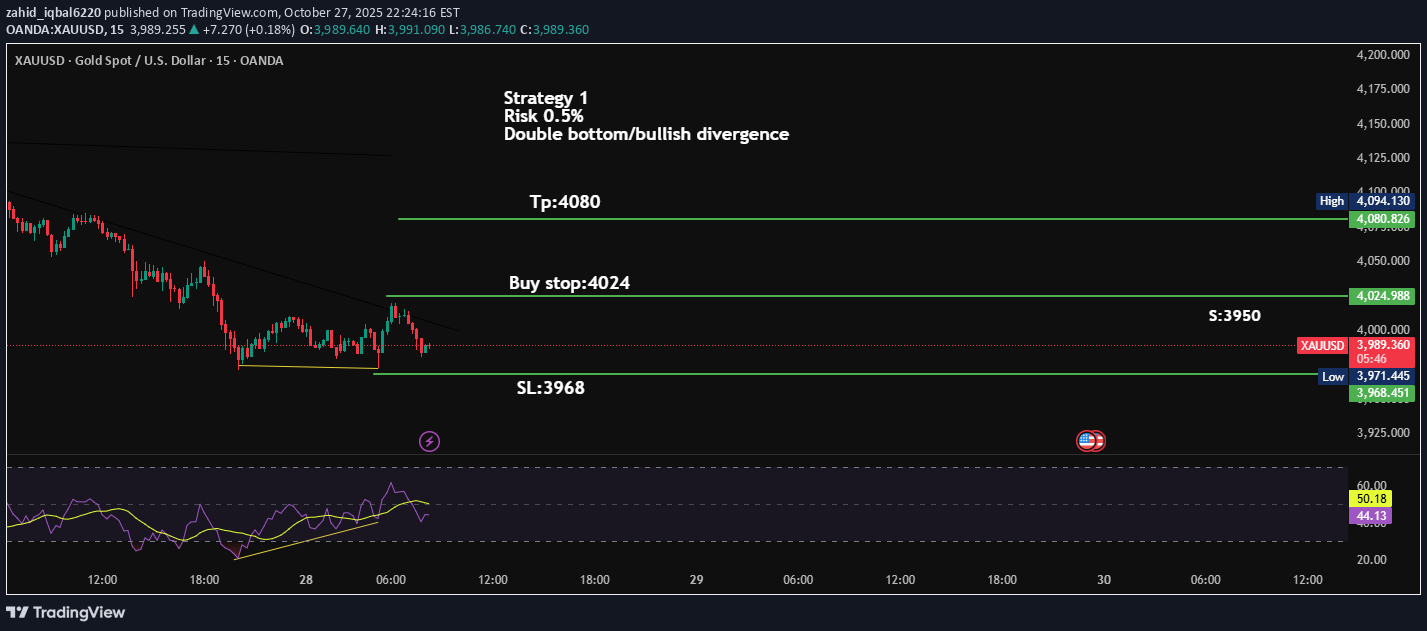
Double Bottom Pattern Bullish Divergence (RSI) Wait for price to break above 4024 The setup aims to catch the breakout from a bullish reversal zone confirmed by RSI and structure.
zahid_iqbal6220
تحلیل دقیق اتریوم: سیگنال فروش اتوماتیک در 4085 و نقاط خروج سود و ضرر
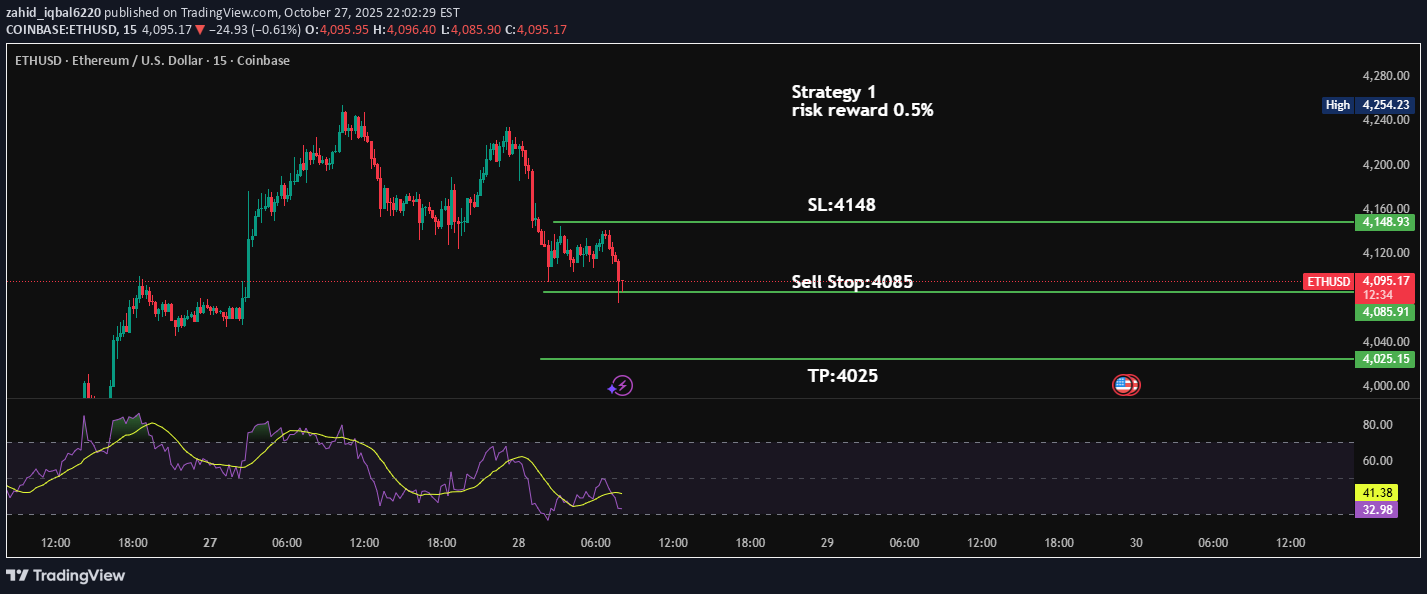
Wait for ETH to reach 4085 (entry trigger). If it does, the short position opens automatically. If price falls to 4025, trade closes in profit. If price rises to 4148, trade closes in loss.
zahid_iqbal6220
تحلیل فوری ریپل (XRP/USD): سیگنال فروش قوی با اهداف و حد ضرر دقیق!
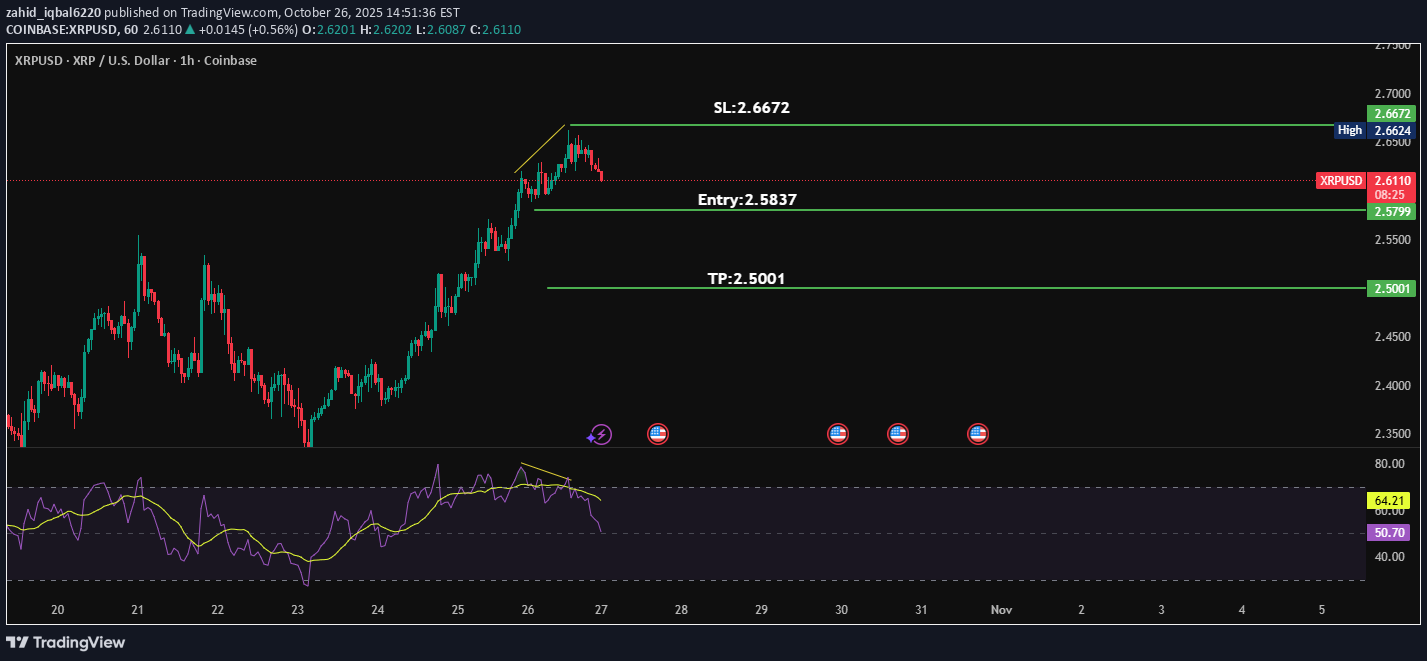
🧠 Chart Summary Pair: XRP/USD Timeframe: 1 Hour Type of setup: Bearish divergence. Entry Level – 2.5837 This is where you plan to enter a short position (sell). It’s below the current price, which means you’re waiting for confirmation of a downward move before entering. A candle closing below this level would confirm the breakdown and the start of bearish momentum. Stop Loss (SL) – 2.6672 This is your protection level if the trade goes wrong. If price moves above this level, the bearish setup is invalidated — it shows bulls have regained control. Take Profit (TP) – 2.5001
zahid_iqbal6220
طلا (XAUUSD) در دوراهی حساس: صعود به ۴۳۰۰ یا سقوط به ۳۸۰۰؟
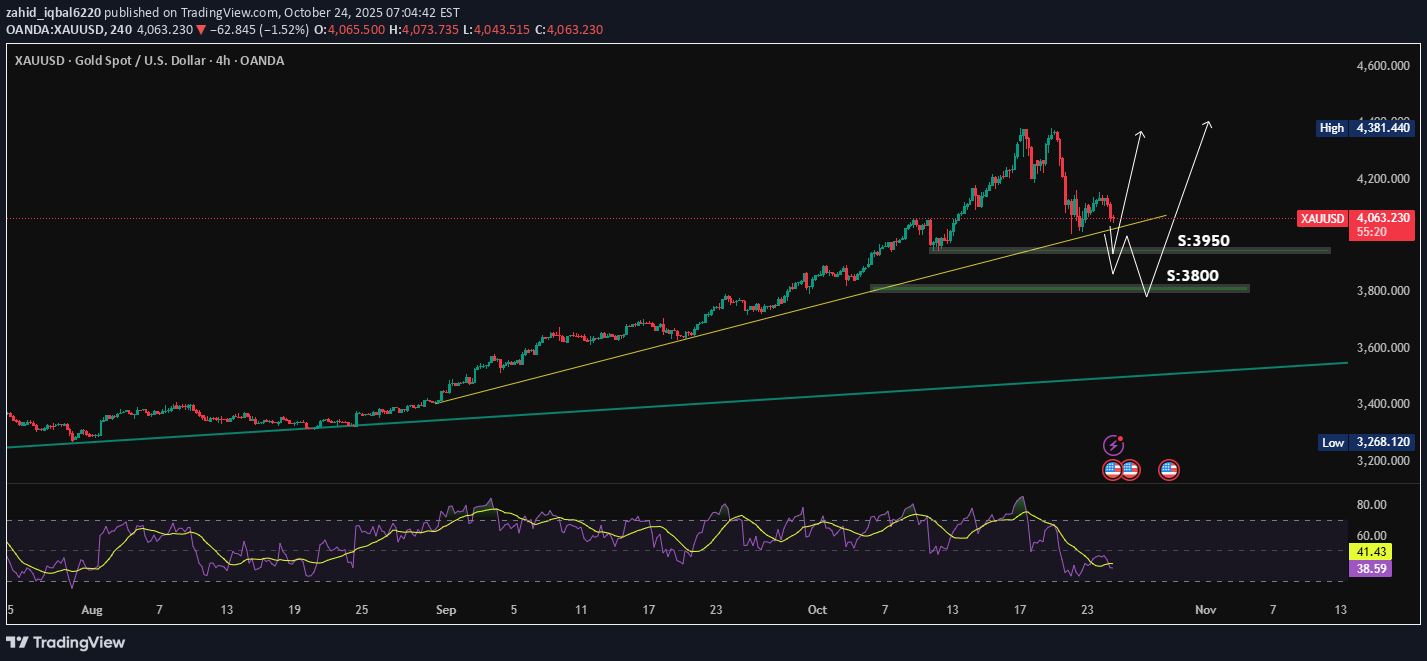
Two Possible Scenarios (White Arrows) Scenario 1: Bullish Bounce from 3950 Price tests 3950 support and respects the trendline. If buyers step in here → uptrend continues. Target could be back toward 4300–4380 (previous highs). Scenario 2: Deeper Correction to 3800 If 3950 breaks with strong bearish candles → next support is 3800. Price may consolidate or form a double bottom there. From 3800, a strong bounce upward is expected — continuation of the major bullish trend
zahid_iqbal6220
تحلیل بیت کوین: دو سناریوی حیاتی برای خرید و هدف ۱٤۵,۰۰۰ دلاری!
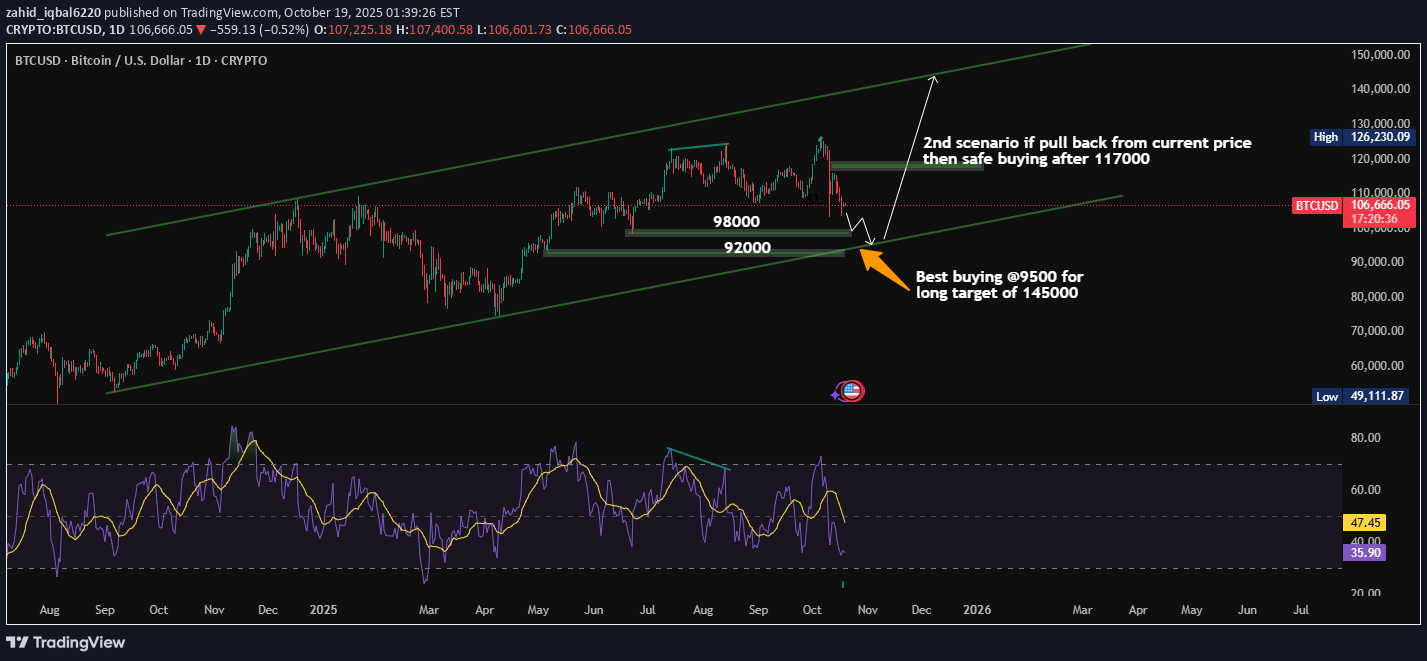
1️⃣ Scenario 1 — Deeper Pullback → Best Buying Zone Support levels highlighted: First support: $98,000 Second support: $92,000 Best buying zone: around $95,000 ± ($92k–$98k range) Reasoning: The price is still respecting the ascending channel (green lines). A drop toward the lower trendline support aligns with both structure and RSI oversold levels. RSI near 36 suggests potential for reversal after more downside. Trade idea: → Buy around $95,000 → Target = $145,000 (upper channel resistance) → This is a swing or long-term setup. 2️⃣ Scenario 2 — Immediate Recovery from Current Zone If Bitcoin pulls back up from current price (~$106,000) instead of dropping deeper: Wait for confirmation above $117,000 before entering. That would signal a safe long re-entry as price reclaims mid-channel support. Trade idea: → Buy above $117,000 (confirmation breakout) → Target = $126,000–$145,000
zahid_iqbal6220
تحلیل تکنیکال فوری اتریوم (ETH/USD): شکست خط مقاومت ۳۹۵۰ و مسیر صعودی احتمالی!
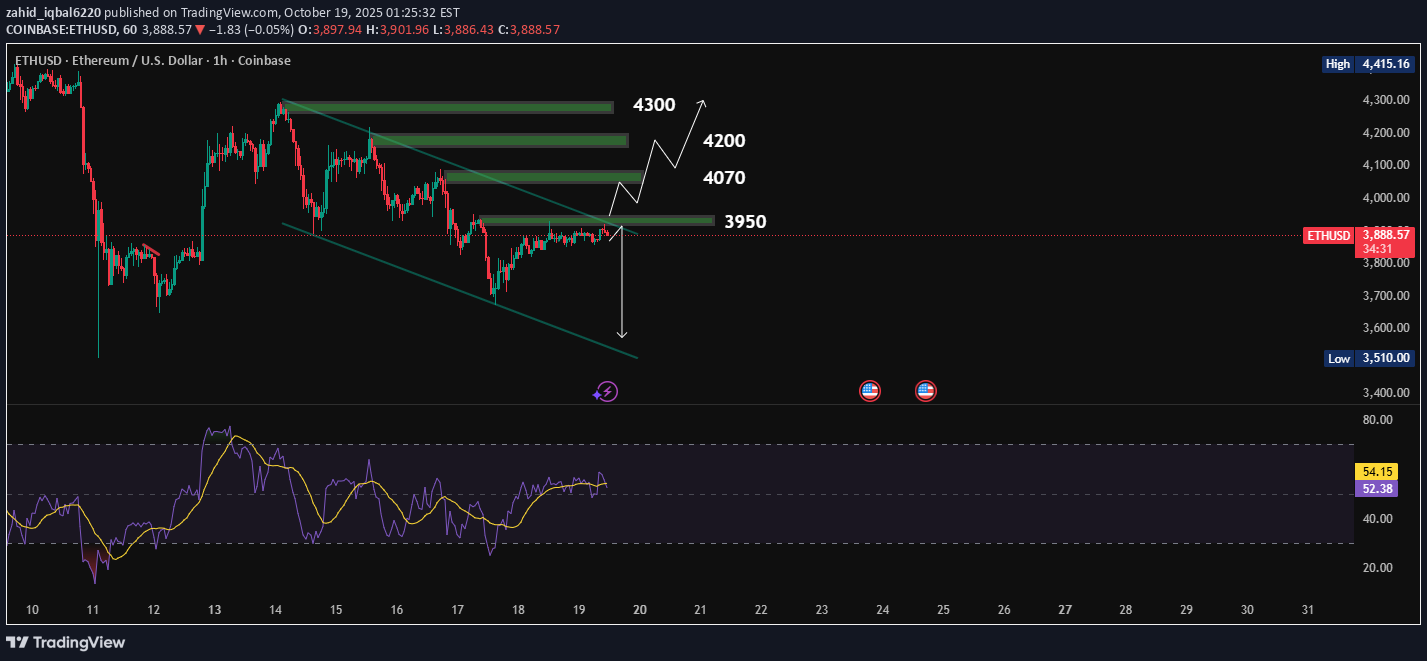
This is a technical analysis chart for ETH/USD (Ethereum to US Dollar) on the 1-hour timeframe, showing a possible breakout scenario from Channel. ⚔️ Key Levels & Zones: 1. 3950 – Breakout Level: This is the key resistance level. If ETH can break and hold above 3950, it confirms a breakout from the wedge. Bullish continuation is likely after this breakout. 2. 4070, 4200, 4300 – Target Zones: These are potential resistance zones or take-profit levels after a confirmed breakout. Each level is a zone of historical price reaction (support/resistance or consolidation). 3. Breakdown Scenario: If ETH fails to break 3950 and breaks below the lower trendline, a bearish breakdown could occur. This would invalidate the wedge and could lead to a drop back toward 3510 or lower.
zahid_iqbal6220
تحلیل طلا (XAUUSD): سیگنال صعودی کوتاه مدت | قیمت تا کجا بالا میرود؟
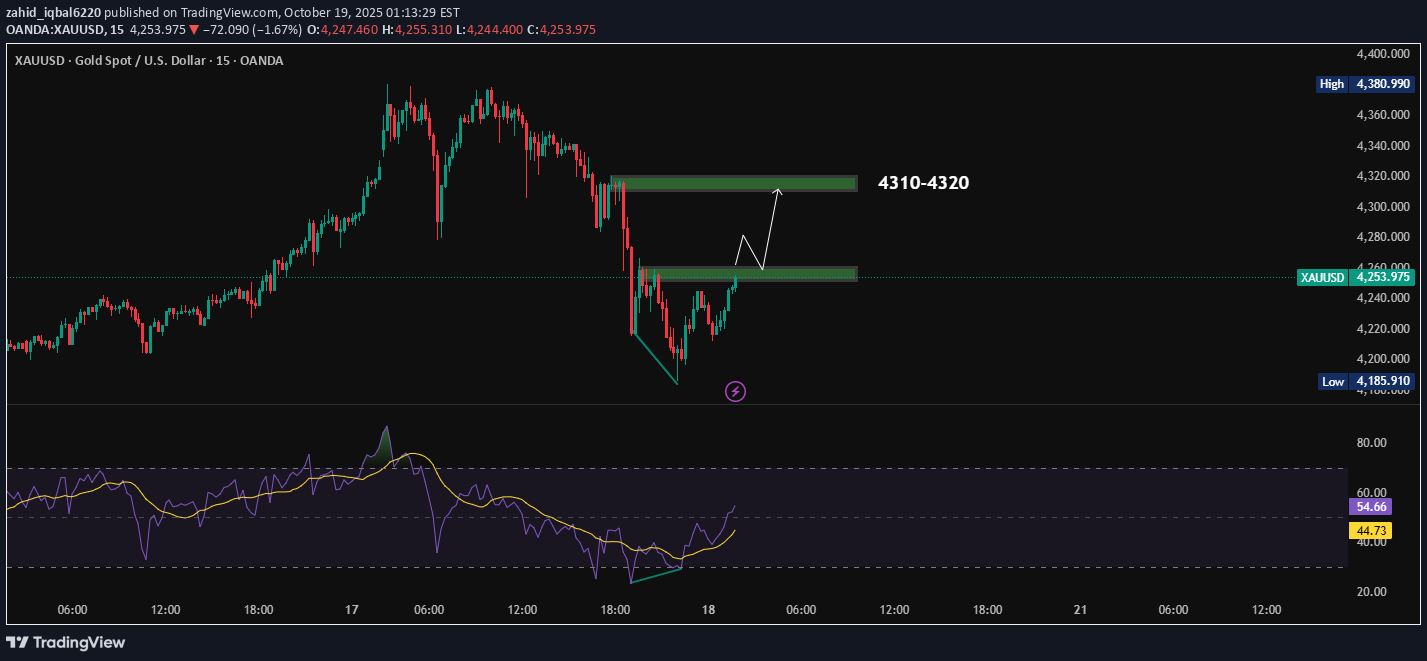
This chart is a 15-minute candlestick chart for XAU/USD (Gold Spot against the US Dollar), with technical analysis applied to predict a potential short-term bullish move. Here's a breakdown of the key components: A reversal pattern is forming. Bullish RSI divergence supports upward momentum. A break above 4255 could send price to 4310–4320. Key Action for Traders: Watch for a clean break and retest of the 4255 zone with bullish confirmation before entering a long position aiming for the 4310–4320 target.
zahid_iqbal6220
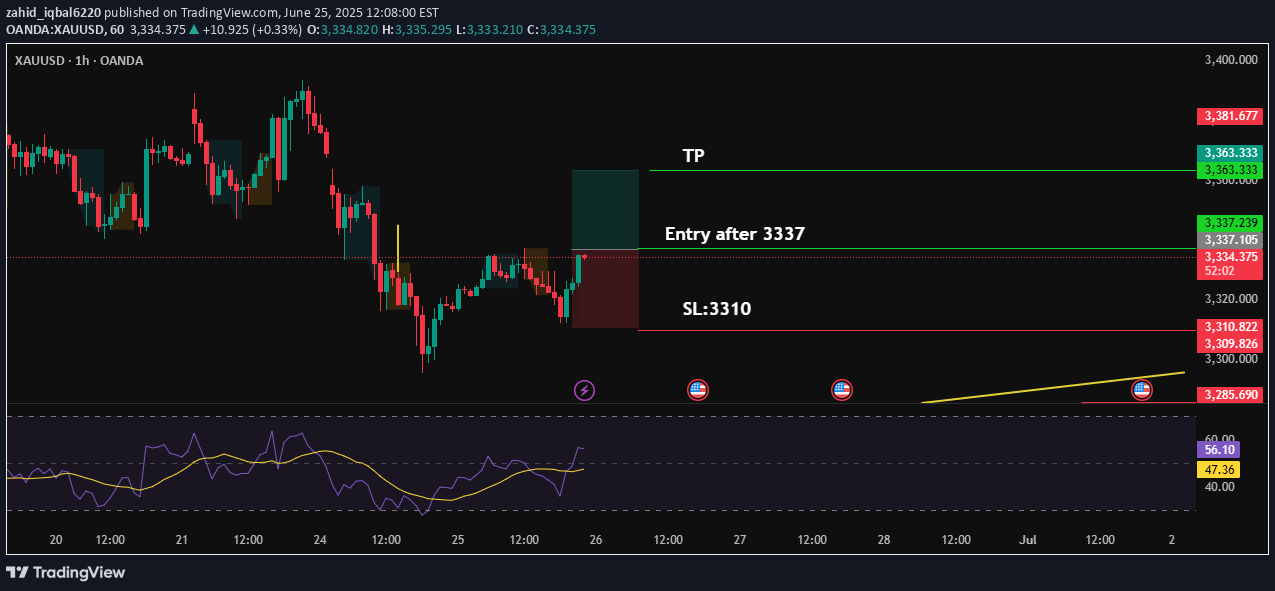
GOLD 15Min analysisTake entry as mentioned if breaks previous price level
zahid_iqbal6220
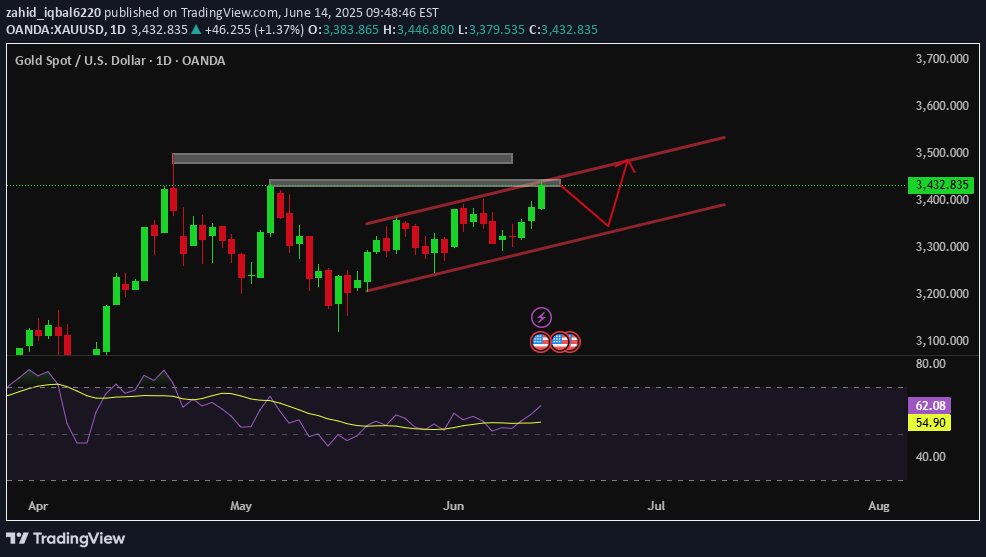
GOLD DTF analysisThere was a previous peak around the same level (late April / early May), which creates the potential for a double top, but:No bearish rejection candle is visible.No bearish divergence on RSI.RSI is actually above 60, showing bullish momentum.Price respected the lower channel line and is bouncing back.Possible short-term pullback toward channel bottom for retracement if does not breaks 3447 level.
Disclaimer
Any content and materials included in Sahmeto's website and official communication channels are a compilation of personal opinions and analyses and are not binding. They do not constitute any recommendation for buying, selling, entering or exiting the stock market and cryptocurrency market. Also, all news and analyses included in the website and channels are merely republished information from official and unofficial domestic and foreign sources, and it is obvious that users of the said content are responsible for following up and ensuring the authenticity and accuracy of the materials. Therefore, while disclaiming responsibility, it is declared that the responsibility for any decision-making, action, and potential profit and loss in the capital market and cryptocurrency market lies with the trader.