Technical analysis by zahid_iqbal6220 about Symbol ETH on 10/19/2025

zahid_iqbal6220
تحلیل تکنیکال فوری اتریوم (ETH/USD): شکست خط مقاومت ۳۹۵۰ و مسیر صعودی احتمالی!
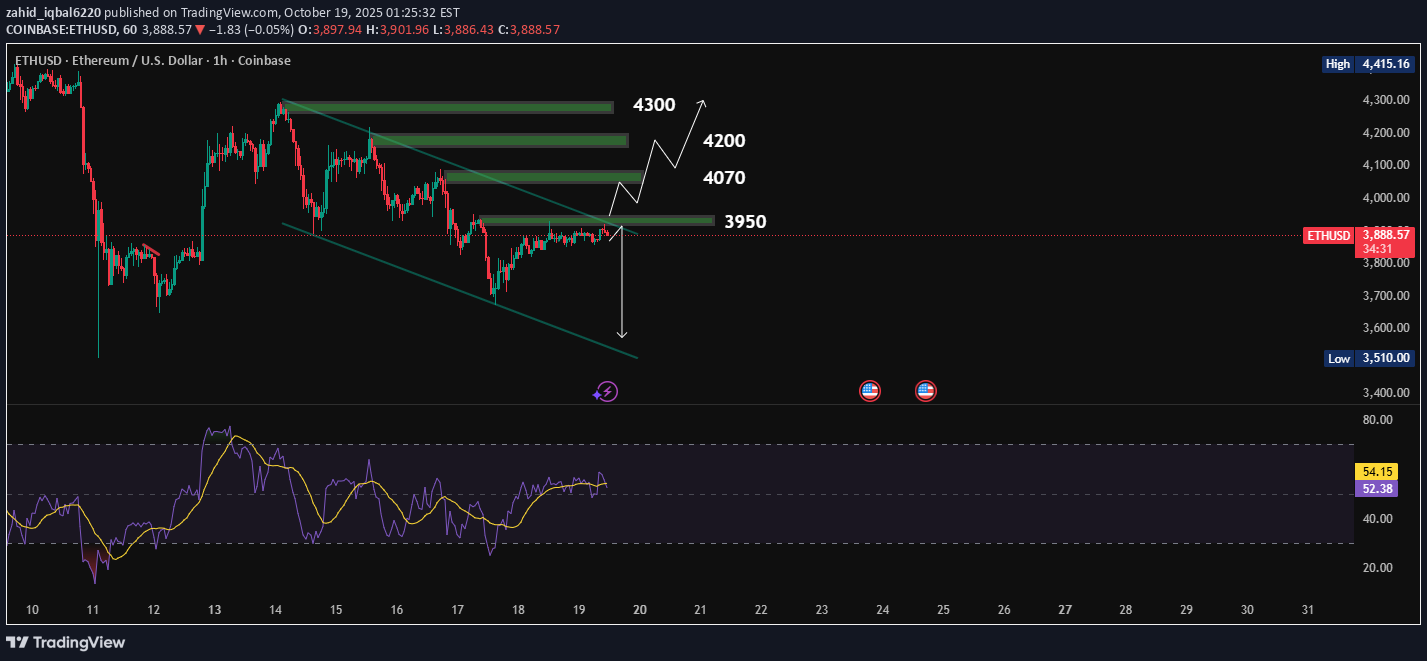
This is a technical analysis chart for ETH/USD (Ethereum to US Dollar) on the 1-hour timeframe, showing a possible breakout scenario from Channel. ⚔️ Key Levels & Zones: 1. 3950 – Breakout Level: This is the key resistance level. If ETH can break and hold above 3950, it confirms a breakout from the wedge. Bullish continuation is likely after this breakout. 2. 4070, 4200, 4300 – Target Zones: These are potential resistance zones or take-profit levels after a confirmed breakout. Each level is a zone of historical price reaction (support/resistance or consolidation). 3. Breakdown Scenario: If ETH fails to break 3950 and breaks below the lower trendline, a bearish breakdown could occur. This would invalidate the wedge and could lead to a drop back toward 3510 or lower.