
yekarakuss
@t_yekarakuss

What symbols does the trader recommend buying?
Purchase History
پیام های تریدر
Filter
yekarakuss
اتریوم پس از دستکاری قیمت: سیگنال صعود قدرتمند به سمت ۳۶۵۰ دلار!
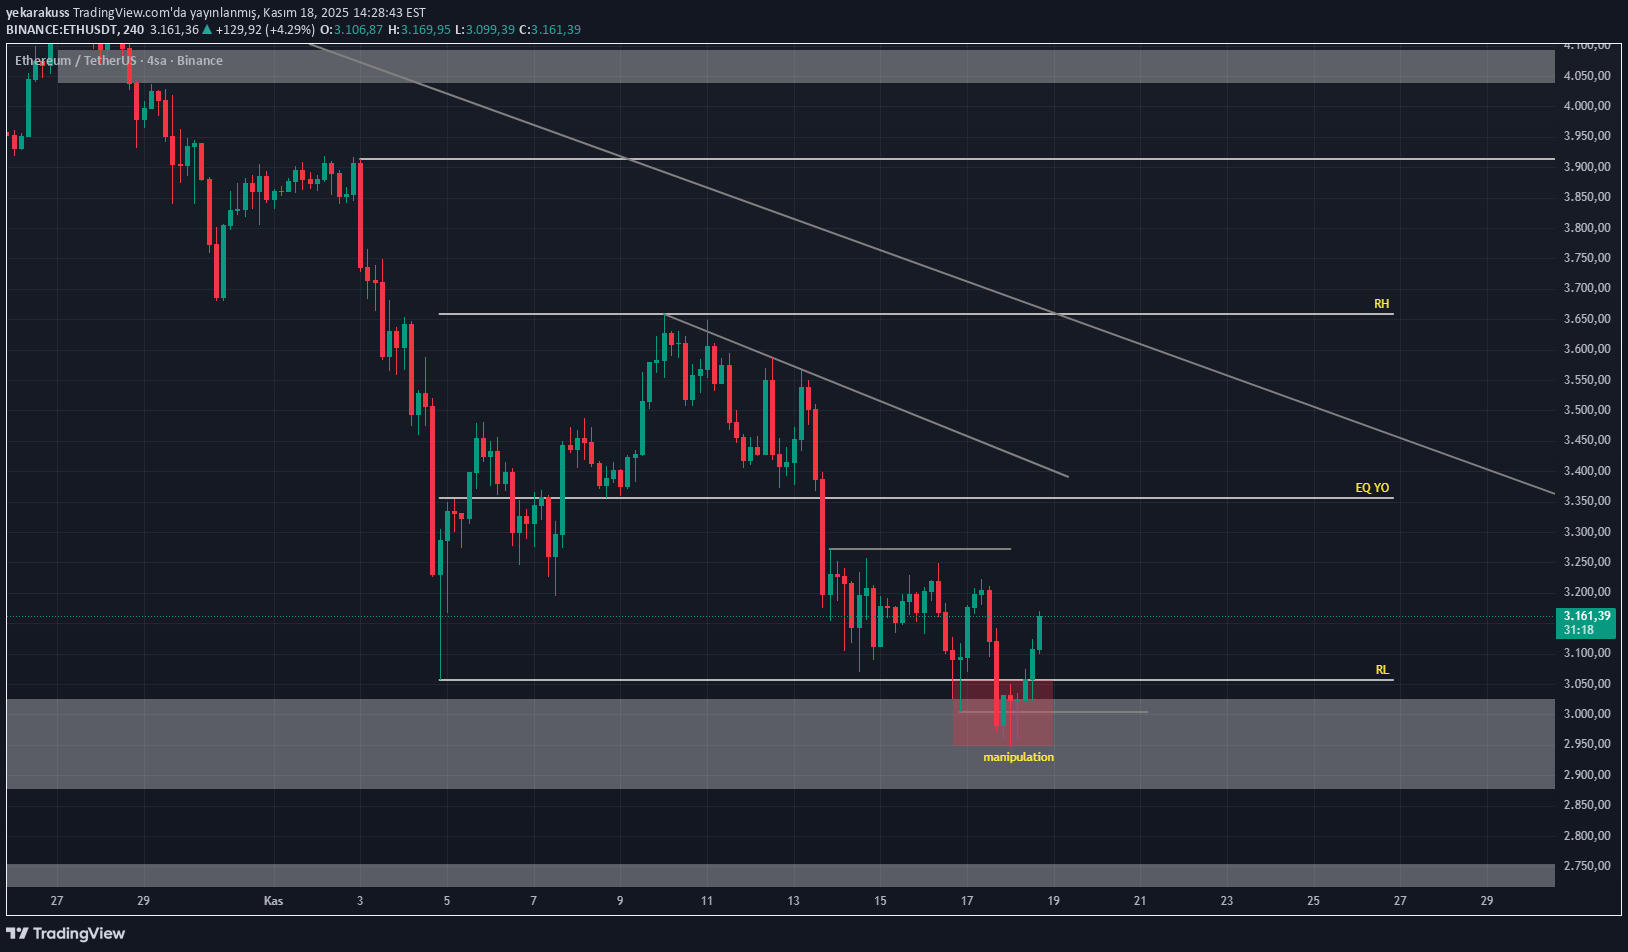
accumulation The price was stuck in the 3000–3050 band for a long time, creating an accumulation area. The wicks made downwards from this region and the last bottom cleaning are marked as "manipulation" on the chart. manipulation The price fell below the RL level, hunting stops and collecting short-term liquidity. It then made a comeback with a strong green candle, confirming the manipulation. This movement shows that the manipulation phase, which is the second phase of the PO3 formation, has been completed successfully. distribution If the price continues this structure with confirmation, the next targets are: EQ YO (Equal Range / Mid) – $3350 region This is the first serious testing area for the price to transition into the distribution phase. RH – $3650 region It stands out as a liquidity target. This area formed by the upper wicks is the ideal region for "distribution" in the PO3 structure. Major Time Frame Trend Line The main falling trend line coming from the top is still active. Therefore, the movement towards the 3350–3500 region will be critical for the trend break. In conclusion; The manipulation phase of the PO3 formation in Ethereum has been completed. In order for the structure to remain active, the price must not fall below $3000 again. Persistence above this may lead to first the 3200–3300, then 3350 and upper liquidity target 3650 regions. Closings below $3000 disrupt the structure and increase bearish pressure again.
yekarakuss
نقشه راه بیت کوین: از انباشت تا صعود انفجاری (تحلیل ساختار PO3)
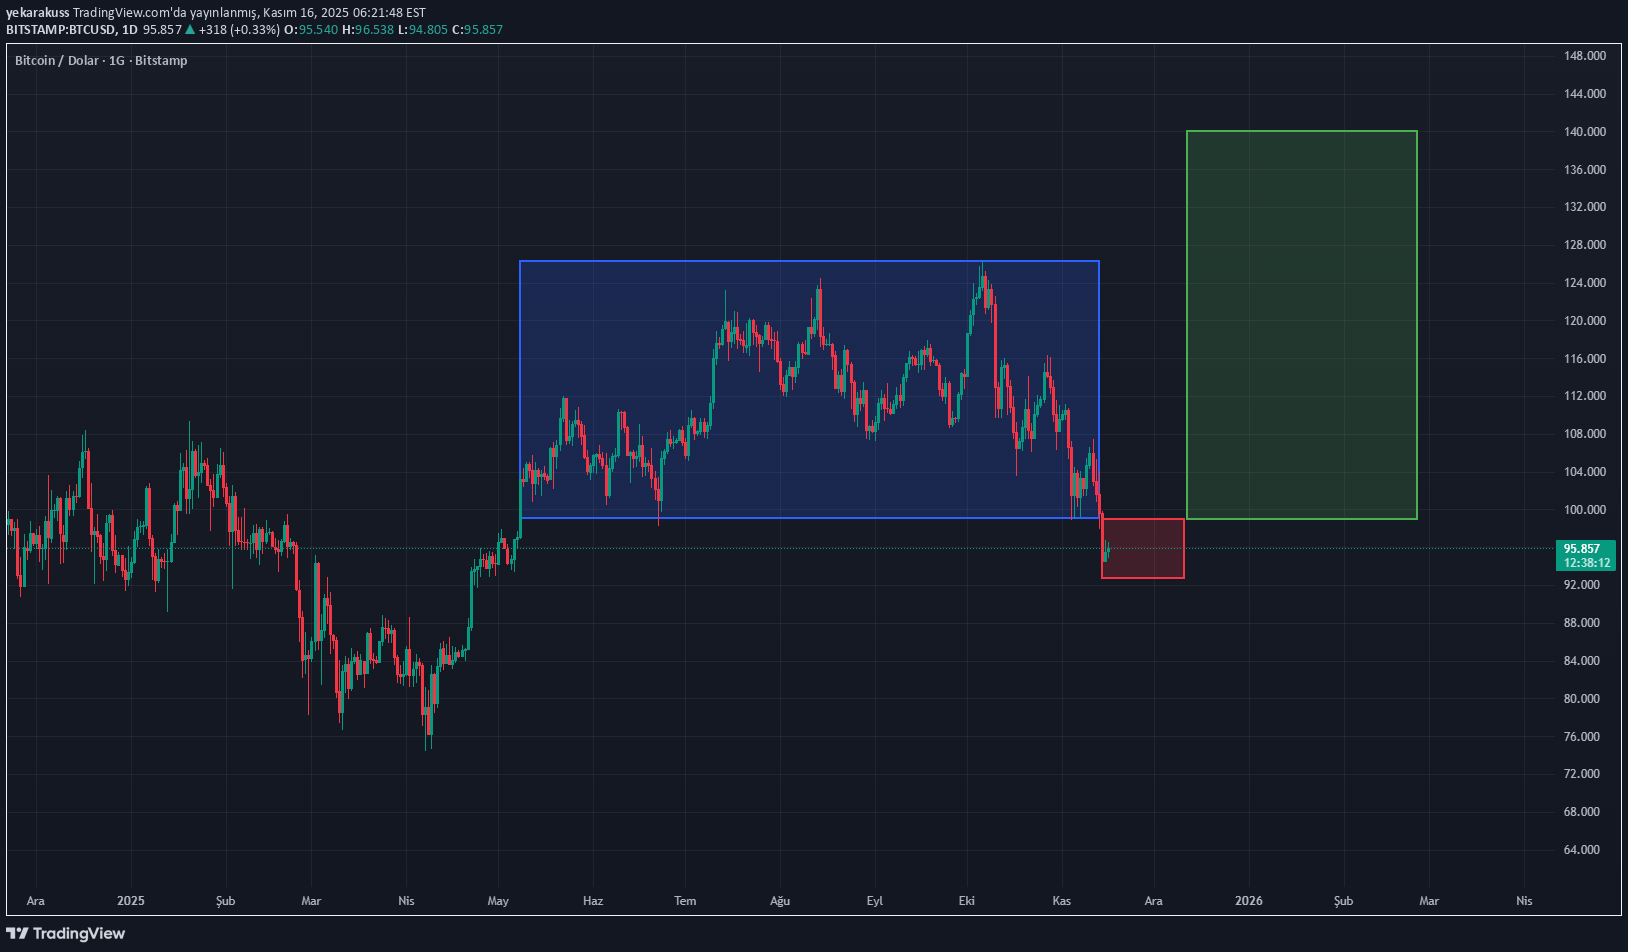
🔵 1) Accumulation – Blue Box The chart shows that Bitcoin consolidated its price within a wide horizontal band between May and October. This zone works like the Accumulation Range in classic PO3: Base of band: ~98,000 – 100,000 Band ceiling: ~124,000 – 126,000 There is constant buying and selling liquidity and stop triggers. The price has repeatedly cleared the upper and lower liquidity pools and returned to the middle band. This structure can be interpreted as a period when big players accumulate positions. 🔴 2) Manipulation (Liquidity Hunt) – Red Zone Price in the last part of the blue box on the chart: Consolidation pinned below base Landed in the stop pool It gave the appearance of an inappropriate capitulation with the increase in volume. This field is compatible with the “Manipulation / Stop Hunt / Sweep” field in PO3. This zone is usually the stage where the market is steered in the wrong direction. 🟩 3) Expansion (Release of Trend) – Green Zone The area targeted by the price turning up from the red box is marked as the green area on the chart. According to PO3, after the manipulation phase is over: The direction of the price returns to the expansion phase in line with the main trend. The green target box above represents the Expansion / Distribution phase in PO3. Potential target range for this region: After over 100,000 breaks 135,000 – 140,000 broad target band This movement is compatible with the start of a major trend wave after breaking out of a long-term horizontal band. 📌 Summary Reading of PO3 Structure Accumulation: 6-month horizontal blue box Manipulation (Liquidity Hunt): Red stop pool Expansion: Green target box
yekarakuss
سقوط بزرگ در راه است؟ شکستن حمایت 4060 دلار چه عواقبی دارد؟
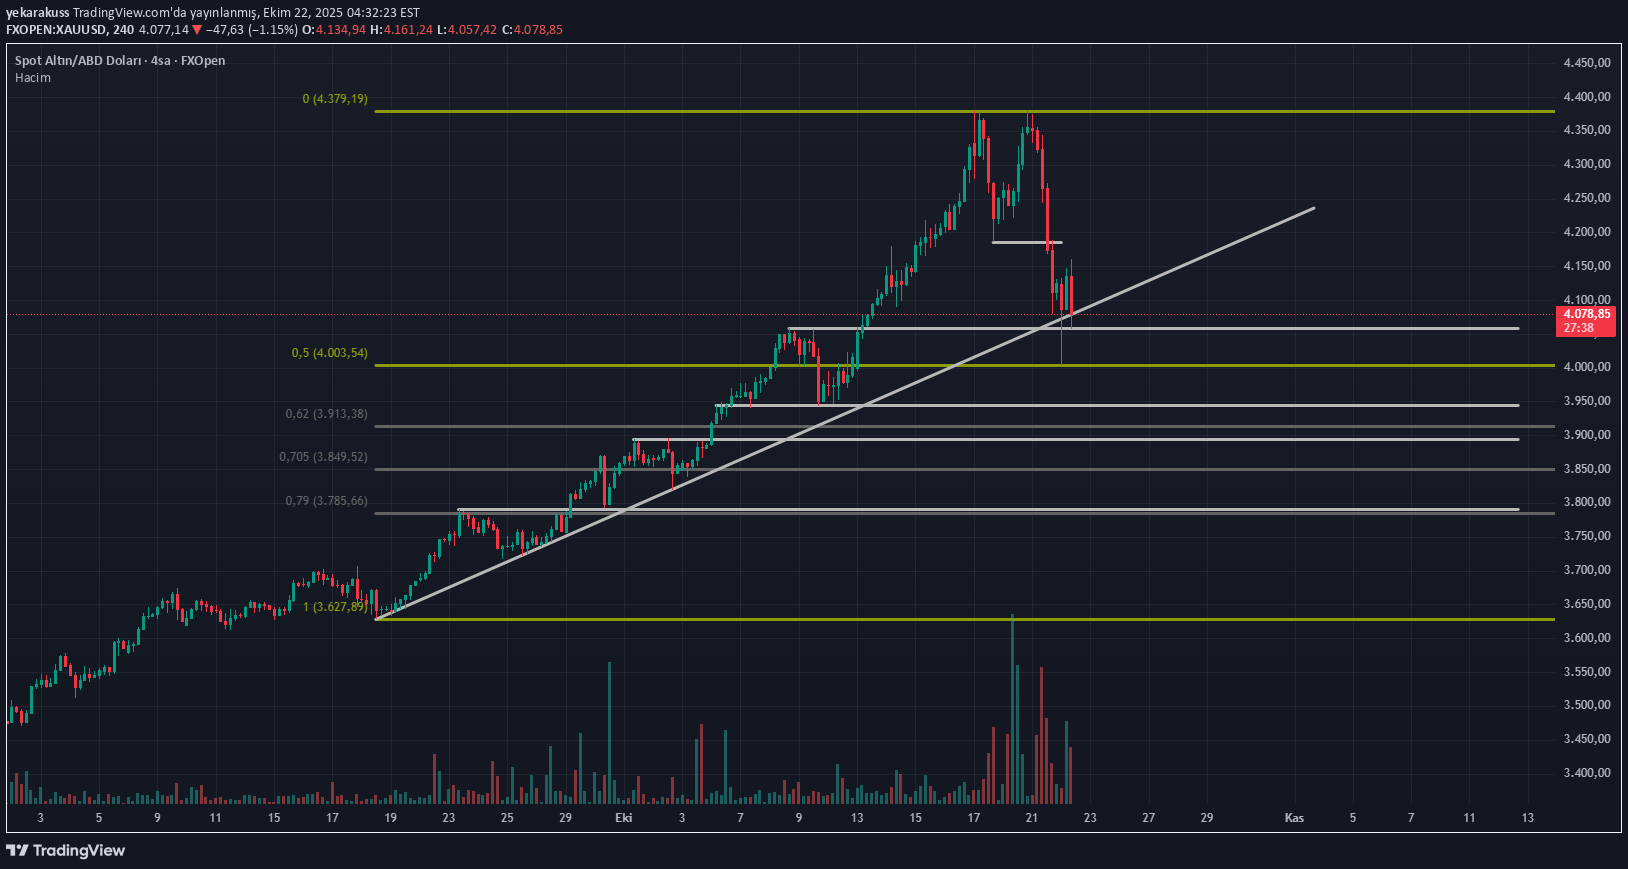
The price has touched the rising trend line that it has tested many times before. However, it is currently very close to the alt band of this line. The $4,060 level stands out as a very critical support point in the short term. This region is important both psychologically and technically. If the price breaks down this 4.060 support, it can be expected that the selling pressure will increase and the price will retreat towards the 3.913 – 3.850 – 3.785 Fibonacci supports. On the other hand, if the price fails to rise above the $4,180 – $4,200 range, which is the upper band of the ascending channel, it will be understood that the buyers have lost power and the correction process continues.
yekarakuss
اتریوم از کف حمایتی مهم جهش کرد: قدم بعدی چیست؟

When examined in Ethereum daily time period: It appears to have received a strong response from the FVG (Fair Value Gap) region. This zone is a critical support area where the price fills the previous unstable movement and buyers come into play again. This increases the potential for an upward reaction in the price in the short term. The price action has also started to form an ascending triangle formation. This structure is generally considered a bullish formation and indicates that the rise may gain momentum if the resistance line is broken. It seems that the third theme of the triangle is approaching. Generally, buyer interest increases after the third bottom in such structures; Therefore, the reaction of the price in this region is important. Getting involved in the price around the third contact may provide a more advantageous position in terms of risk/reward ratio. In summary: The support structure from FVG shows that buyers are still active. The ascending triangle structure heralds a positive squeeze in the market. The third contact area should be carefully monitored; If a significant return is seen at this level, a resumption of the rise can be expected.
yekarakuss
بیت کوین به کجا میرود؟ پیشبینی مسیر صعودی تا سقف تاریخی در کانال و زمان اوجگیری پس از هاوینگ

BTC/USD moves in a rising channel. The price is currently at $ 116.690 and is testing the middle band of the channel. The upper band of the channel points to the range of $ 135,000 - $ 150,000. I guess around November (towards the end of 2025) will be targeted. Crypto coins usually move in 4 -year loops. This cycle: SEXE PERIOD AFTER HALVING (about 1 year) Ascension trend and bull market (1,5 - 2 years) Excessive peak and parabolacic rise (usually 18-24 after halving) Correction / Bear Market (around 2 years) The last Bitcoin Halving took place in April 2024. Historically, there are major peaks after Halving 1.5 years - 2 years (end of 2025 - the beginning of 2026). As in 2017 and 2021, the months of November to December are the most prone to the BTC's cyclical peak. According to the channel structure, it seems technically possible to increase the price in November to $ 135,000 - $ 145,000. Circularally, this date coincides with the “parabolic stage of the bull market .. After this region, hard snow realization and high volatility begin.
yekarakuss
Ethereum’da Kritik Range Yapısı
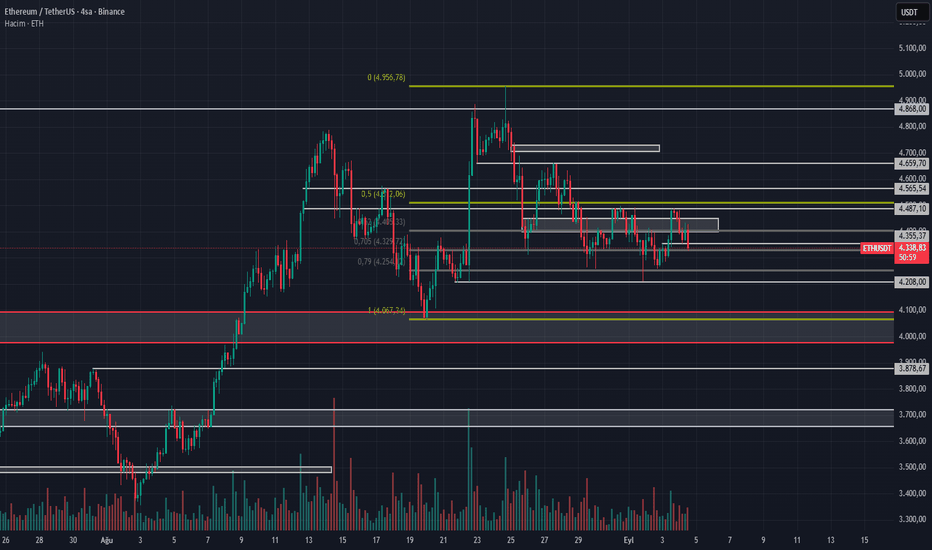
Ethereum’s 4 -hour graph is a clear ranking structure stands out. The price moves in approximately 4067 - 4565 bands and has been returned many times in this range. Especially on the top, the 4487 - 4565 band works as a strong resistance, while the level of 4067 has become a critical support position below. The fact that the price encounters strong buyers in previous rise makes it extra important. If the price continues to cling above this level, we can see rise at the top band, ie 4487 - 4565. If this region is exceeded, the possibility of acceleration up to 4868 - 4956 band is strengthened. On the other hand, a possible breakage below 4067 can lead to deterioration of the existing horizontal structure and an increase in sales pressure. In such a scenario, the price is strongly likely to withdraw to the 3878 - 3700 range in the first place.
yekarakuss
ETH — Hacimle Gelen Haftalık Direnç Kırılımı: Hedef = ATH
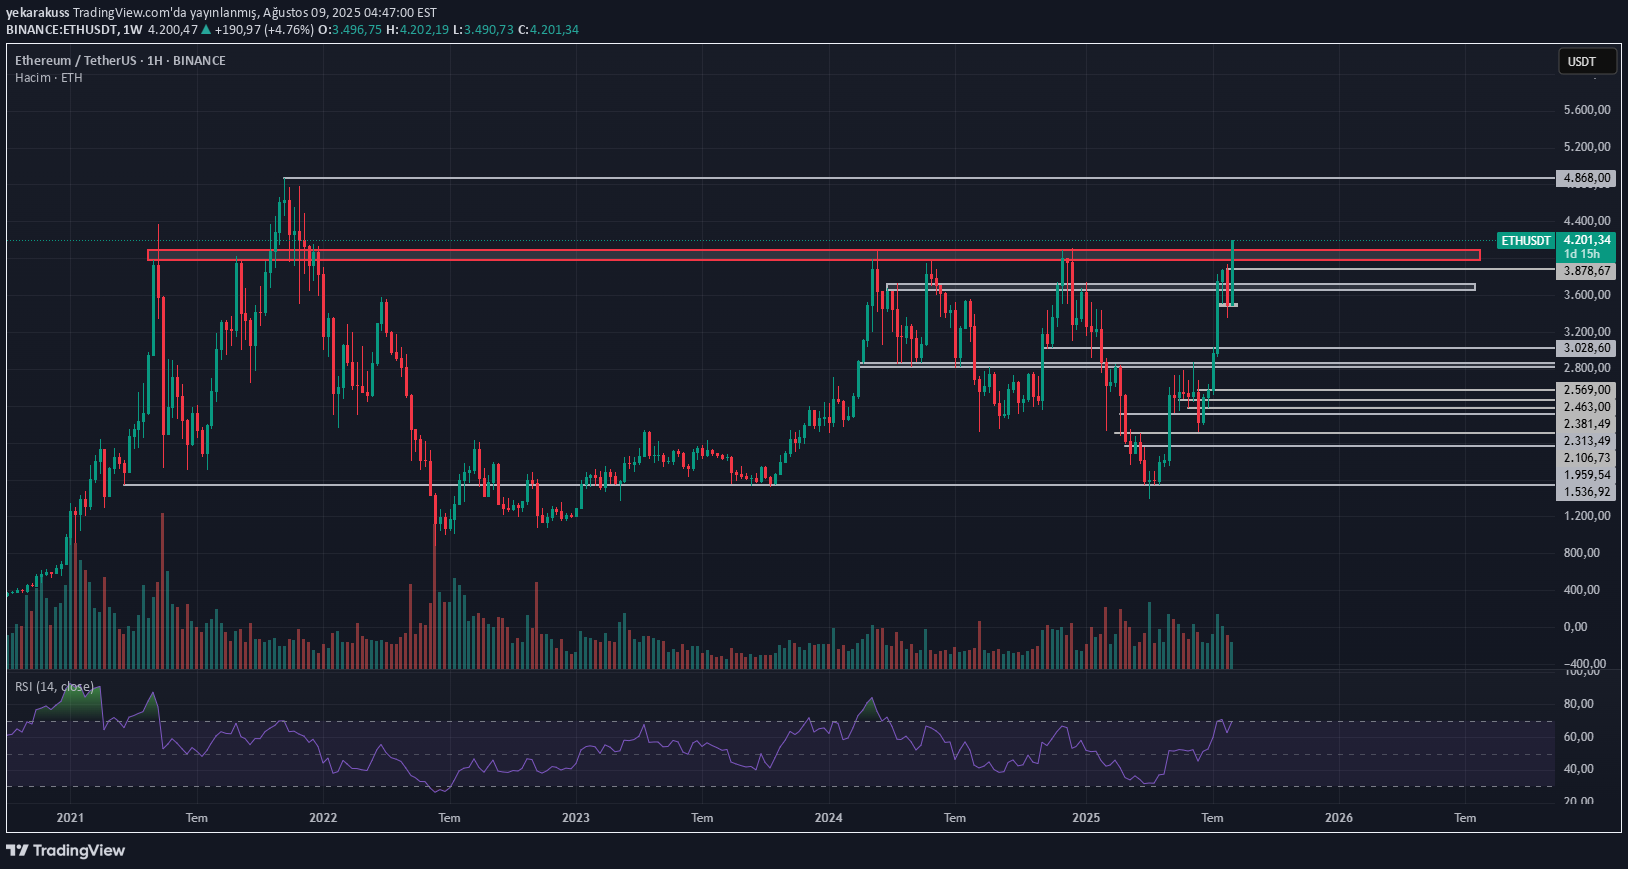
In the weekly graph, a critical resistance zone (~ 3.8k - 4.0k) has been broken with volume and the price is currently holding on this resistance (~ 4,196 USDT). Weekly candle strong green, there is a significant increase in volume - the breakdown was technically confirmed. As long as it remains above the resistance, it is reasonable to look for new peaks if the logical target is old ATH (~ 4,868 USDT) and ATH. ETH When the leadership is strengthened, the rotation of the Altcoin and the bull of the Altcoin are triggered - that is, if ETH shows, the potential of significant rise in subcoins also comes. We have seen a volume frustration in the weekly graphic - As long as the price remains above this area, the target ATH, this scenario can also support the bull of Altcoin.
yekarakuss
LDO Destek Almaya Devam Ediyor: ETH Staking Haberleri
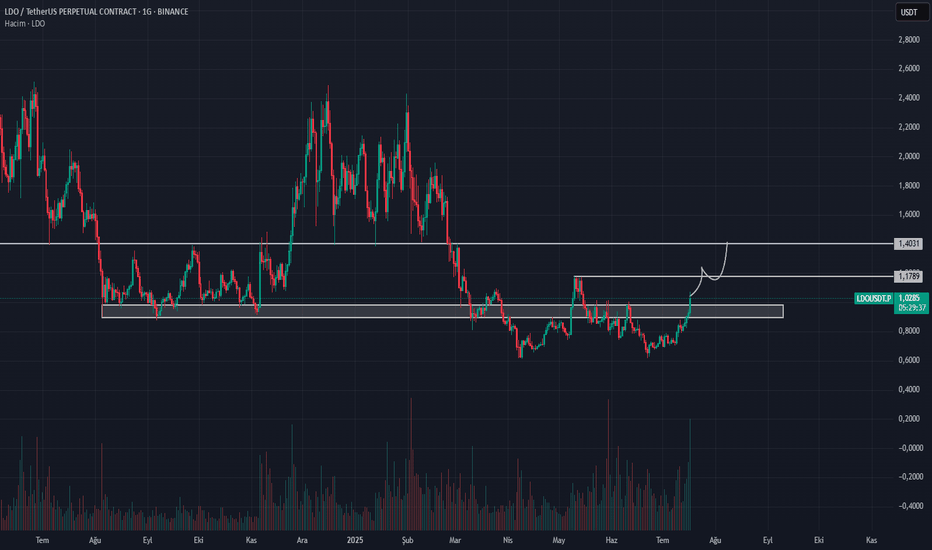
LDO is one of the leading projects in the Stinging Ecosystem. ETH Future positive news about Stinging may positively affect the price. This news flow can support the upward breakage of the technical structure by increasing the confidence of investors in LDO. 1.17 USDT Level LDO is a "momentum threshold". If this level is broken volume, the structure returns to Bullish and 1.40 levels may come up.
yekarakuss
ENS/USDT Dikkat Çekici Yükselen Üçgen Formasyonu
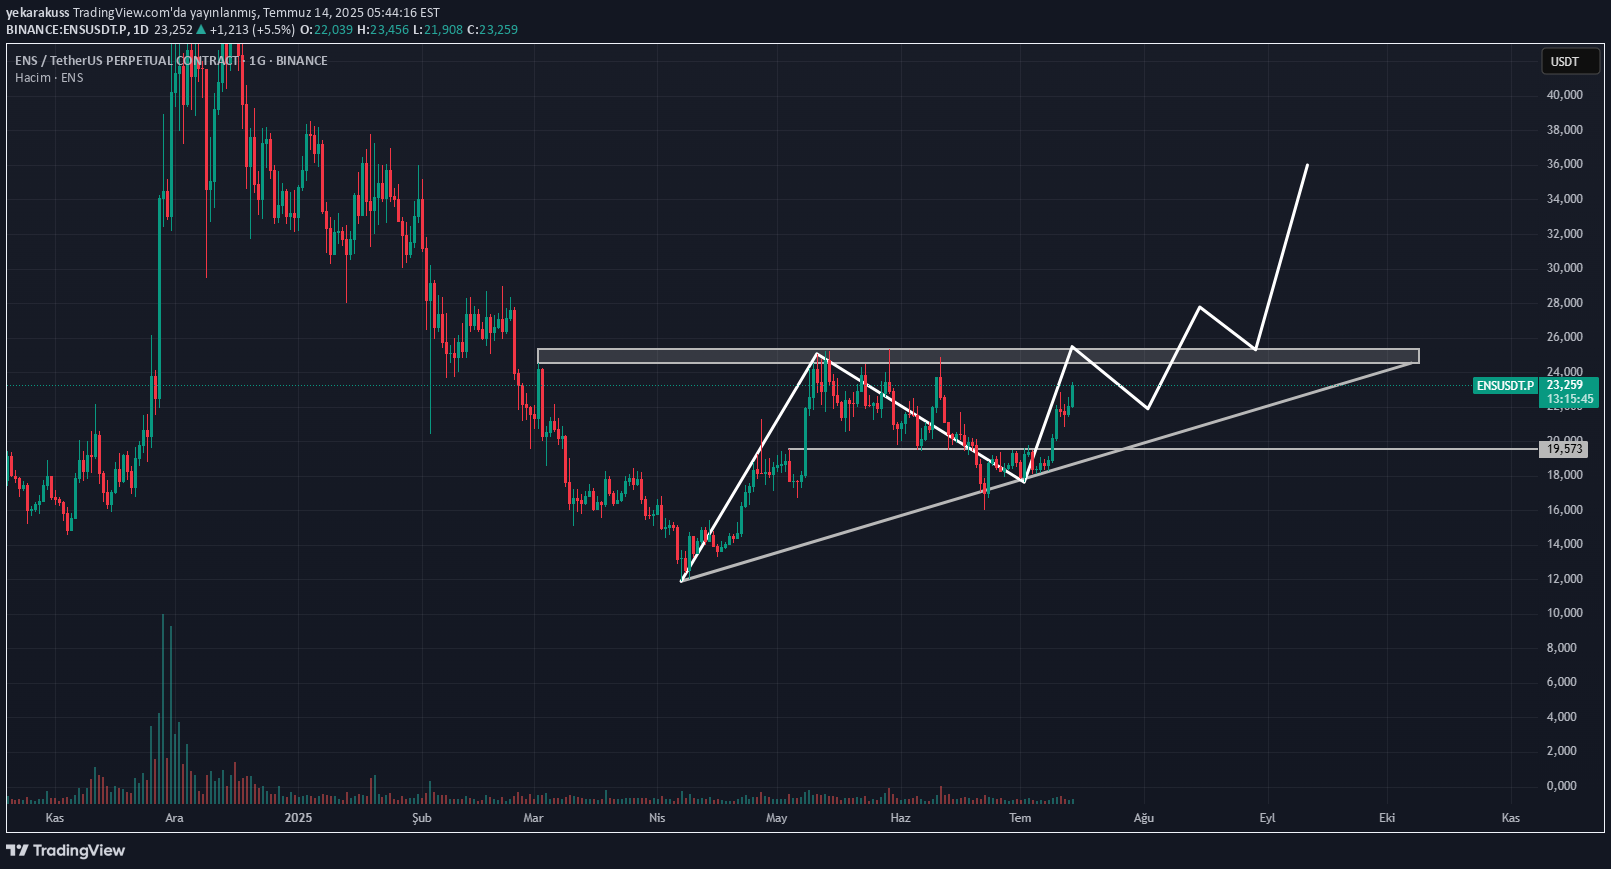
Formation scenario Possible breakdown: If the upper resistance line of the triangle is broken, the target of the price is generally projected upward as the widest height of the formation. In this case, since the formation height is approximately 8–10 USDT, the target after breakage may have approximately 30–35 USDT levels. Formation of the formation: Triangle alt If the trend line breaks down, the formation is broken. In this case, the price can first test the support line of 19.5 USDT. Support & Resistance Zones Critical resistance: 23–24 USDT zone. Intermediate resistance: 26–28 USDT levels. Ascension target: 30–35 USDT zone (after breakdown). Critical Support: 21 USDT and the main support trend line. Main Support: 19.5 USDT Region.
yekarakuss
ETH KRITİK BÖLGEYE YAKLAŞIYOR

🔺 2569 As the price remains below 2569, this can only be a reaction rise.
Disclaimer
Any content and materials included in Sahmeto's website and official communication channels are a compilation of personal opinions and analyses and are not binding. They do not constitute any recommendation for buying, selling, entering or exiting the stock market and cryptocurrency market. Also, all news and analyses included in the website and channels are merely republished information from official and unofficial domestic and foreign sources, and it is obvious that users of the said content are responsible for following up and ensuring the authenticity and accuracy of the materials. Therefore, while disclaiming responsibility, it is declared that the responsibility for any decision-making, action, and potential profit and loss in the capital market and cryptocurrency market lies with the trader.