Technical analysis by yekarakuss about Symbol BTC: Buy recommendation (11/16/2025)

yekarakuss
نقشه راه بیت کوین: از انباشت تا صعود انفجاری (تحلیل ساختار PO3)
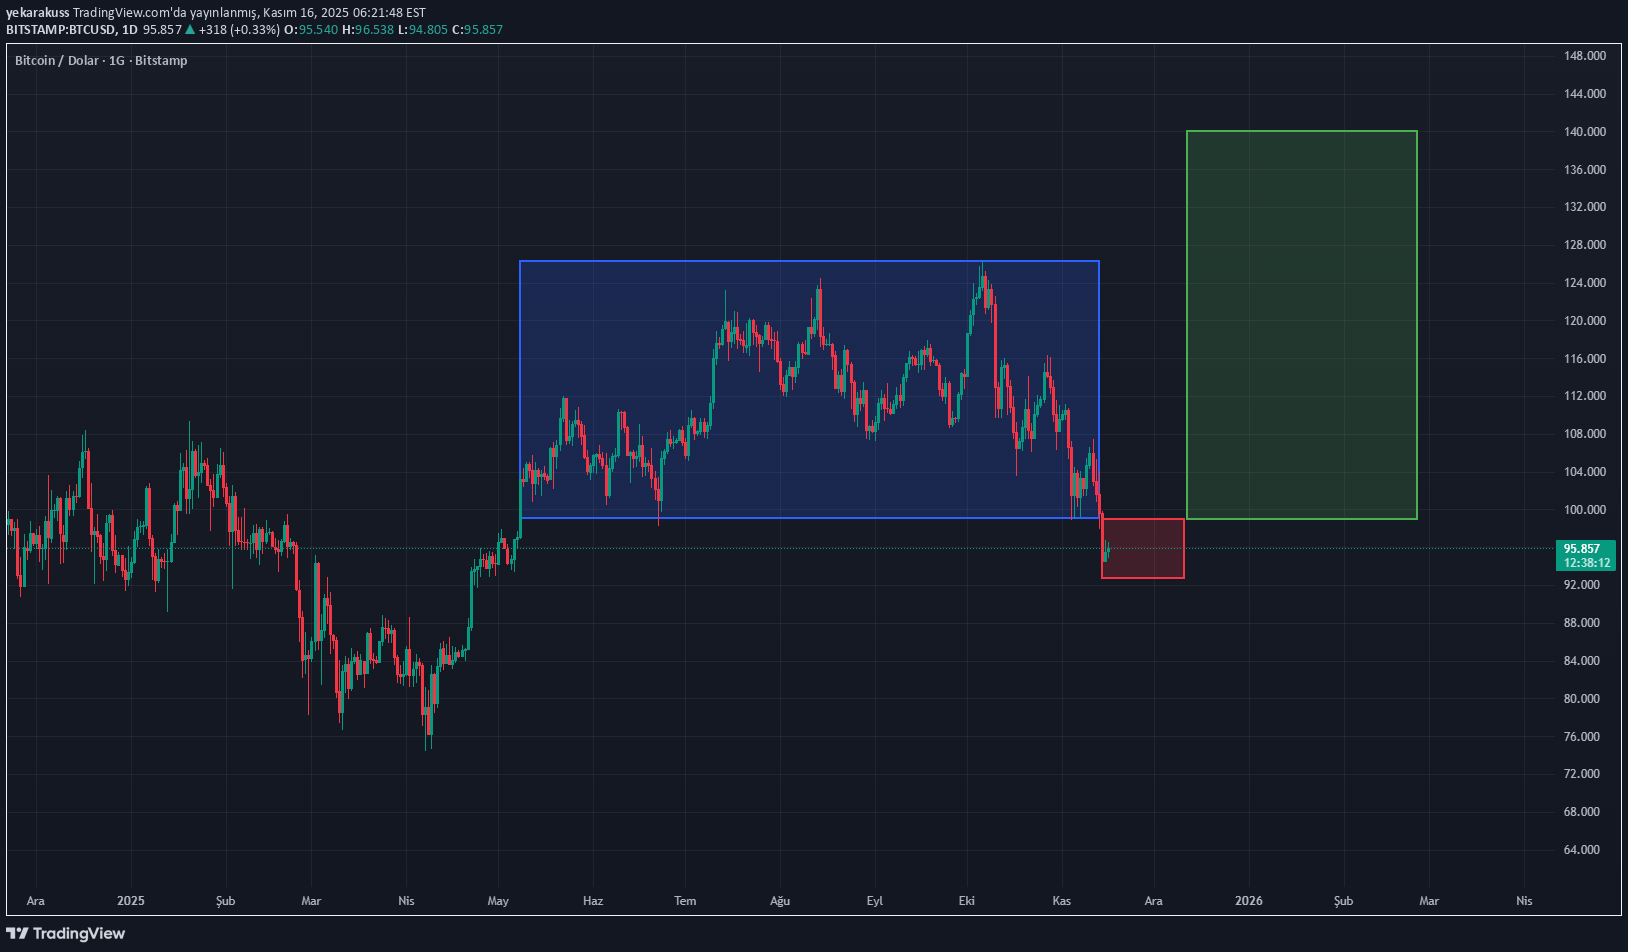
🔵 1) Accumulation – Blue Box The chart shows that Bitcoin consolidated its price within a wide horizontal band between May and October. This zone works like the Accumulation Range in classic PO3: Base of band: ~98,000 – 100,000 Band ceiling: ~124,000 – 126,000 There is constant buying and selling liquidity and stop triggers. The price has repeatedly cleared the upper and lower liquidity pools and returned to the middle band. This structure can be interpreted as a period when big players accumulate positions. 🔴 2) Manipulation (Liquidity Hunt) – Red Zone Price in the last part of the blue box on the chart: Consolidation pinned below base Landed in the stop pool It gave the appearance of an inappropriate capitulation with the increase in volume. This field is compatible with the “Manipulation / Stop Hunt / Sweep” field in PO3. This zone is usually the stage where the market is steered in the wrong direction. 🟩 3) Expansion (Release of Trend) – Green Zone The area targeted by the price turning up from the red box is marked as the green area on the chart. According to PO3, after the manipulation phase is over: The direction of the price returns to the expansion phase in line with the main trend. The green target box above represents the Expansion / Distribution phase in PO3. Potential target range for this region: After over 100,000 breaks 135,000 – 140,000 broad target band This movement is compatible with the start of a major trend wave after breaking out of a long-term horizontal band. 📌 Summary Reading of PO3 Structure Accumulation: 6-month horizontal blue box Manipulation (Liquidity Hunt): Red stop pool Expansion: Green target box