xAB777
@t_xAB777
What symbols does the trader recommend buying?
Purchase History
پیام های تریدر
Filter
Signal Type

xAB777

yo whats up , i had to switch the bias for xauusd o think we will see a bullish move of this key level.

xAB777

Hello guys this is what i see in xauusd i see price retracing back to premium at the key level outlined then a continuation to the sell stops outlined below share with me your ideas

xAB777

i see bitcoin bullish over the next few weeks i check out my analysis on the dollar i am very bearish on DXY .

xAB777

hello guys , i think xauusd is bearish the market structure on high time frames is brearish todays candle closed as an inverted hammer tommorow will probably be a red candle add to that the price formed a double top pattern the break out of the trendline + key level will cause a price to make a lower low lower then 1980 . DXY has a massive inverted head and shoulder so a positive addition to our technical analysis . keep in mind a bullish probability is possible too a break out of the trendline will cause a run towards 2050. but i am bearish !

xAB777

hello guys , after today it seems like gold want to move up here is why : first of all On the daily time frame we have a double bottom Today the price broke a key trendline which he rejected for quite some time the price also broke last 30 days point of control (poc) which means buyers beated the sellers. also the close of the daily candle indicates a bullish continuation . confirmation is the break of 2035 area which plays as a resistance zone and a neckline of the daily double bottom if the break out is valid. TARGETS ARE ON CHART . keep in mind this week is super action packed due to fondamentals so watch out for those.

xAB777

since last week gold had a very indecisive and unclear price action the overall direction was unclear but since geopolitical situation is getting serious and serious i think we should be looking at the bullish direction. i have found a pretty good scenario with a good entry if a bullish move occurs . First the price reached a daily keylevel and fibbonacci golden zone level then the last 4H candle closed as a doji hammer indicating strength of buyers on lower tfs we can find a formation of an inverted head and shoulder + rsi divergence. i guess the break of the neckline could trigger a bullish continuation towards the 2050s.

xAB777

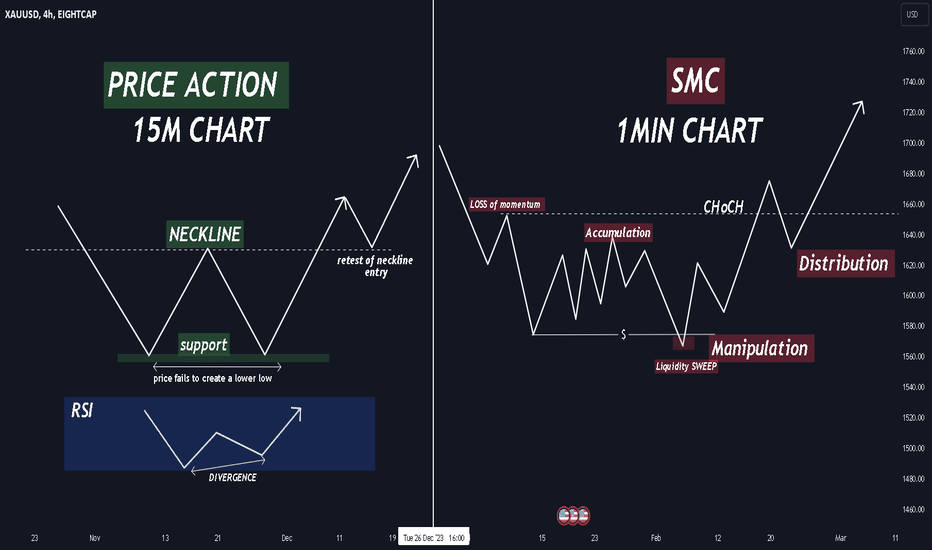
In the world of technical analysis, the double bottom pattern holds a special place for traders. However, the way this pattern is interpreted can vary, especially when comparing the traditional price action approach with the more intricate Smart Money concepts. Traditionally, a double bottom is identified by the formation of two distinct lows, approximately at the same price level, separated by a reaction high. Traders keen on price action look for a breakout above this reaction high as a signal for potential bullish momentum. As a price action trader i was interested by the Smart money concepts approach so i decided to read about it a little bit and i found it pretty detailed after reading here are the differences that i noticed on the double bottom pattern.

xAB777

Hello guys in my opinion gold global direction is still unclear at the moment . but for today we can see this possible scenario happen its very likely that we see a drop towards 2050s. the price reached a resistance level and formed a double top broke and retested the neckline but in the 1h we kind of have an invertd hs forming . i would look for more comfirmation before taking this trade happy new year guys

xAB777

Hello traders so gold was ranging all day on friday and formed a ugly head and shoulder figure with rsi divergence indicating a bearish breakout . indeed before the market close the price managed to break structure and the demand zone for monday am expecting maybe a correction and a retest towards that level before a bearish continuation if the price give us a lower high in the area with a good rejection i will enter a short trade for a 2 RR

xAB777

a nice possible setup for today ahead of cpi data . the trend is bearish + gold is trading in a channel + rsi bearish divergence id wait for a double top or a hammer on the top of the channel for extra confirmation
Disclaimer
Any content and materials included in Sahmeto's website and official communication channels are a compilation of personal opinions and analyses and are not binding. They do not constitute any recommendation for buying, selling, entering or exiting the stock market and cryptocurrency market. Also, all news and analyses included in the website and channels are merely republished information from official and unofficial domestic and foreign sources, and it is obvious that users of the said content are responsible for following up and ensuring the authenticity and accuracy of the materials. Therefore, while disclaiming responsibility, it is declared that the responsibility for any decision-making, action, and potential profit and loss in the capital market and cryptocurrency market lies with the trader.