Technical analysis by xAB777 about Symbol PAXG on 1/14/2024

xAB777
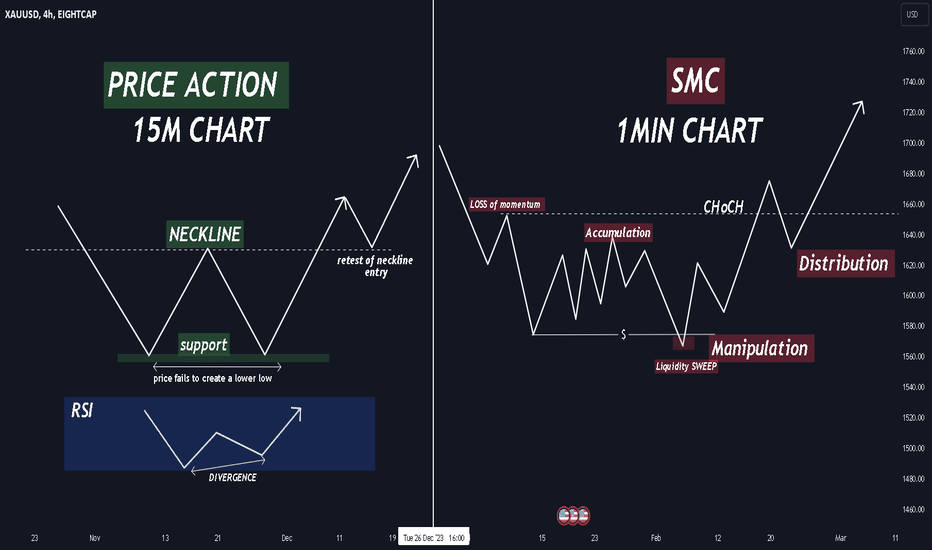
In the world of technical analysis, the double bottom pattern holds a special place for traders. However, the way this pattern is interpreted can vary, especially when comparing the traditional price action approach with the more intricate Smart Money concepts. Traditionally, a double bottom is identified by the formation of two distinct lows, approximately at the same price level, separated by a reaction high. Traders keen on price action look for a breakout above this reaction high as a signal for potential bullish momentum. As a price action trader i was interested by the Smart money concepts approach so i decided to read about it a little bit and i found it pretty detailed after reading here are the differences that i noticed on the double bottom pattern.
