
vpsihost
@t_vpsihost

What symbols does the trader recommend buying?
Purchase History
پیام های تریدر
Filter
vpsihost
تحلیل چند زمانیتی ARB: نشانههای انفجار بزرگ قیمت با همترازی نقدینگی!
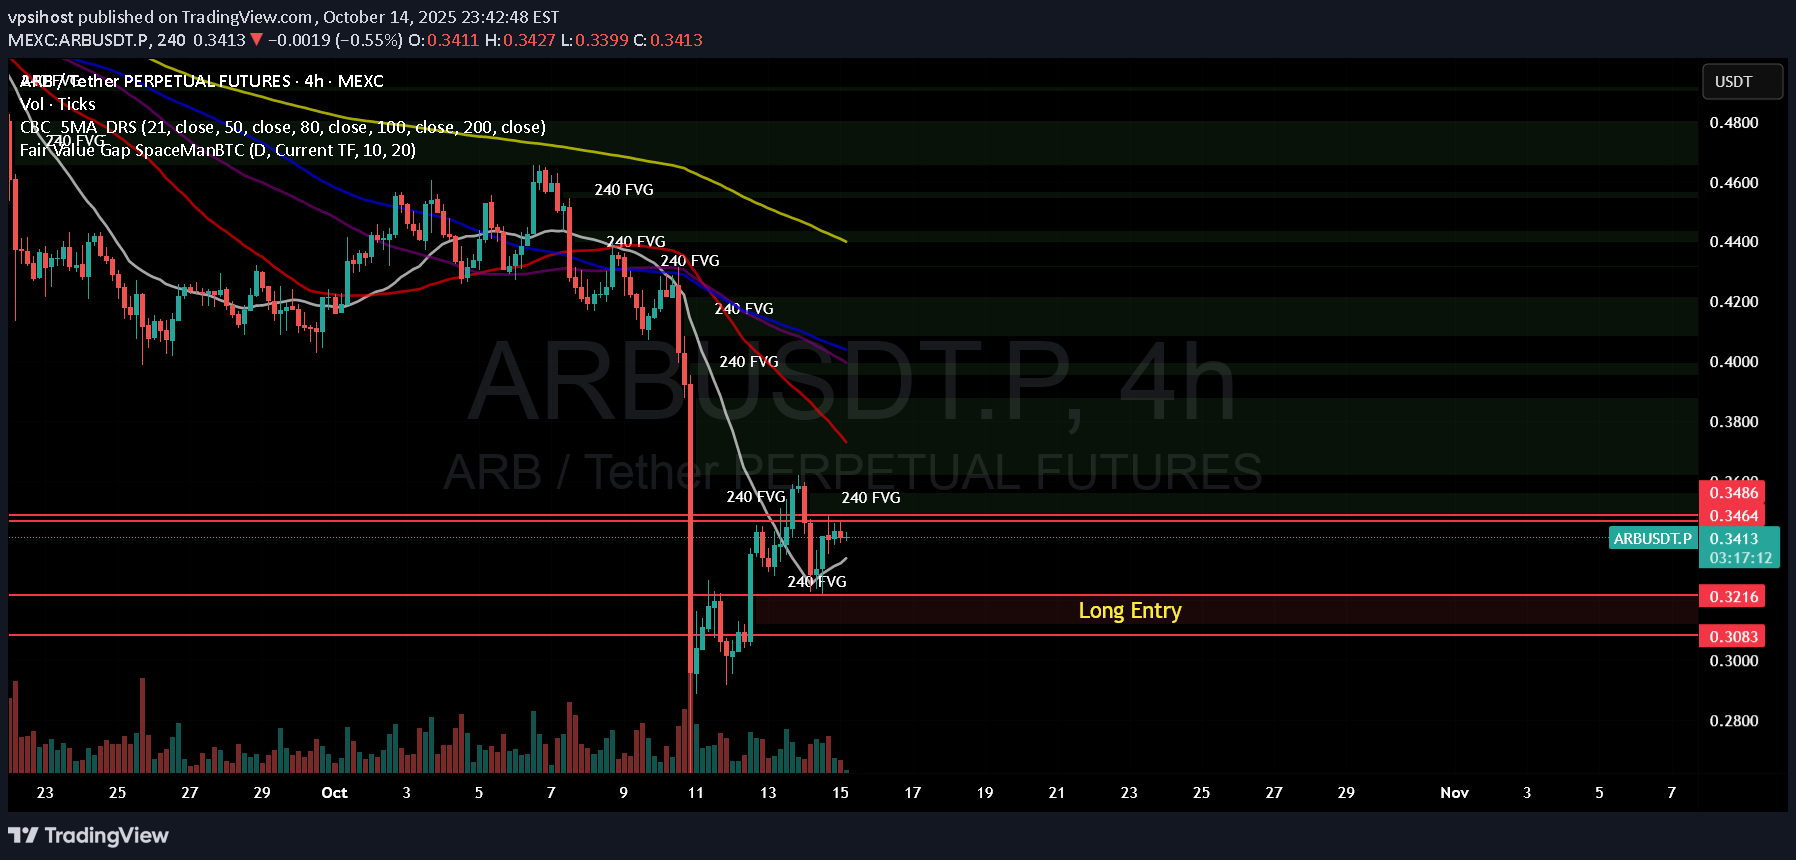
ARB is showing a rare alignment across all timeframes: 🔹 5m – 15m: Short-term structure consolidating right below a 0.348 liquidity shelf, with multiple small FVGs suggesting a coiled breakout zone. 🔹 30m – 1h: Mid-range compression between 0.334 – 0.348; price continues to defend the 200 EMA and is building higher-low structure. 🔹 1W (Weekly): A clean bullish FVG has formed—if price fills and reclaims this zone, it could unlock nearly 100 % upside potential from current levels. 🔹 1M (Monthly): Macro support sits around 0.32 – 0.34, marking the accumulation floor since early 2024. Together, these setups hint that ARB may be preparing for a strong rotation phase once market liquidity returns. 📈 Key Levels: Support → 0.334 / 0.321 Resistance → 0.348 / 0.36 Macro Target (Weekly FVG Top) → ≈ 0.60 region 💡 Observation: Watch how USDT Dominance behaves around 4.82 %. A rejection there could trigger ARB’s next leg up.
vpsihost
پیشبینی صعودی AXS/USDT: آمادهسازی برای خرید در سطوح کلیدی تقاضا

AXS is currently trading below multiple Fair Value Gaps (FVGs) on the higher timeframes, with strong confluence zones forming on the 4H chart. Weekly Chart Outlook: Two bullish FVGs above price: $4.65 – $5.52 (major imbalance zone) $4.00 (minor FVG) Two bearish FVGs below price: $1.88 $0.66 (extreme low – could be tapped only if the market turns strongly bearish) 4H Chart Structure: Active FVG: $2.34 – $2.37 → aligns perfectly with the 200 MA, a key dynamic resistance. Below price: three smaller FVGs $2.17 – $2.12 (near 50 MA, solid demand) $2.00 zone (historical liquidity pocket) Momentum: RSI rising from oversold; structure forming potential higher low. 💡 Bias & Plan: Watching for a retrace into $2.17–$2.12 to confirm a higher low before entering long. Targeting the $2.34 – $2.37 FVG first, and eventually the $4.00+ zone if momentum sustains. Invalidation below $1.95. If the broader market enters a deeper bear cycle, the $0.66–$1.88 levels could be revisited — however, at current momentum and liquidity structure, such retrace would likely take several months, not immediate. --- ⏳ Expected Timing: If BTC maintains range-bound or mildly bullish momentum, the $0.66 zone would only be hit in a full macro downturn, potentially in 2026 or later. Short term (1–3 weeks): expecting reaction around **$2.12–$
Disclaimer
Any content and materials included in Sahmeto's website and official communication channels are a compilation of personal opinions and analyses and are not binding. They do not constitute any recommendation for buying, selling, entering or exiting the stock market and cryptocurrency market. Also, all news and analyses included in the website and channels are merely republished information from official and unofficial domestic and foreign sources, and it is obvious that users of the said content are responsible for following up and ensuring the authenticity and accuracy of the materials. Therefore, while disclaiming responsibility, it is declared that the responsibility for any decision-making, action, and potential profit and loss in the capital market and cryptocurrency market lies with the trader.