
trushkovskiy
@t_trushkovskiy

What symbols does the trader recommend buying?
Purchase History
پیام های تریدر
Filter
حرکتهای بزرگ بیت کوین: پیشبینی دقیق مسیر صعودی تا تابستان ۲۰۲۶!
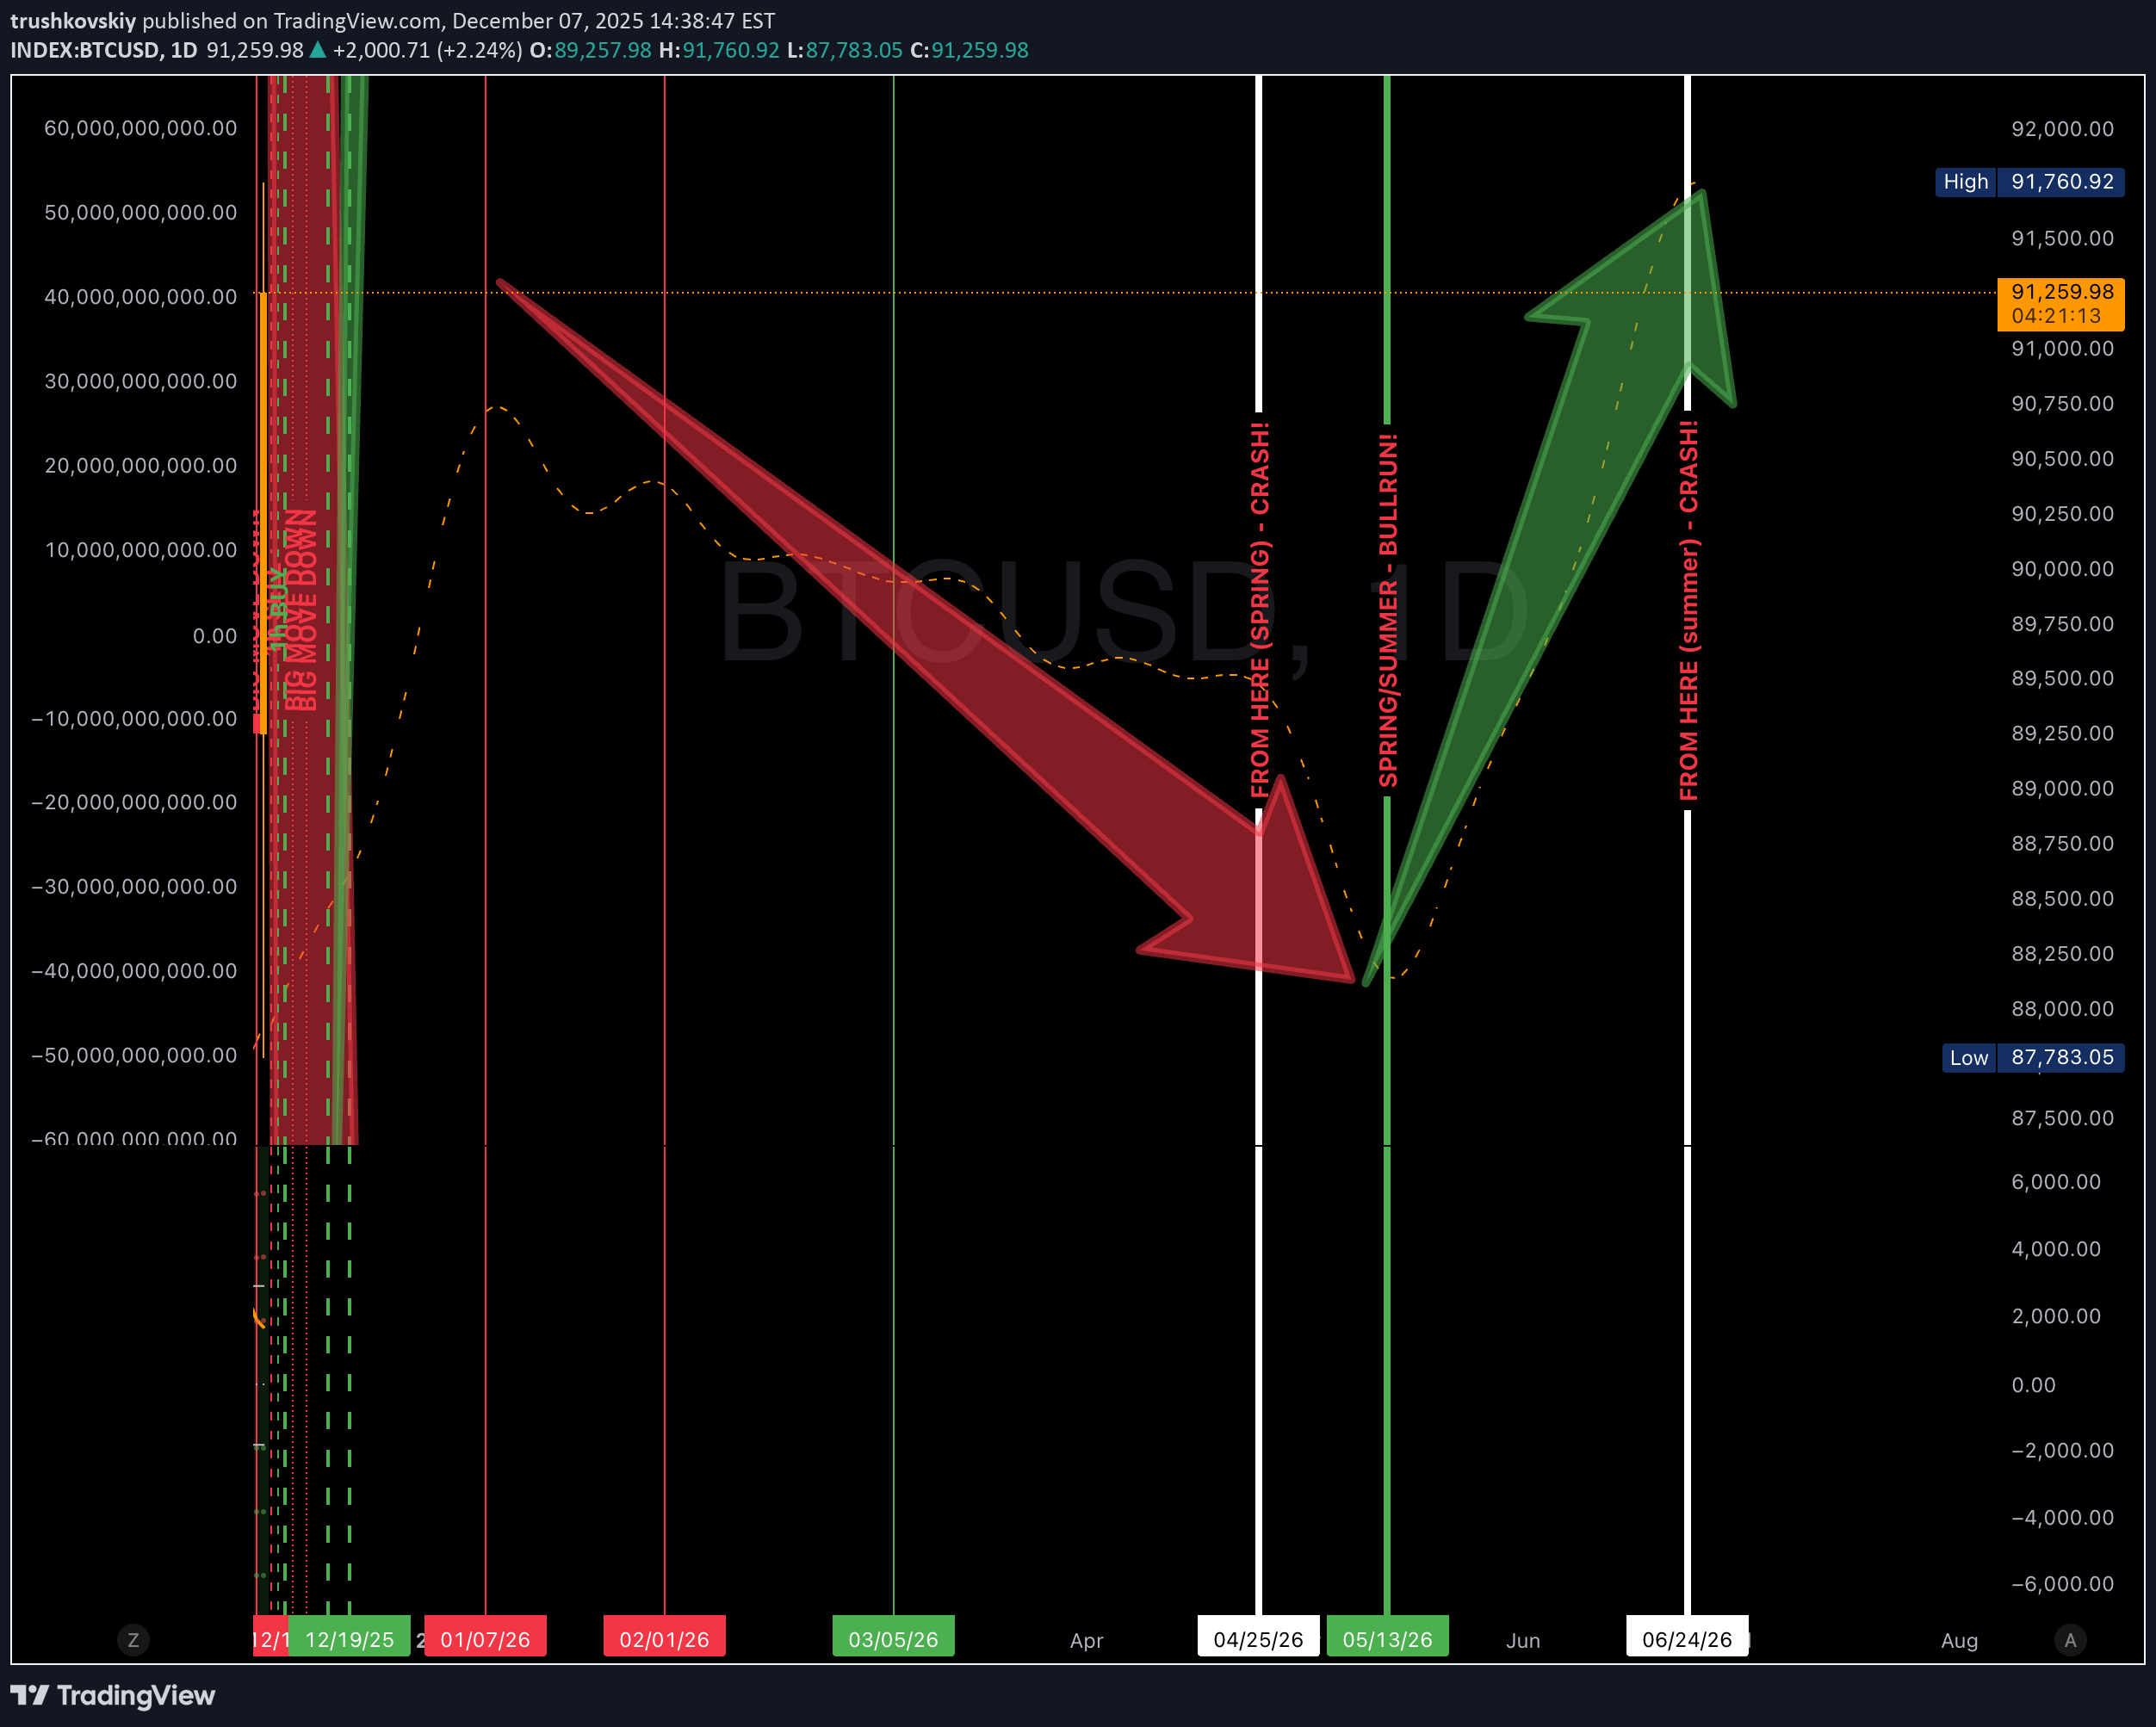
Our system shows that BTC will go higher from 17 +/-2 days of Dec until Jan 2026 (second part) From there - CORRECTION!!! right until 1st stop march , from there going up till April 2026 Then one more correction until MAY 2026, and from there HUGE PUMP till SUMMER (JUL) 2026 From Summer - THE END! Next best buying opportunities MAY and NOV 2026.
تحلیل شوکهکننده بیت کوین: آیا بیت کوین به این سطوح نخواهد رسید؟

🪙 BTC October 10th 😅 Straddle breakevens: 118000 & 127000 🪙 BTC October 17th 😅 Straddle breakevens: 116000 & 130000 σ Sigma probabilities: October 10th | σ | Multiplier × 😅 | Probability | 1σ | 117000 & 128000 | ≈68% | 2σ | 112000 & 133000 | ≈95% October 17th | σ | Multiplier × 😅 | Probability | 1σ | 114000 & 131000 | ≈68% | 2σ | 106000 & 139000 | ≈95%
پیشبینی شش ماه آینده بیت کوین: چه اتفاقی در انتظار BTC است؟


BTC 1d forecast

BTC WILL GO DOWN from 11-20 of August till the end of Aug (25 +/-1day) From there we are PUMPING till beg of Nov, from there DUMP till mid Dec and one last PUMP til mid JAN beg FEB! Than - THE END!!!! FINISH! Sayanara
BTC will....

I know, i know. "1mln $$$ till the end of the year" - i wish. But the end is near! The last PUMP from AUGUST till November! 11/06/2025
THE END OF ETH

I think they’re about to trap all of you in the most popular alts. Bitcoin. Ethereum. XRP. Solana. ADA. DOGE. PEPE. You name it. The end of ETH is near. 🟩 Green = I’m buying 🟥 Red = I’m selling Last time we predicted the drop from $4,000 to $1,400. This time I want to see ETH under $1,000. Good luck holding your bags when the market rug gets pulled. I’m not here for likes — I’m here for entries. Stay sharp. 🧠📉
THE END OF BTC!

🚨 SOMETHING BIG IS COMING TO THE CRYPTO MARKET 🚨Two massive bearish divergences flashing on the HIGHER TIMEFRAMES:🟥 WEEKLY🟥 MONTHLYThis is NOT just noise. These divergences don’t show up for fun — they often precede violent corrections.We might be standing right in front of a major crash.Maybe not from today, but August could be the breaking point.Risk is growing.Liquidity is thinning.Smart money is already adjusting.If you think the bull run will last forever — think again.I’m watching this setup VERY closely.🚩 Stay sharp. Stay protected.
WHAT’S NEXT FOR BITCOIN

THE FULL PICTURE: WHAT’S NEXT FOR BITCOIN, ALTS & VOLATILITY?May 11 – June 7If we connect all the dots — Bitcoin price action, volatility spikes, altcoin rotation, the DXY (dollar index) behavior, and USDT dominance — here’s what the next few weeks really look like:⸻May 11–14Silence before the stormBitcoin slightly goes upTarget zone: $105K – $109KVolatility is LOW😴📈⸻May 15–17🚨 First dump beginsBTC starts fadingVolatility increases FASTTarget wick: $95K – 97K⚡️📉⸻May 17–21Bitcoin bounces — but gentlyMax target for this “relief” pump: $103-105KVolatility drops again🚫 Don’t expect new highs🪤📈🧠⸻May 21–25💥 THE BIG ONEVolatility spikes againBTC enters full-blown macro correctionBottom likely lands on May 25 or 17💀🔻⸻May 25 – June 2Here comes the altcoin windowBTC UP → BTC dominance DOWN Alts can finally PUMP again — for a moment🚀💎🔥⸻June 2 – June 7Final flush begins4H timeframe screams collapse!Volatility explodesBTC likely breaks new monthly lowsAlts get obliterated☠️📉🌊⸻Meanwhile… the Dollar Index (DXY)Bottoms around May 25–28 or early JuneThis confirms short-term tailwind for risky assetsBut once it turns up again — risk is OFF⏳💵📊⸻USDT DominanceUSDT dominance turns around from May 12 and rises through JulyThis means people will start fixing their profits and shifting back to USDT — expect selling pressure🔄💰📉⸻You’ve been warned ⚔️⏱️
Disclaimer
Any content and materials included in Sahmeto's website and official communication channels are a compilation of personal opinions and analyses and are not binding. They do not constitute any recommendation for buying, selling, entering or exiting the stock market and cryptocurrency market. Also, all news and analyses included in the website and channels are merely republished information from official and unofficial domestic and foreign sources, and it is obvious that users of the said content are responsible for following up and ensuring the authenticity and accuracy of the materials. Therefore, while disclaiming responsibility, it is declared that the responsibility for any decision-making, action, and potential profit and loss in the capital market and cryptocurrency market lies with the trader.