
trading_mura
@t_trading_mura

What symbols does the trader recommend buying?
Purchase History
پیام های تریدر
Filter
trading_mura
trading_mura
اتر (ETH) سقوط کرد؛ آیا حمایت حیاتی ۳,۴۳۵ شکسته میشود؟
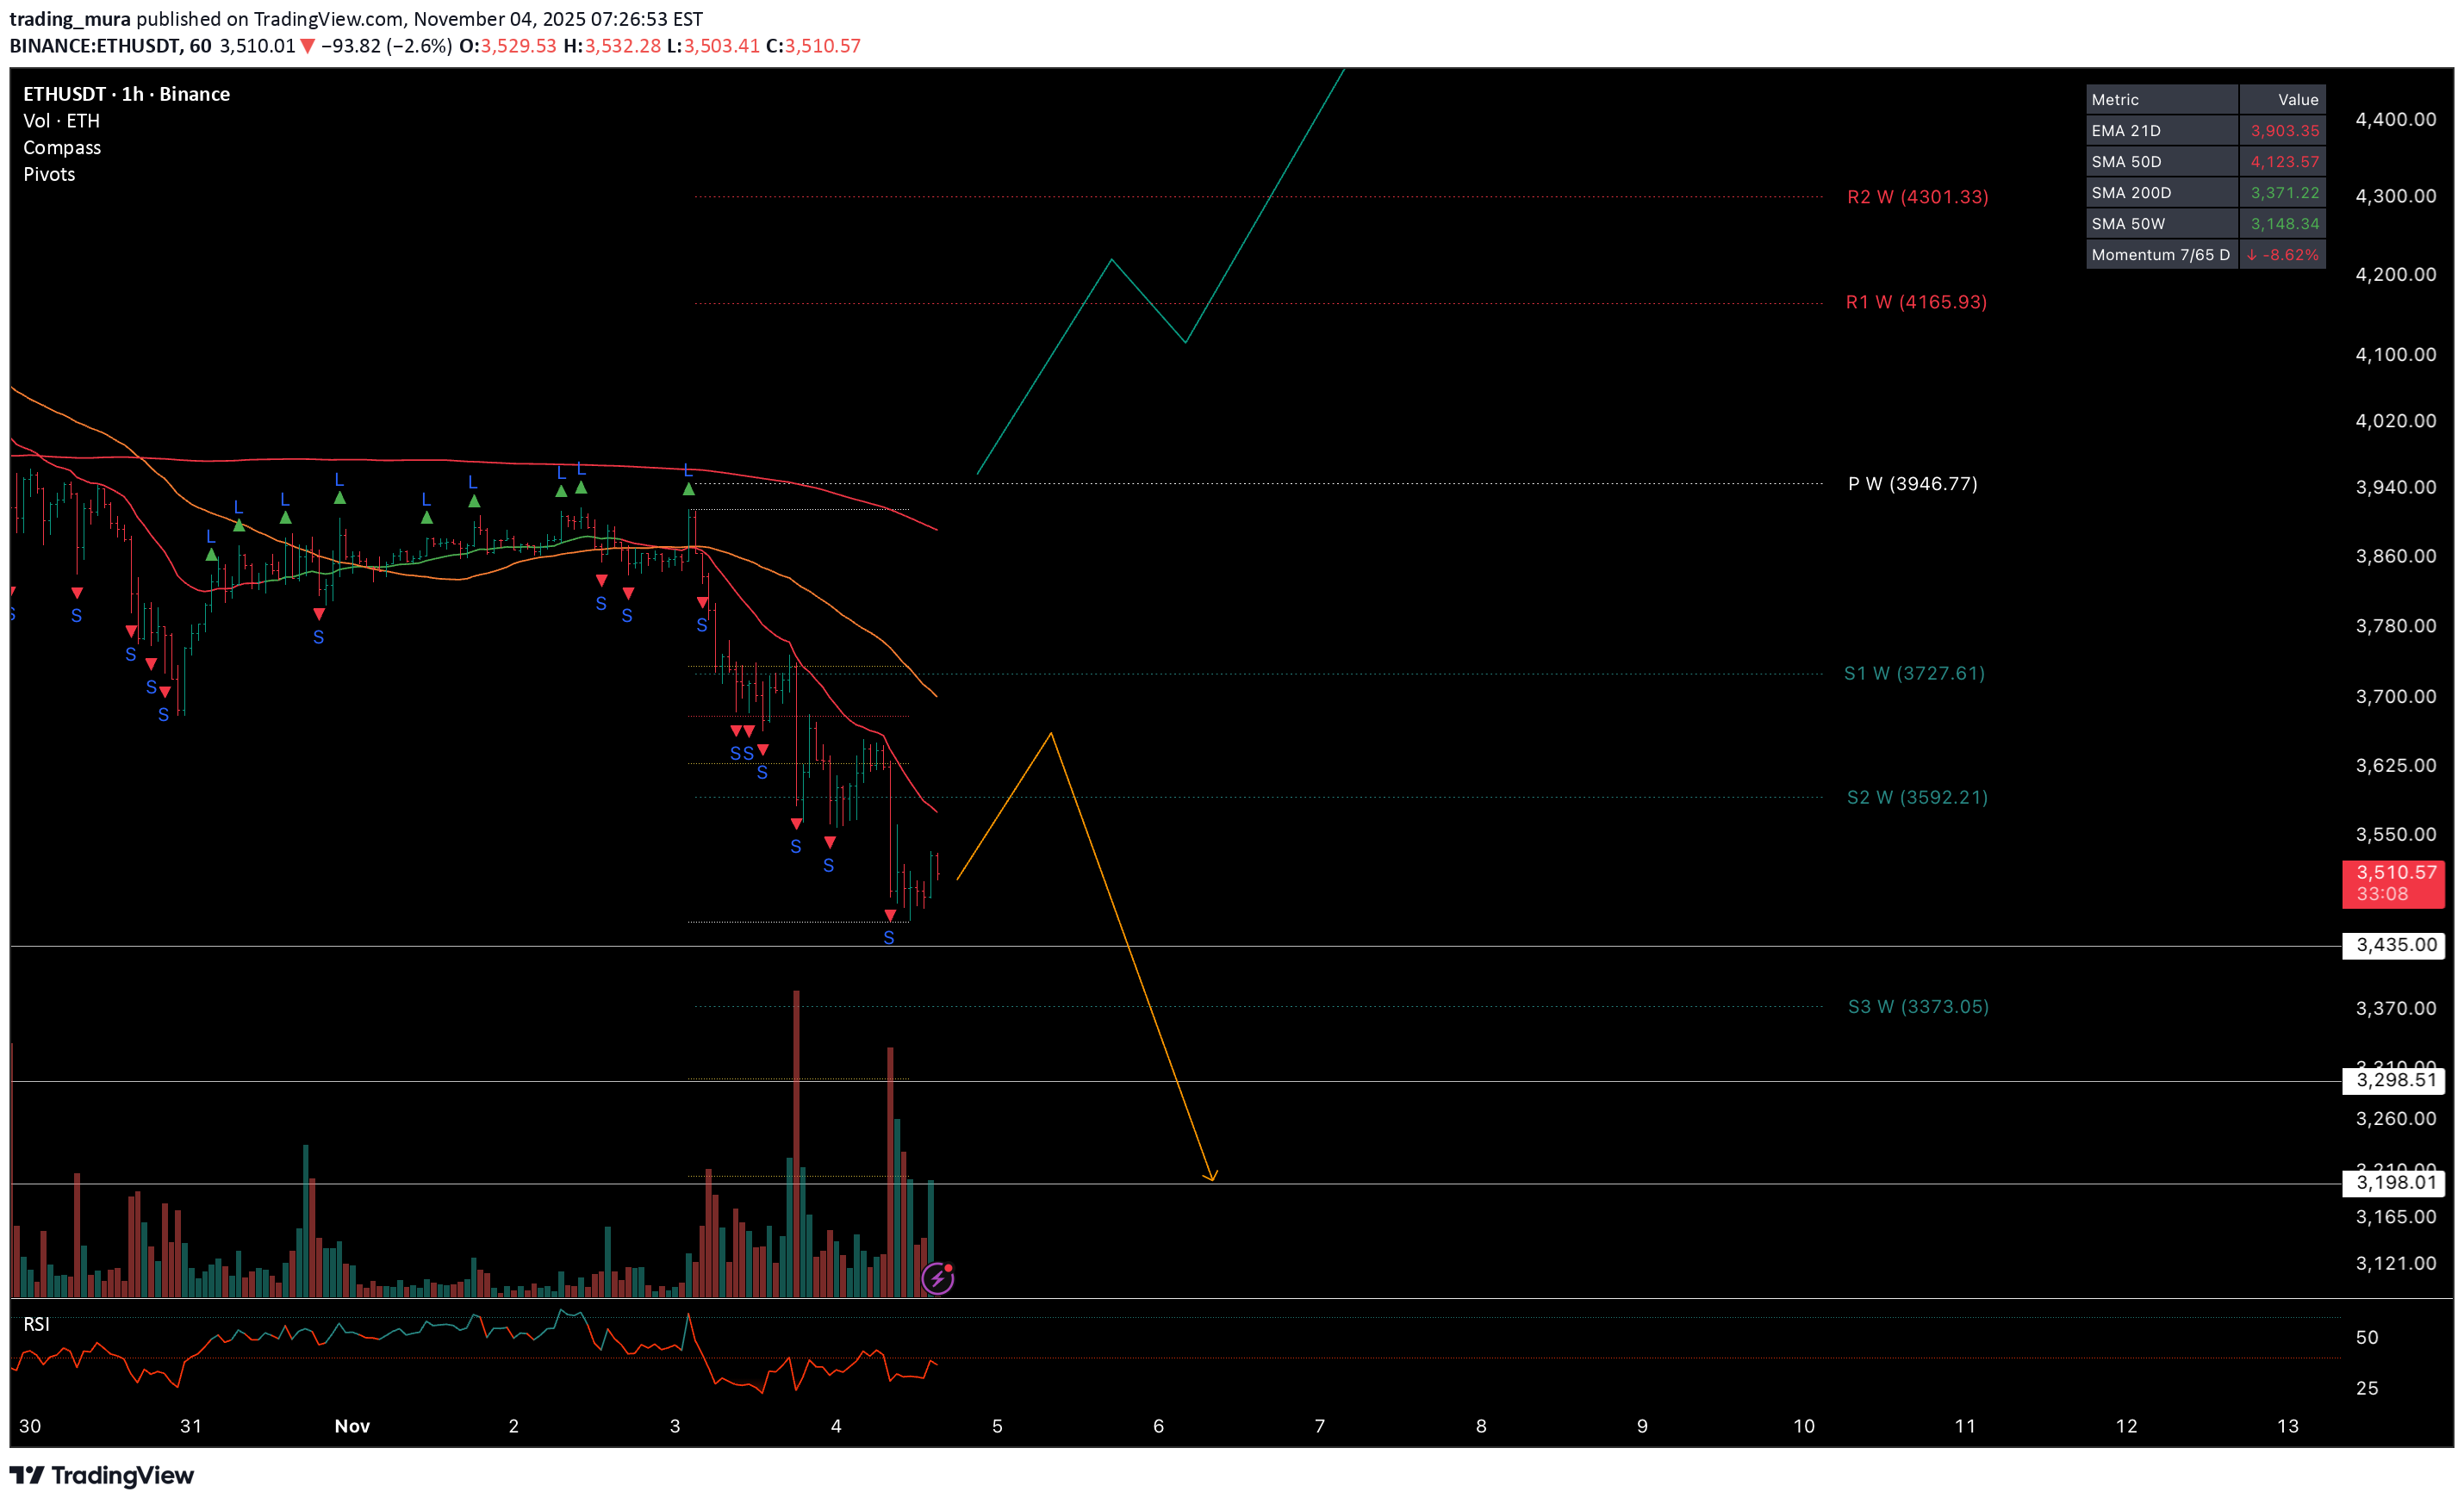
Last week, Ethereum also followed our red scenario and is currently continuing its decline. The price is now very close to the previous low, and there’s a high chance of breaking it at 3,435 , which could lead to a further drop toward 3,128 . A return of bullish sentiment is only possible above 3,945 — until then, we remain in a downtrend.
trading_mura
سقوط بیت کوین ادامه دارد: آیا 103 هزار دلار شکسته میشود یا 110 هزار بازمیگردد؟
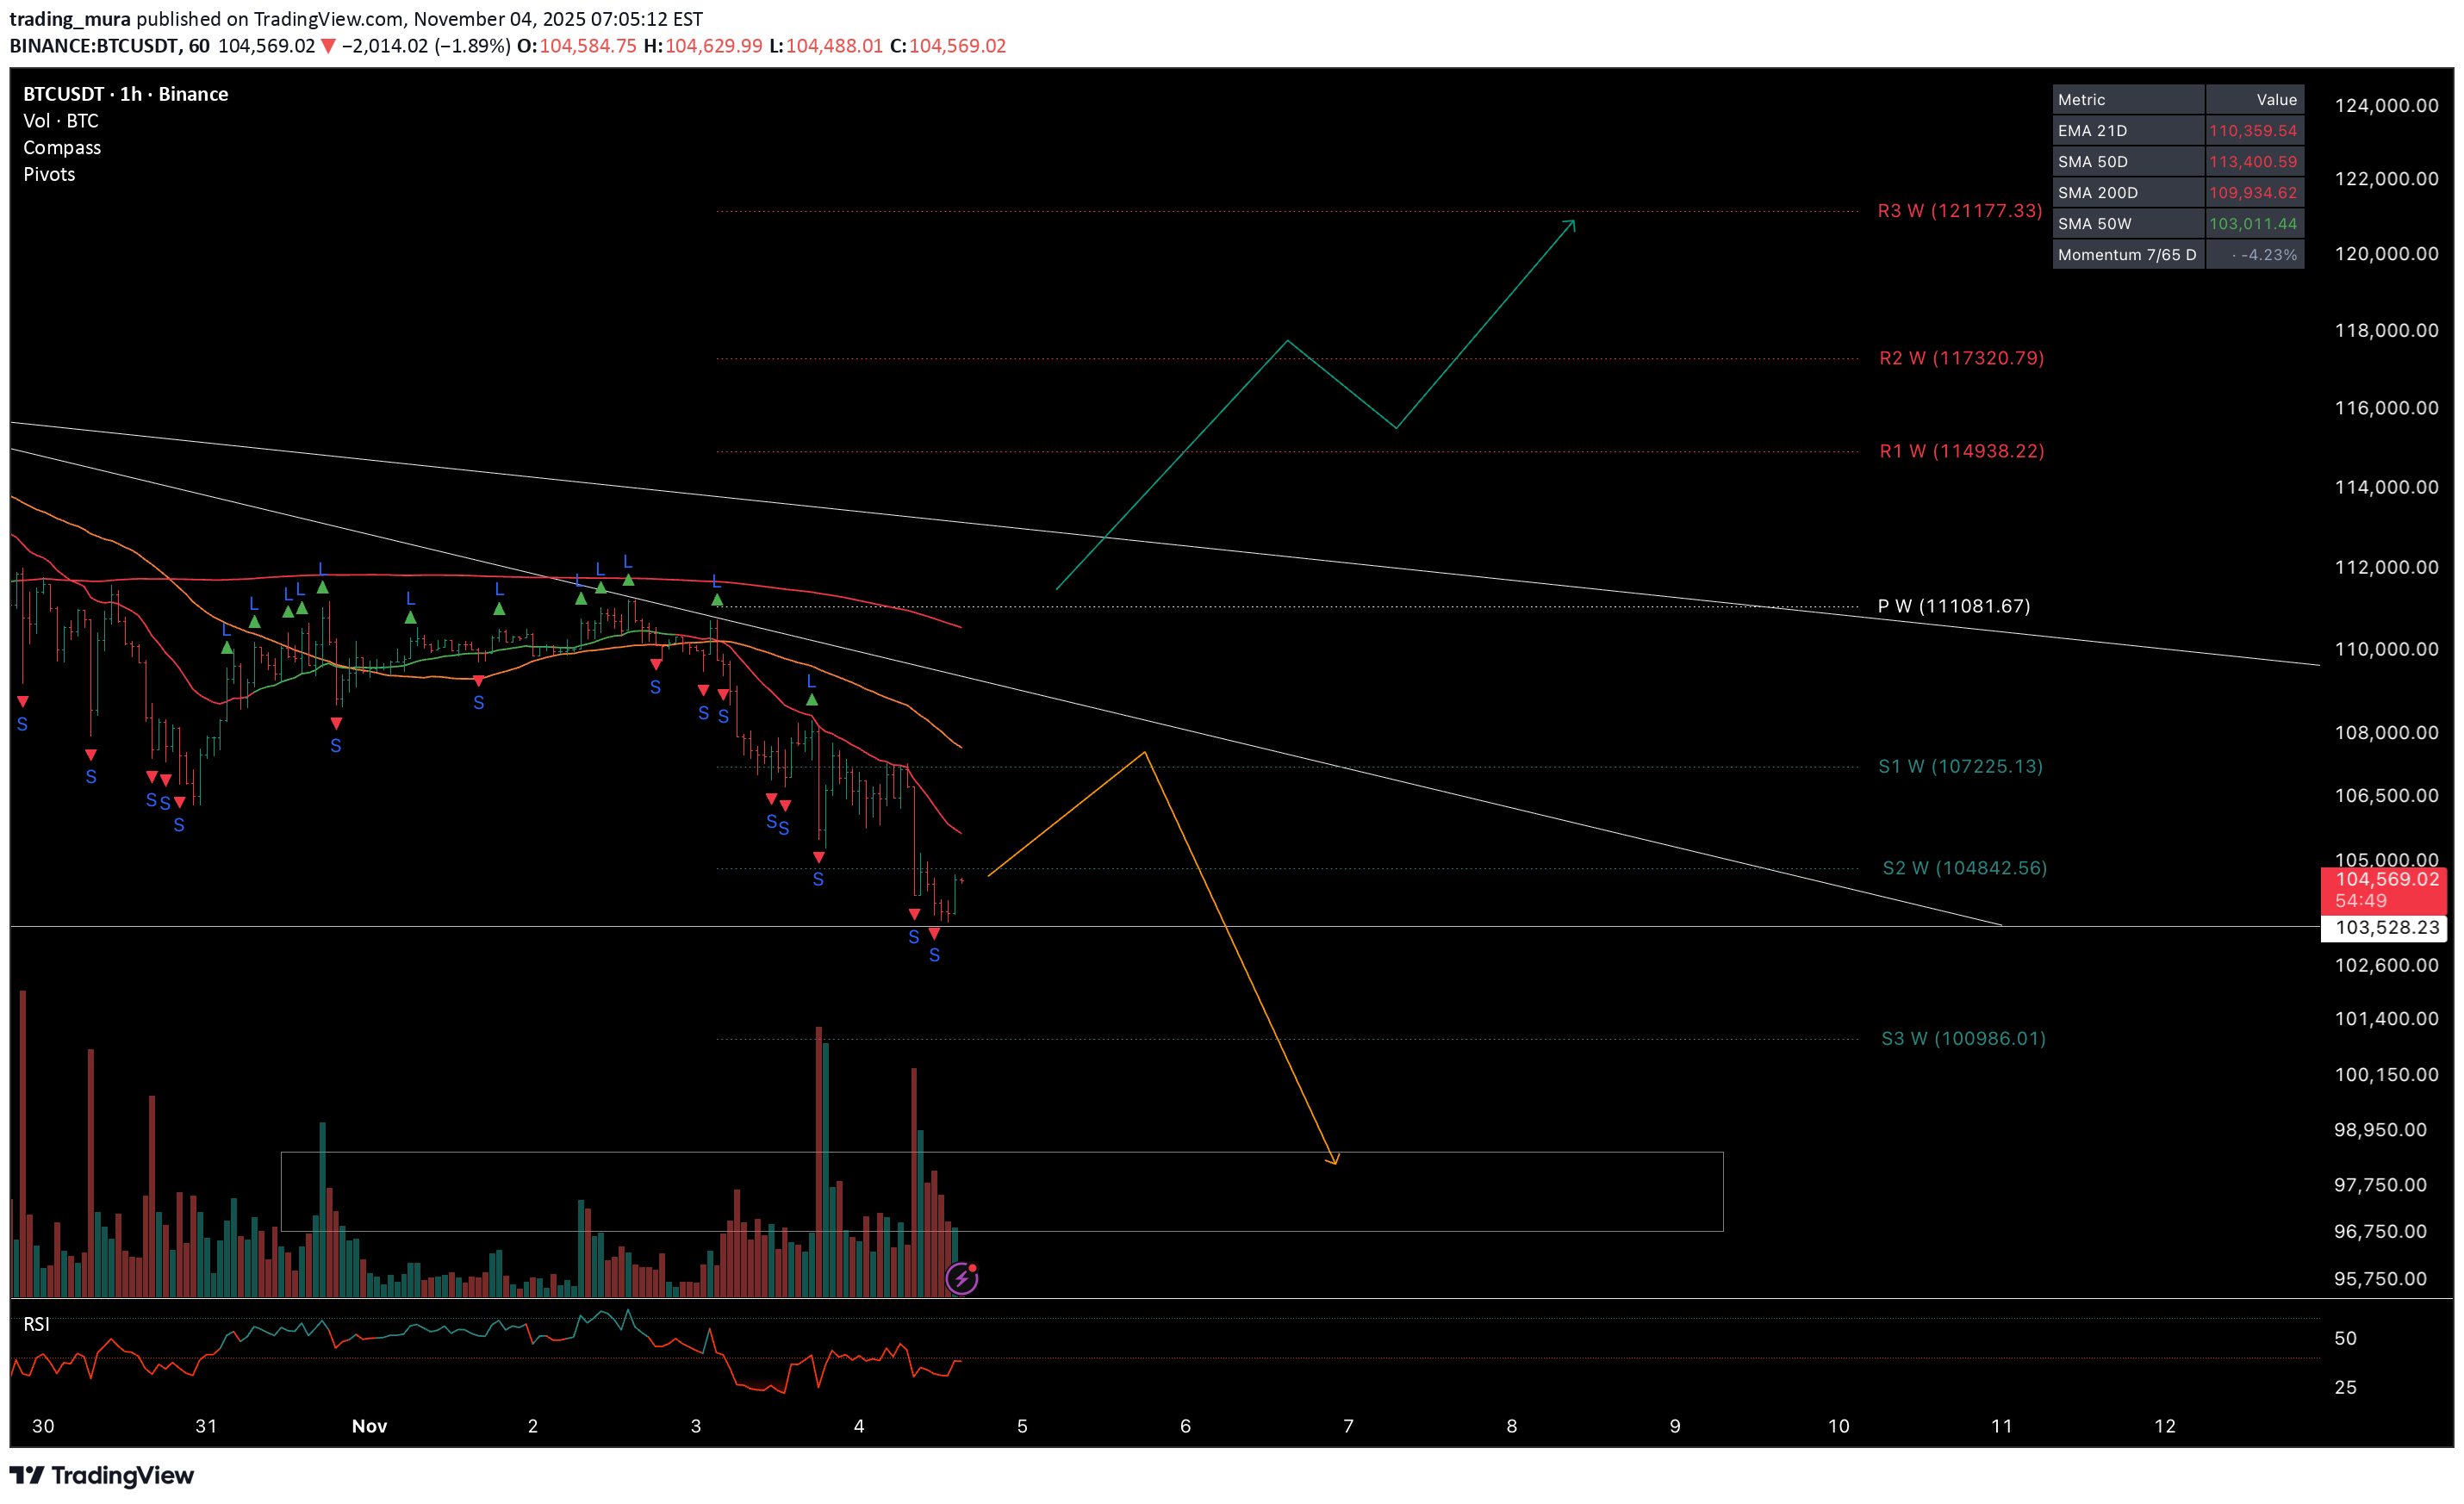
Last week, the price started to follow our bearish scenario and reached two targets. At the moment, the downward movement continues. The key level is 103K — if it breaks, a decline toward 97K is likely. Bullish sentiment will return only after breaking and closing above 110K .
trading_mura
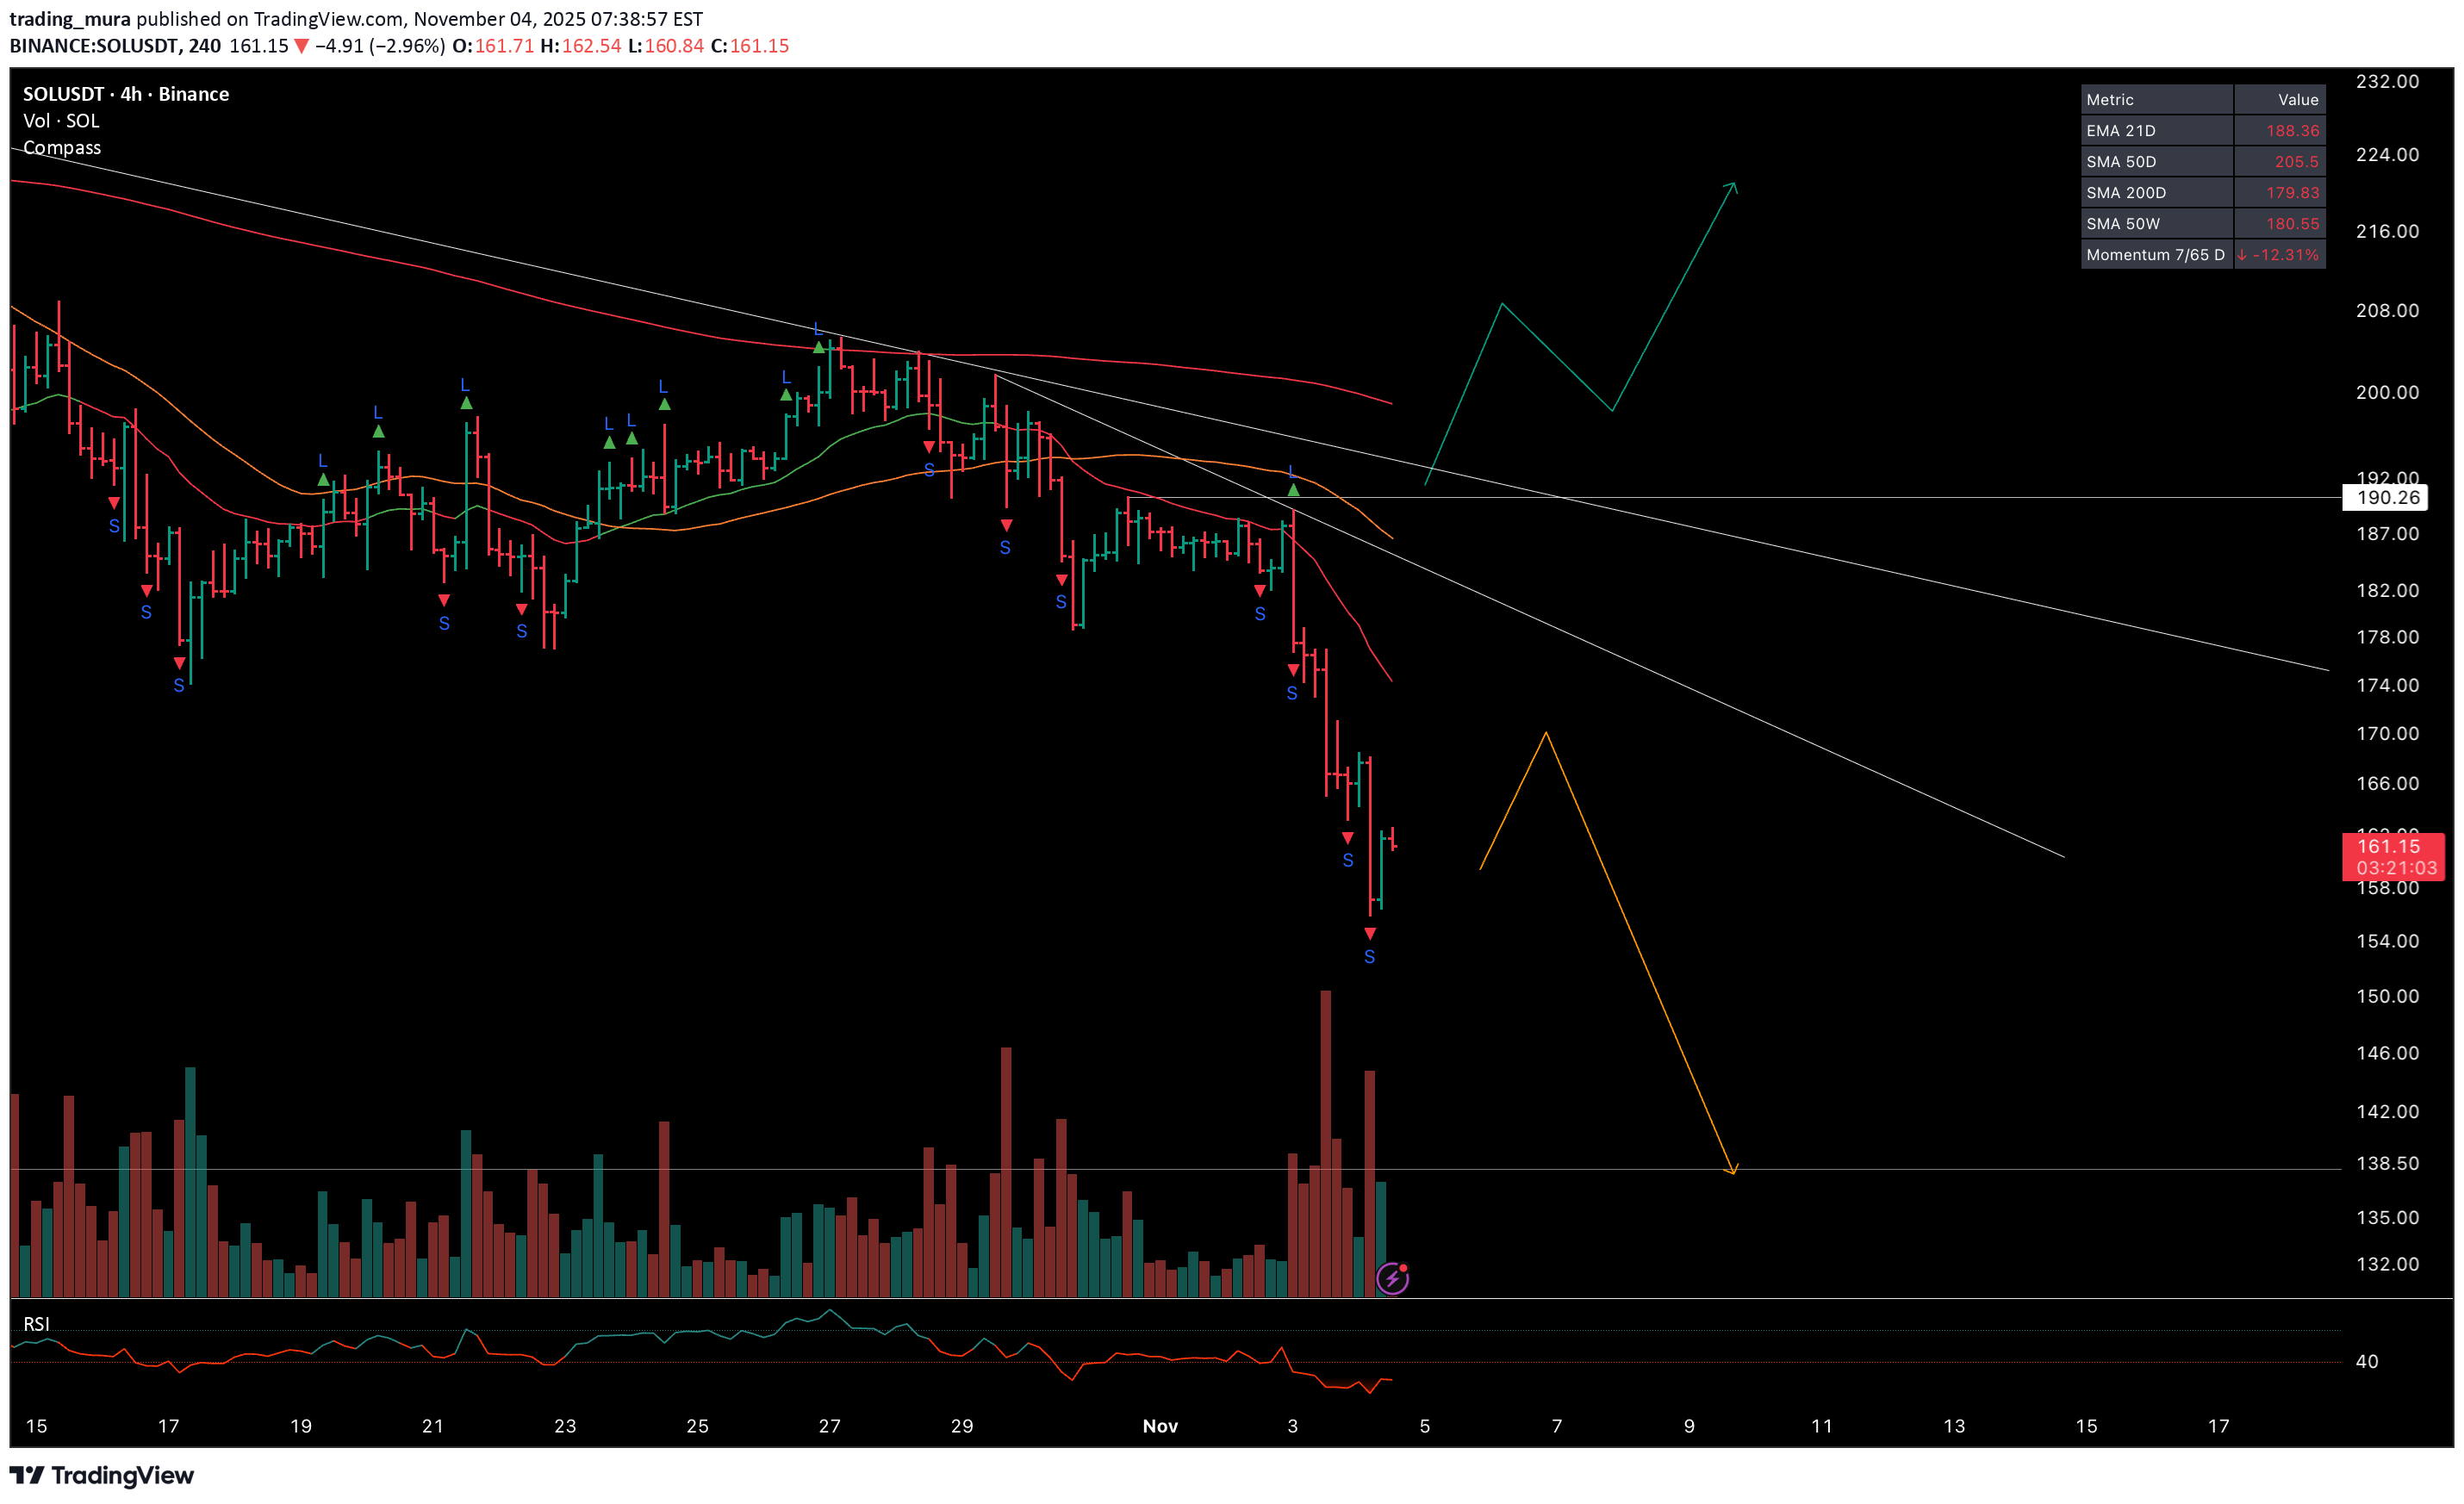
شکست یا تثبیت؟ دو سناریوی کلیدی قیمت SOL: هدف ۲۱۸ یا حمایت ۱۹۳؟
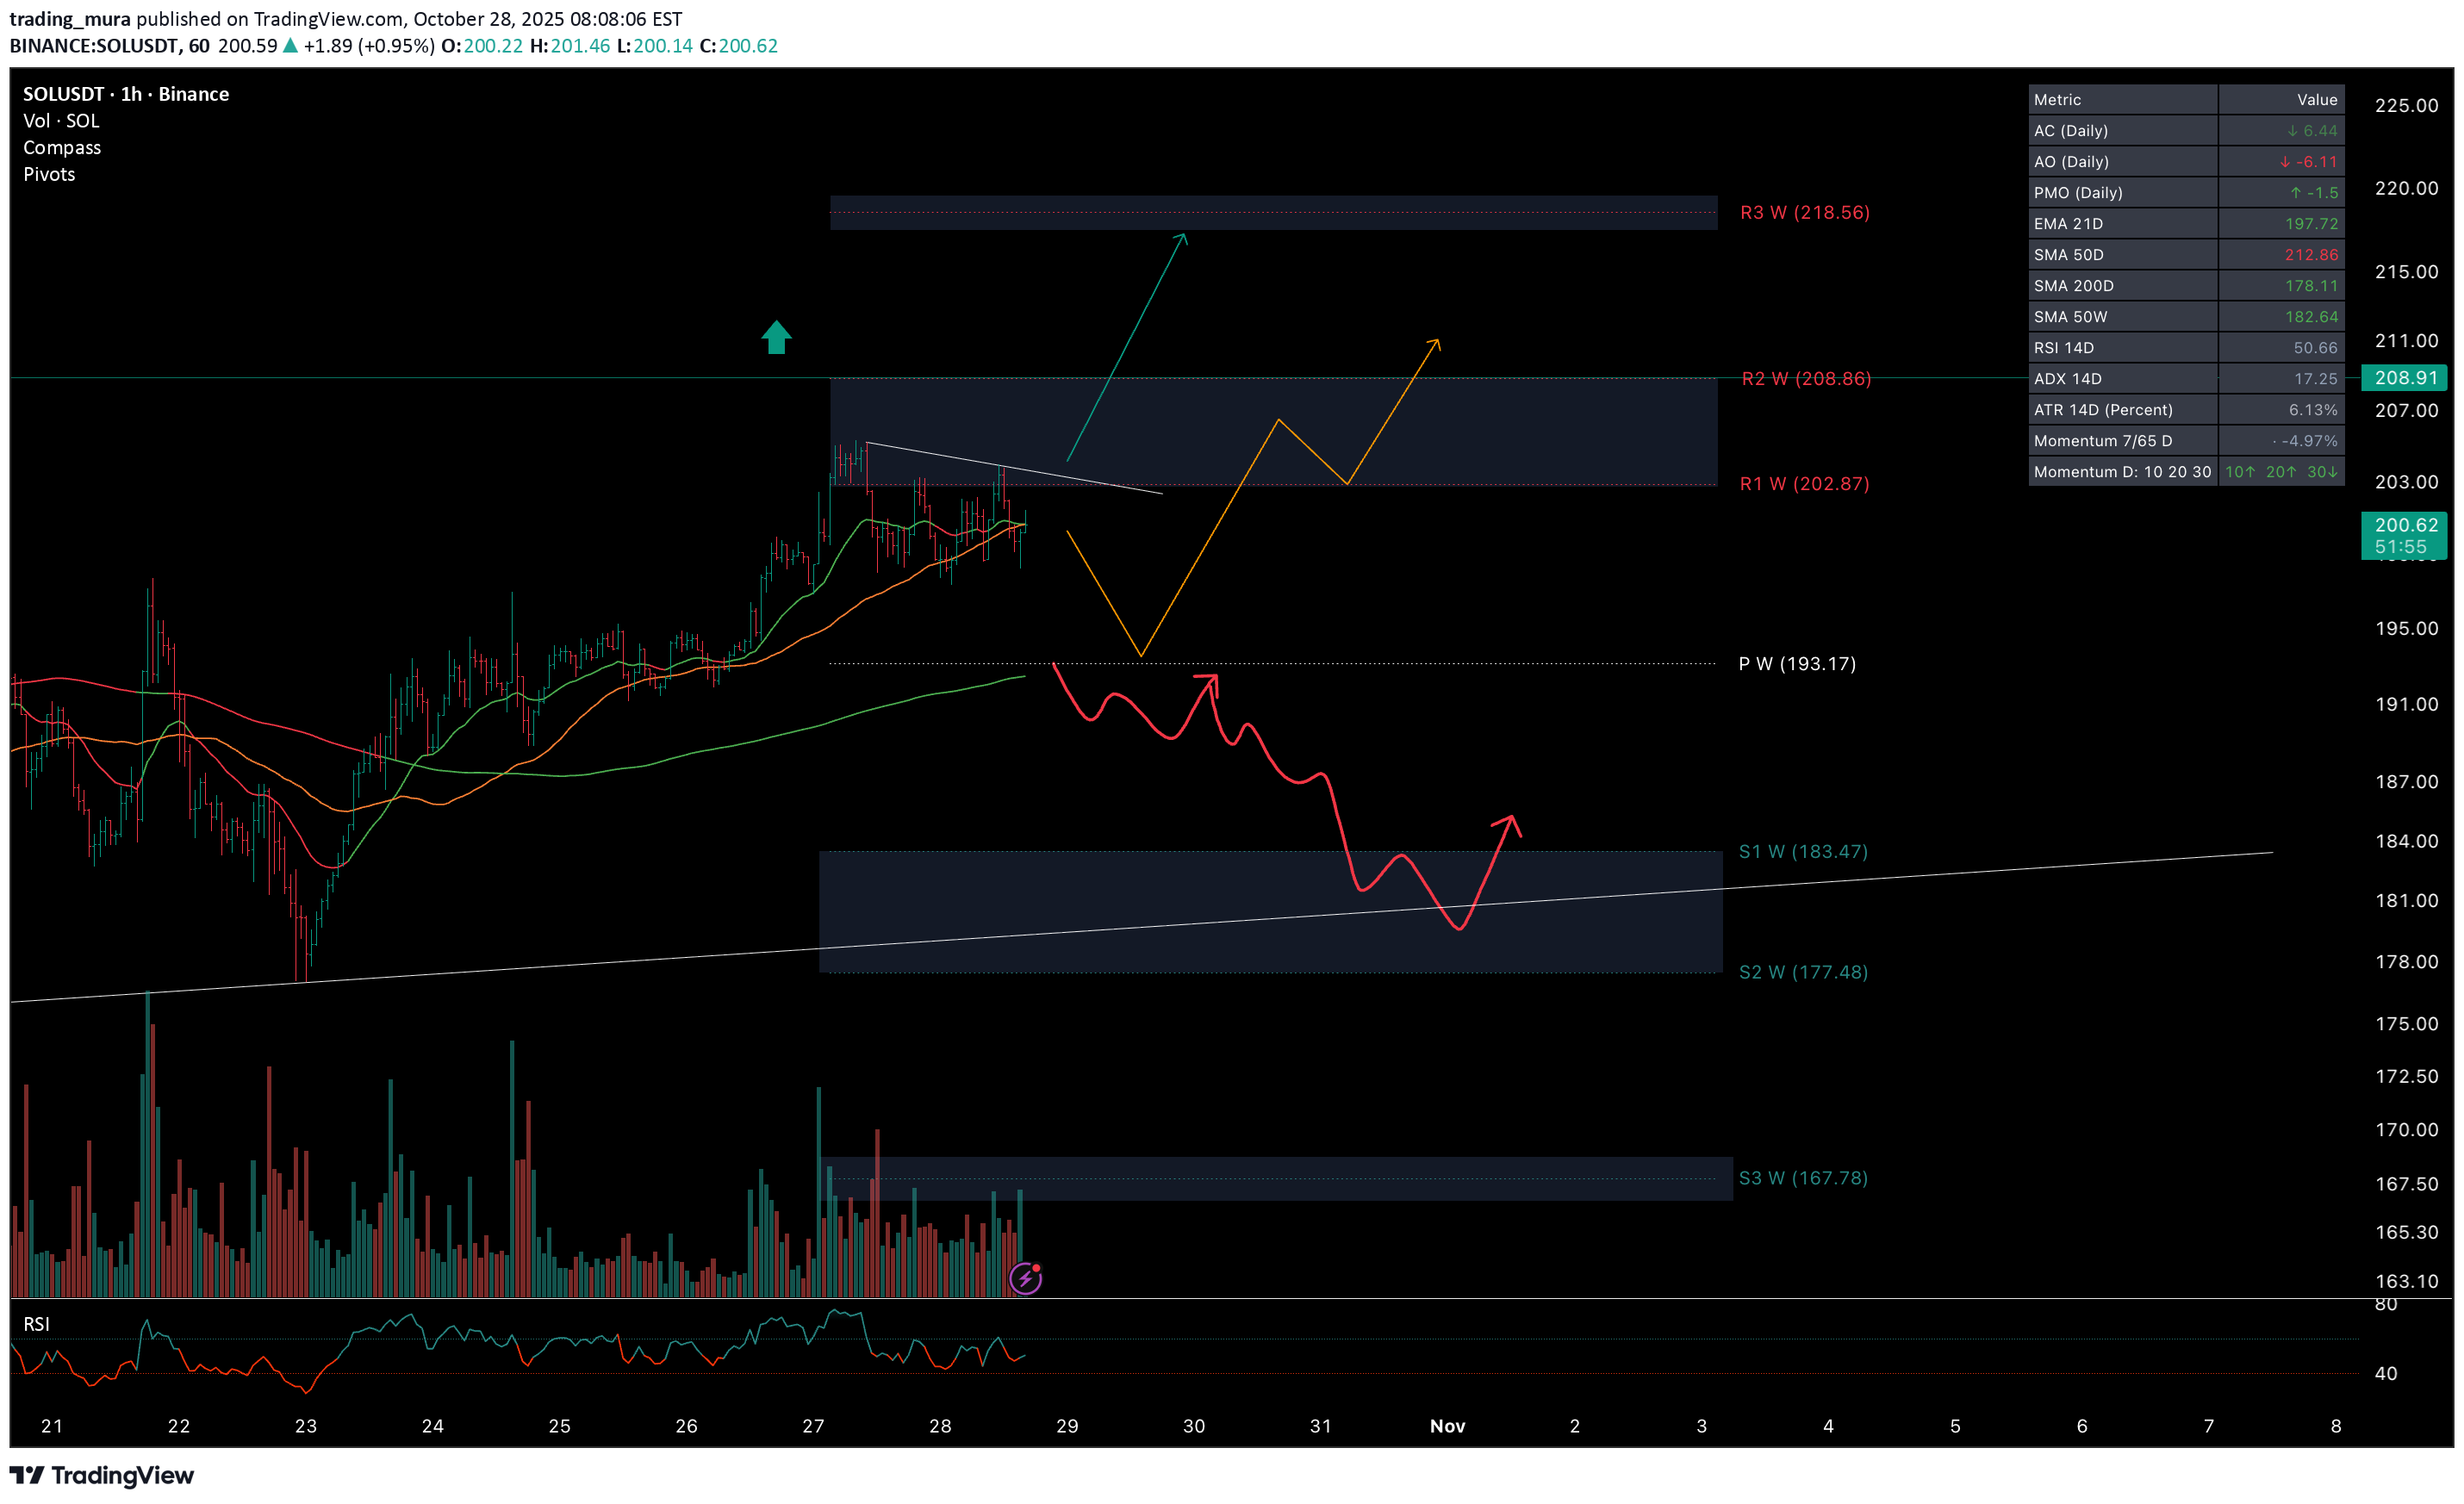
Last week, the price also followed our orange plan. Right now, it’s in a phase of local consolidation. If the descending trendline breaks, the price is likely to continue rising toward the 218 target. If the local low breaks instead, a correction toward the weekly pivot point at 193 is possible — I expect to see a bounce and a quick recovery from there; otherwise, the price may continue falling toward the ascending trendline .
trading_mura
حمایت حیاتی اتریوم کجاست؟ سقوط تا کجا ادامه دارد؟
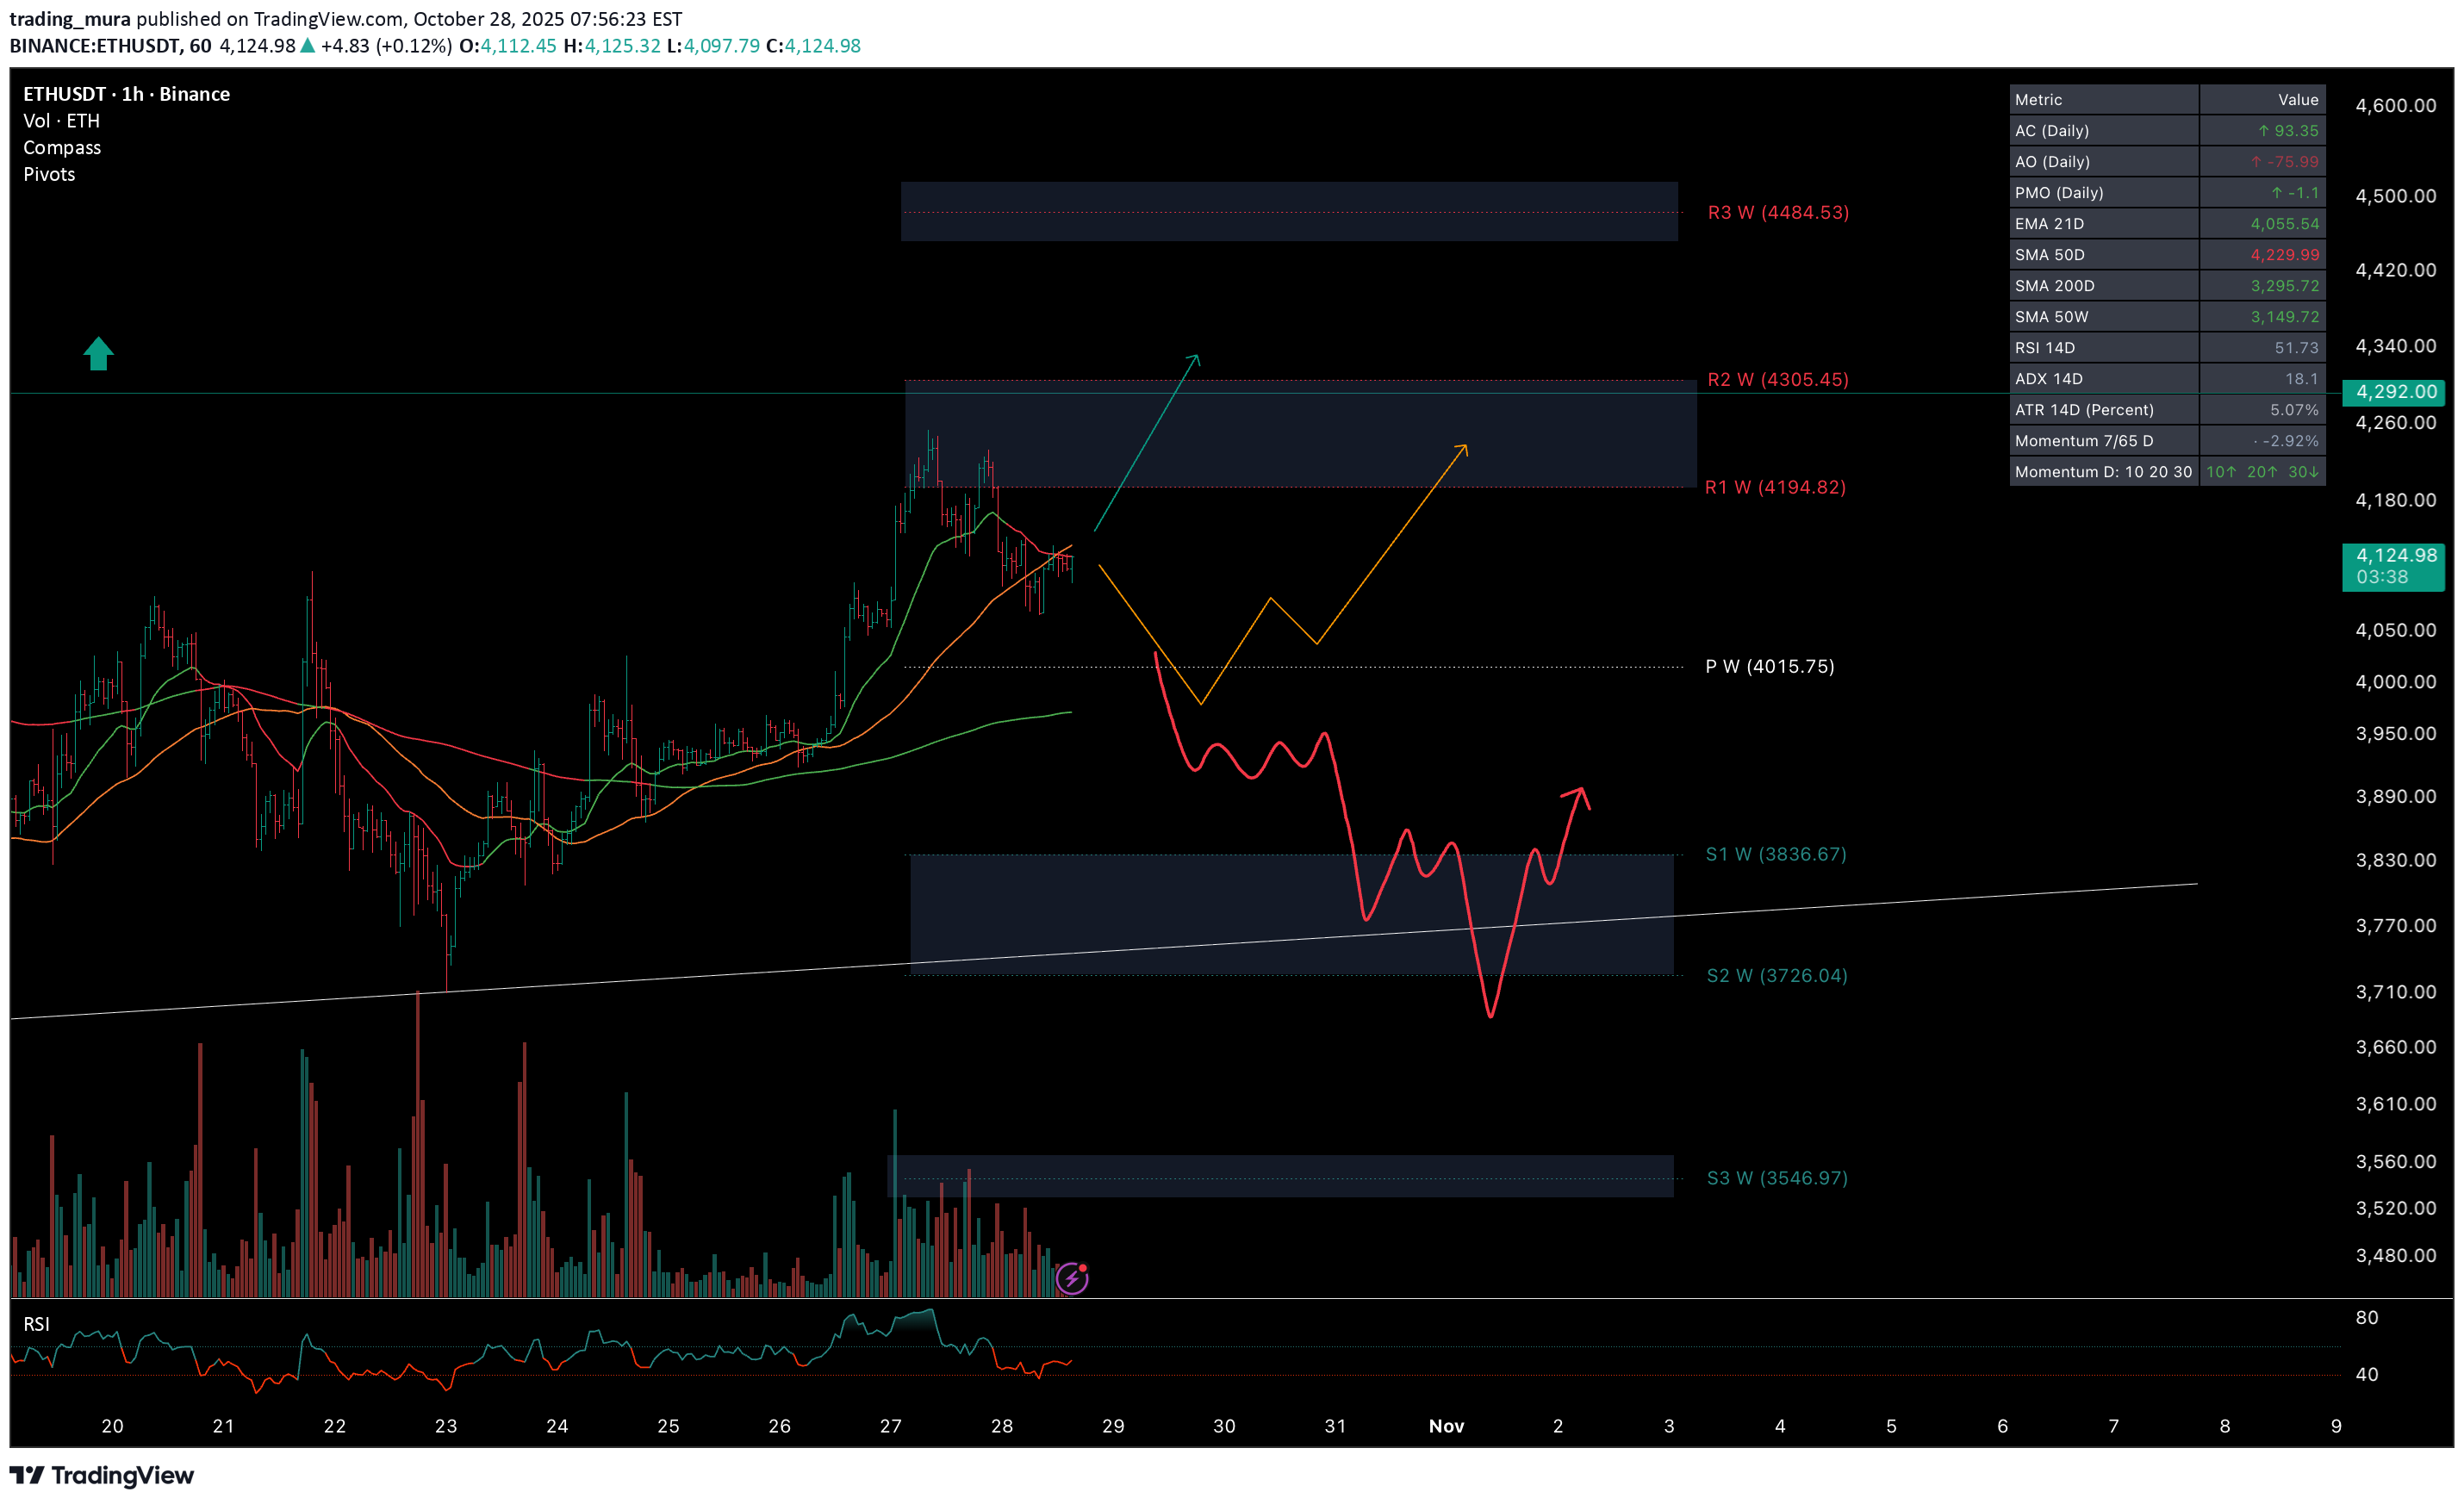
Last week, Ethereum moved according to our orange scenario. At the moment, the price is in a local downward correction. The weekly pivot point is at 4,015 — if it breaks, we’ll need to see a bounce from the 200 SMA and a quick recovery above the reversal level. Otherwise, the chances increase for a move toward the trendline.
trading_mura
بیت کوین در مسیر اصلاح: مراقب سطح کلیدی ۱۱۲,۲۳۰ و میانگین ۲۰۰ روزه باشید!
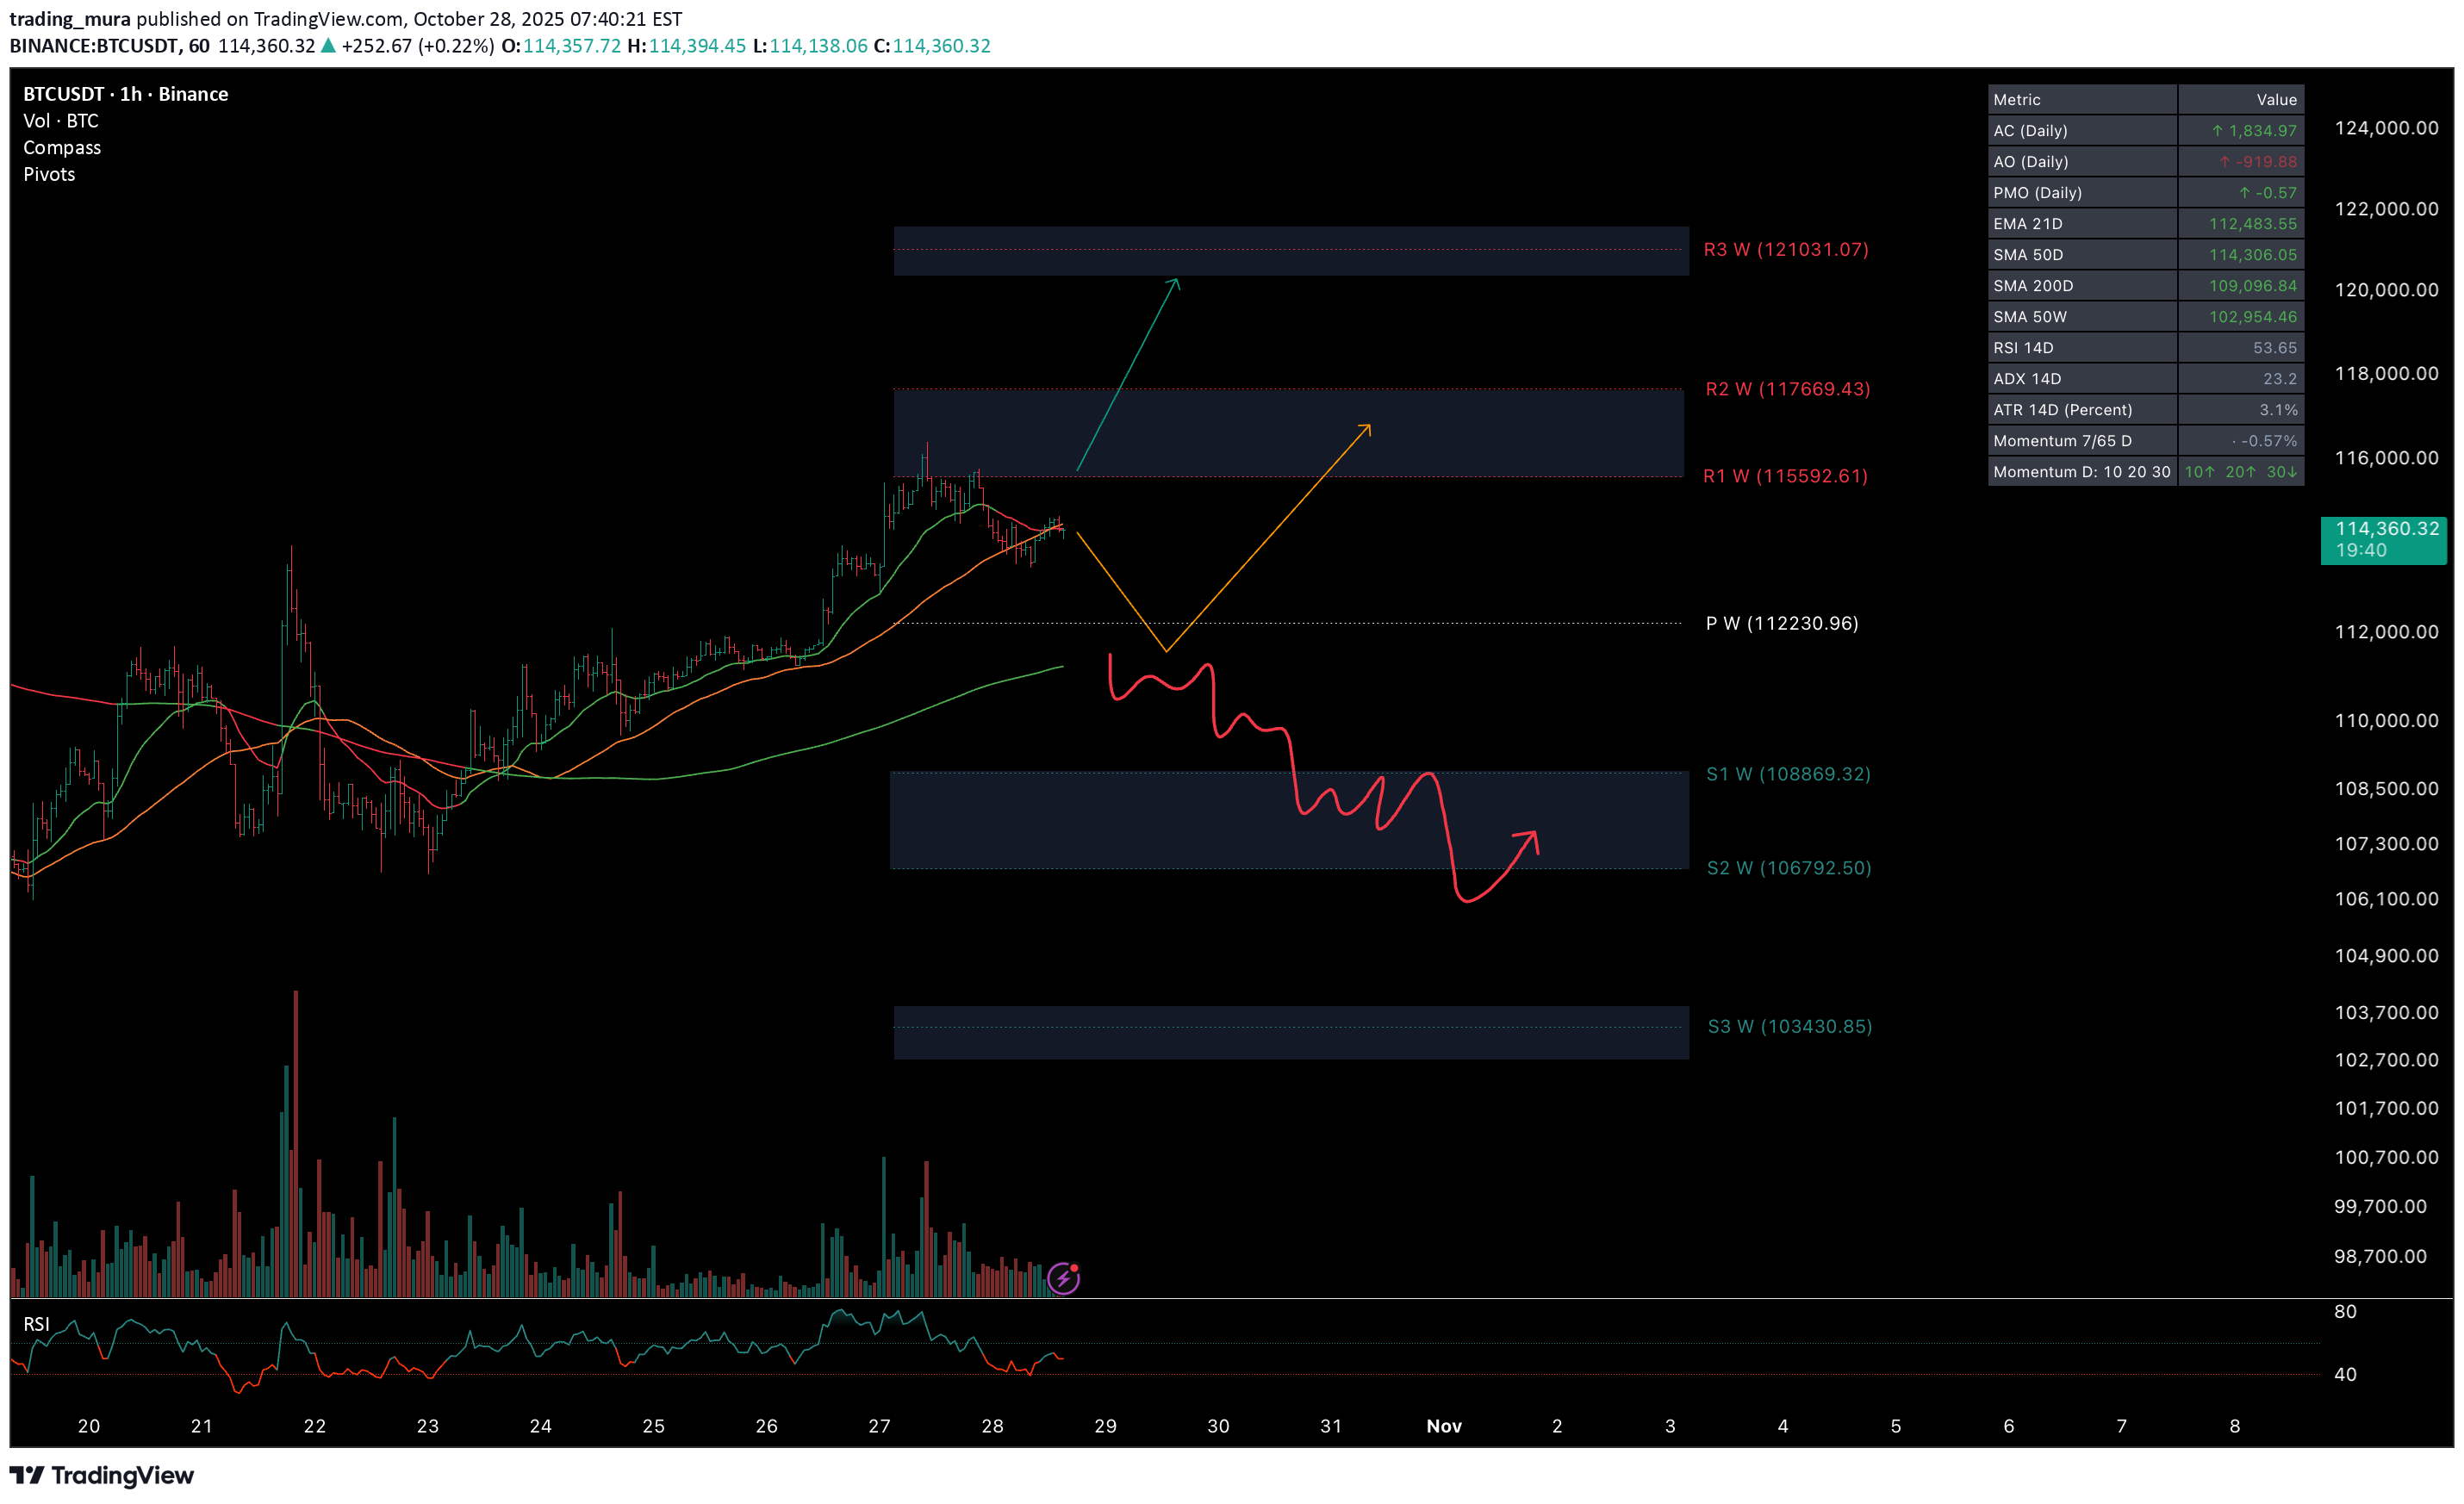
Last week, the price followed our orange scenario and reached the first target over the weekend. This week started near the peak, and the price is now in a downward correction. There’s a chance to see the correction continue toward the weekly pivot point at 112,230 . However, if we don’t see a reaction from the 200 SMA and a quick recovery back above the weekly level, the probability of reaching the support zone increases — that’s where it’ll be important to watch the price action .
trading_mura
واکنش قیمت سولانا (SUI): فرصت خرید در محدوده ۲.۴۲ تا ۲.۴۷؟

Sui has already reacted from the weekly pivot point at 2.62 and is now showing a slight correction. Locally, we could see a bounce from the 2.42–2.47 range. If the price returns above the pivot point, the next target will be 3.00 . In case of negative market sentiment and a break below 2.28 , I expect a decline toward 1.89 .
trading_mura
رشد انفجاری XRP: آیا این ارز به زودی به سقف ۲.۸۶ میرسد؟

Over the past 4 days, XRP has shown a steady recovery. At the moment, the price is sitting at the weekly pivot point. We may still see a breakout and a bounce from the 2.32–2.36 range. If, after breaking the pivot point, the price fails to quickly recover above it, there’s a high probability of continued downward movement toward 1.9. For now, the main scenario remains bullish — aiming to update the A high and approach the 2.86 level.
trading_mura

trading_mura
اتریوم در مسیر صعود محلی: منتظر شکست ۳۸۱۷ و هدف ۴۲۹۲!

Last week, the price also continued its downward movement, but on the Binance chart, it received a positive reaction from the support zone. At the moment, the price is in a local uptrend. The risk level for this week is 3,817 — if it breaks and the price fails to recover quickly, we could see a drop toward the 3,365 target. As long as the price remains above this level, the goal is to reach and break the previous high at 4,292 .
Disclaimer
Any content and materials included in Sahmeto's website and official communication channels are a compilation of personal opinions and analyses and are not binding. They do not constitute any recommendation for buying, selling, entering or exiting the stock market and cryptocurrency market. Also, all news and analyses included in the website and channels are merely republished information from official and unofficial domestic and foreign sources, and it is obvious that users of the said content are responsible for following up and ensuring the authenticity and accuracy of the materials. Therefore, while disclaiming responsibility, it is declared that the responsibility for any decision-making, action, and potential profit and loss in the capital market and cryptocurrency market lies with the trader.