
tradexict
@t_tradexict

What symbols does the trader recommend buying?
Purchase History
پیام های تریدر
Filter
tradexict
ETH/USDT Technical Overview – June 14, 2025
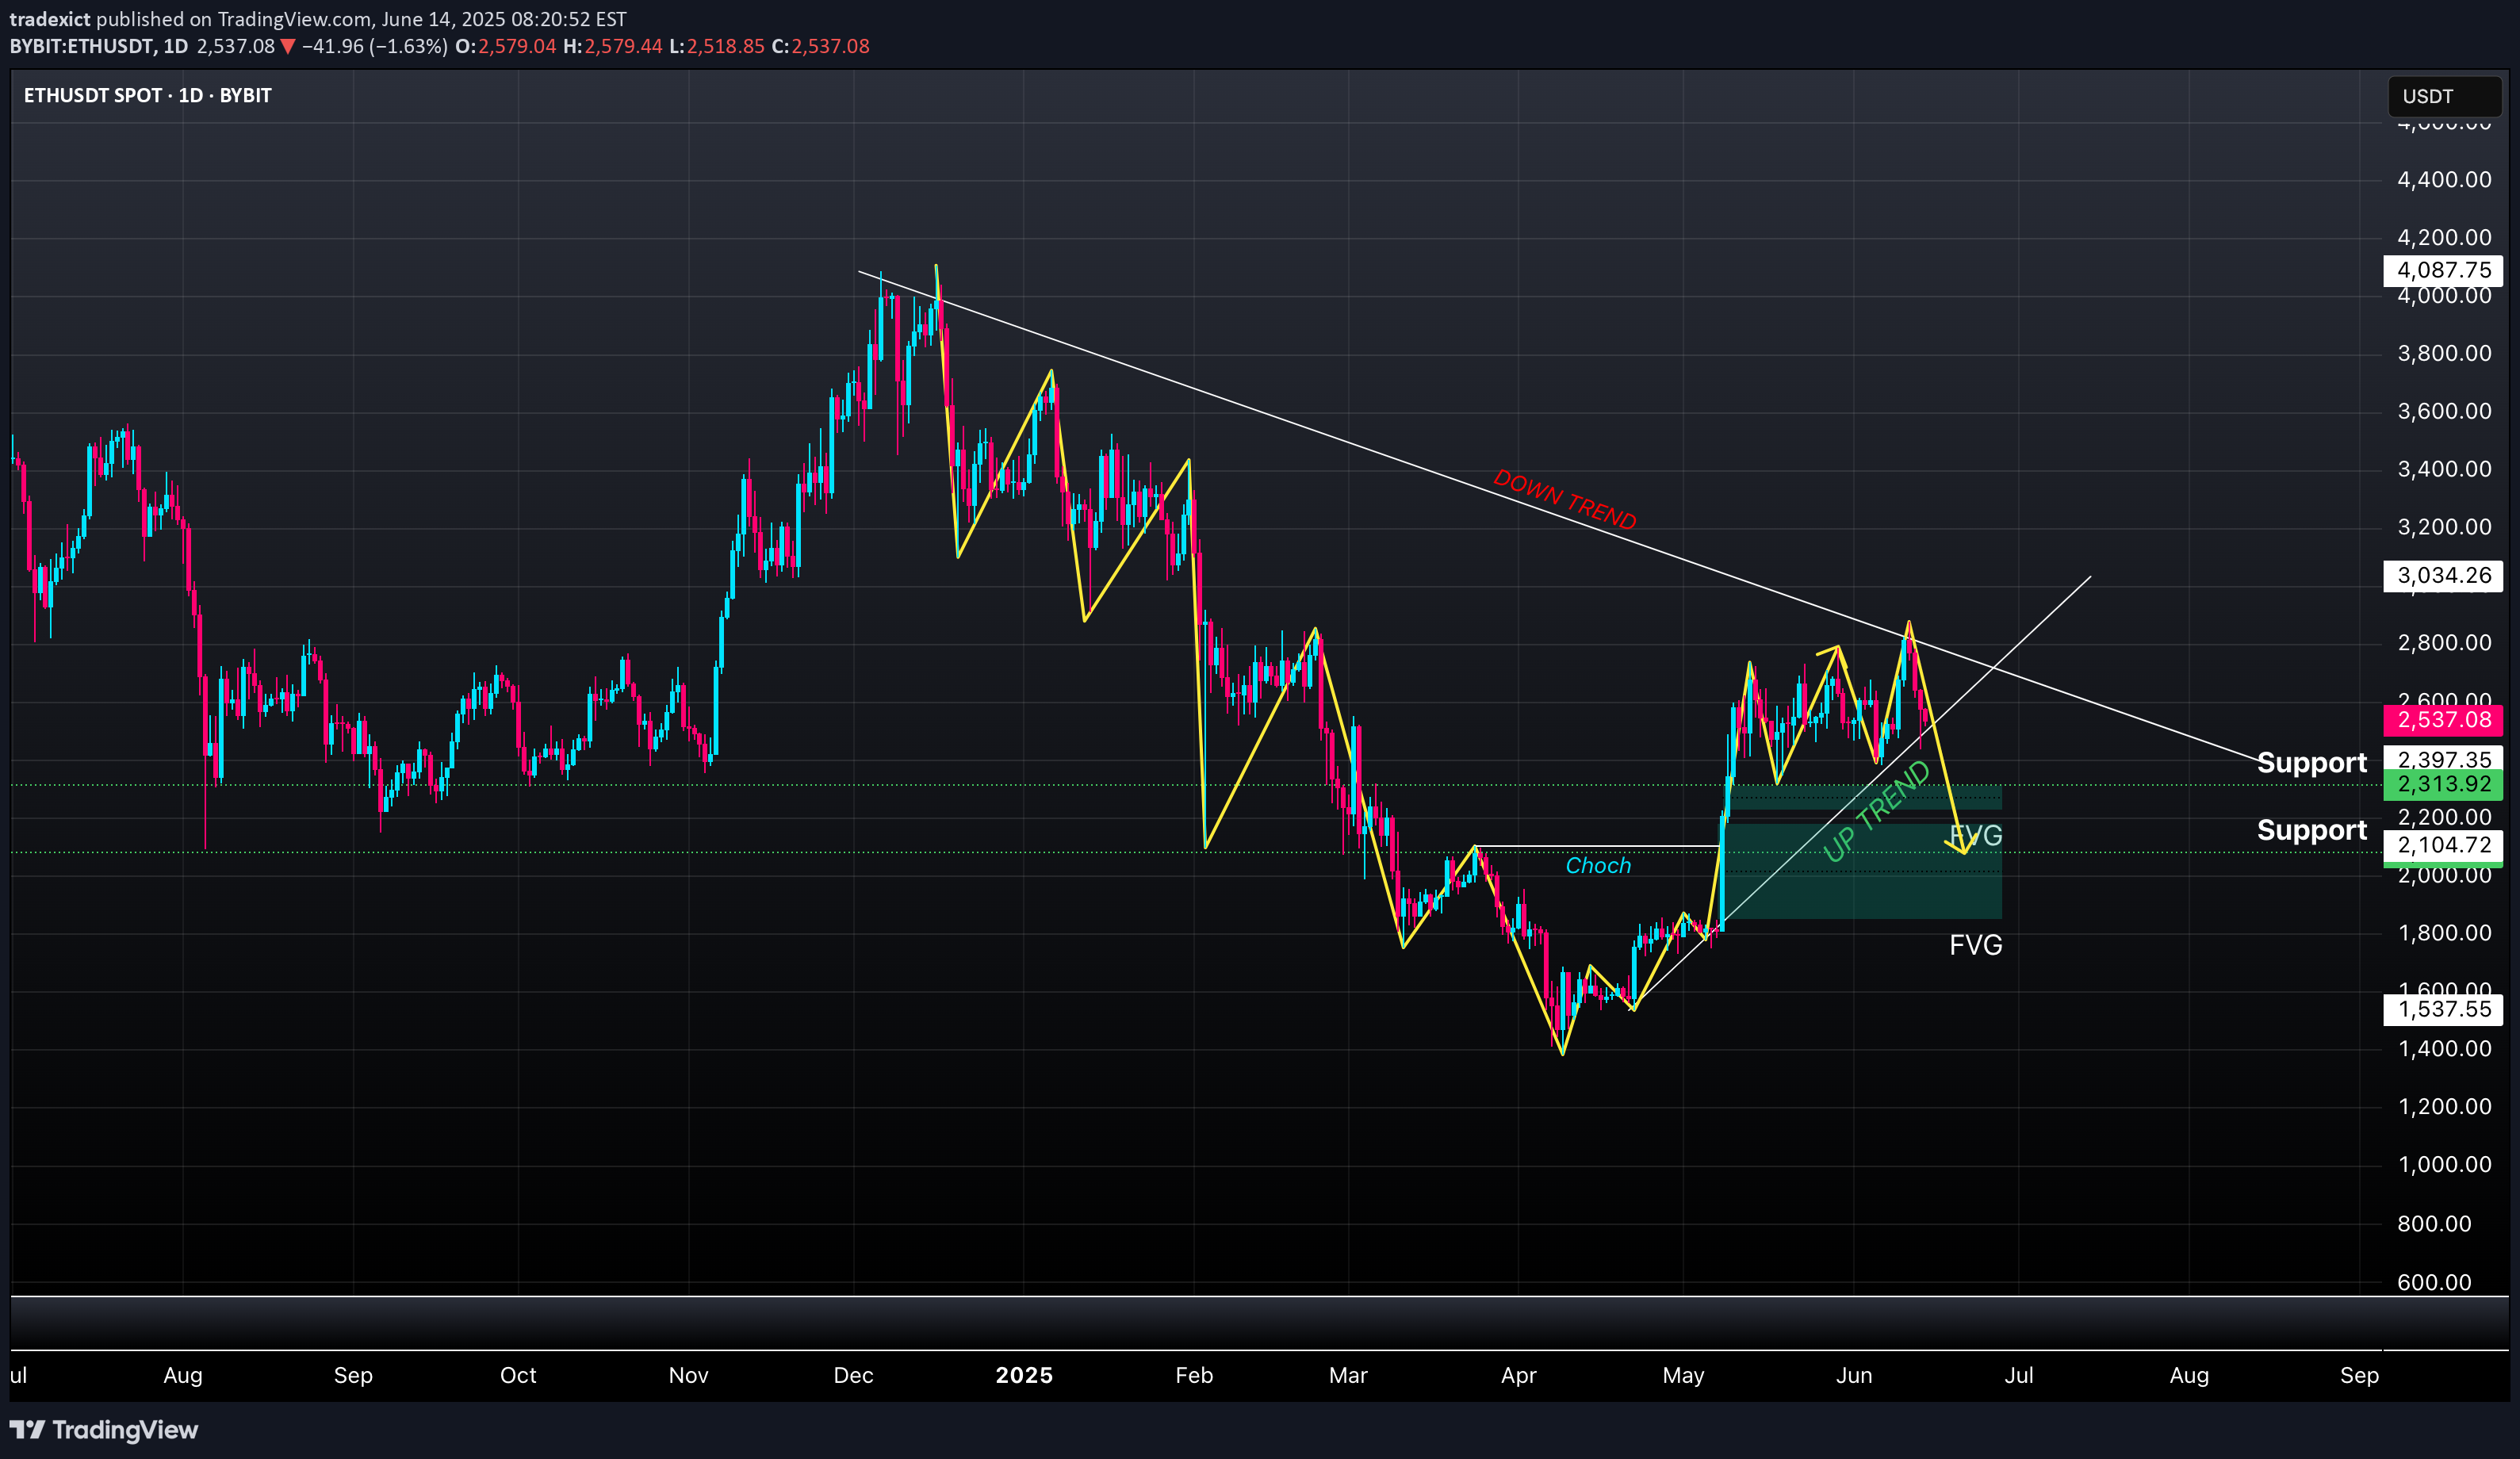
📝 ETH/USDT Technical Overview – June 14, 2025Timeframe: 1D (Daily)Exchange: Bybit SpotCurrent Price: $2,538.97Daily Change: -1.55%🔍 Market Structure Overview:Primary Trend: Still bearish on the macro (lower highs from November to April).Change of Character (CHoCH): Detected around mid-April → first signal of bullish intent.Short-term Trend: Bullish structure formed from April to early June (marked "UP TREND").Recent Break: Price has broken the bullish trendline and is currently pulling back.🧠 Smart Money Concepts:Fair Value Gap (FVG):Noted below the current price zone – acting as a potential draw for liquidity. Price may fill this imbalance before deciding on further direction.CHoCH Confirmation:The change in character initiated a shift, but without a BOS (Break of Structure) above $3,034, macro bearish bias remains intact.🛠️ Key Levels:TypePrice ($)NotesResistance3,034.26Key swing high, trendline confluenceSupport2,397.35Minor supportSupport2,313.92Local liquidity zoneSupport2,200–2,104Strong demand zone + FVG areaSupport1,537.55Major historical support🔮 Potential Scenarios:📉 Bearish Scenario:Continuation of rejection from downtrend resistance.Pullback into the FVG around $2,200–$2,100.Potential bullish reaction from there.If broken, next major support lies around $1,537.55.📈 Bullish Scenario:Support holds at $2,313–$2,200, bounce begins.Break and close above $2,800–$3,034 would confirm a macro trend shift.⚠️ Bias Today:Neutral to BearishUntil we see a strong bullish reaction from the FVG or a reclaim of the trendline, pressure remains to the downside.
tradexict
Daily BTC Technical Analysis – Bearish Evidence (Short Setup)
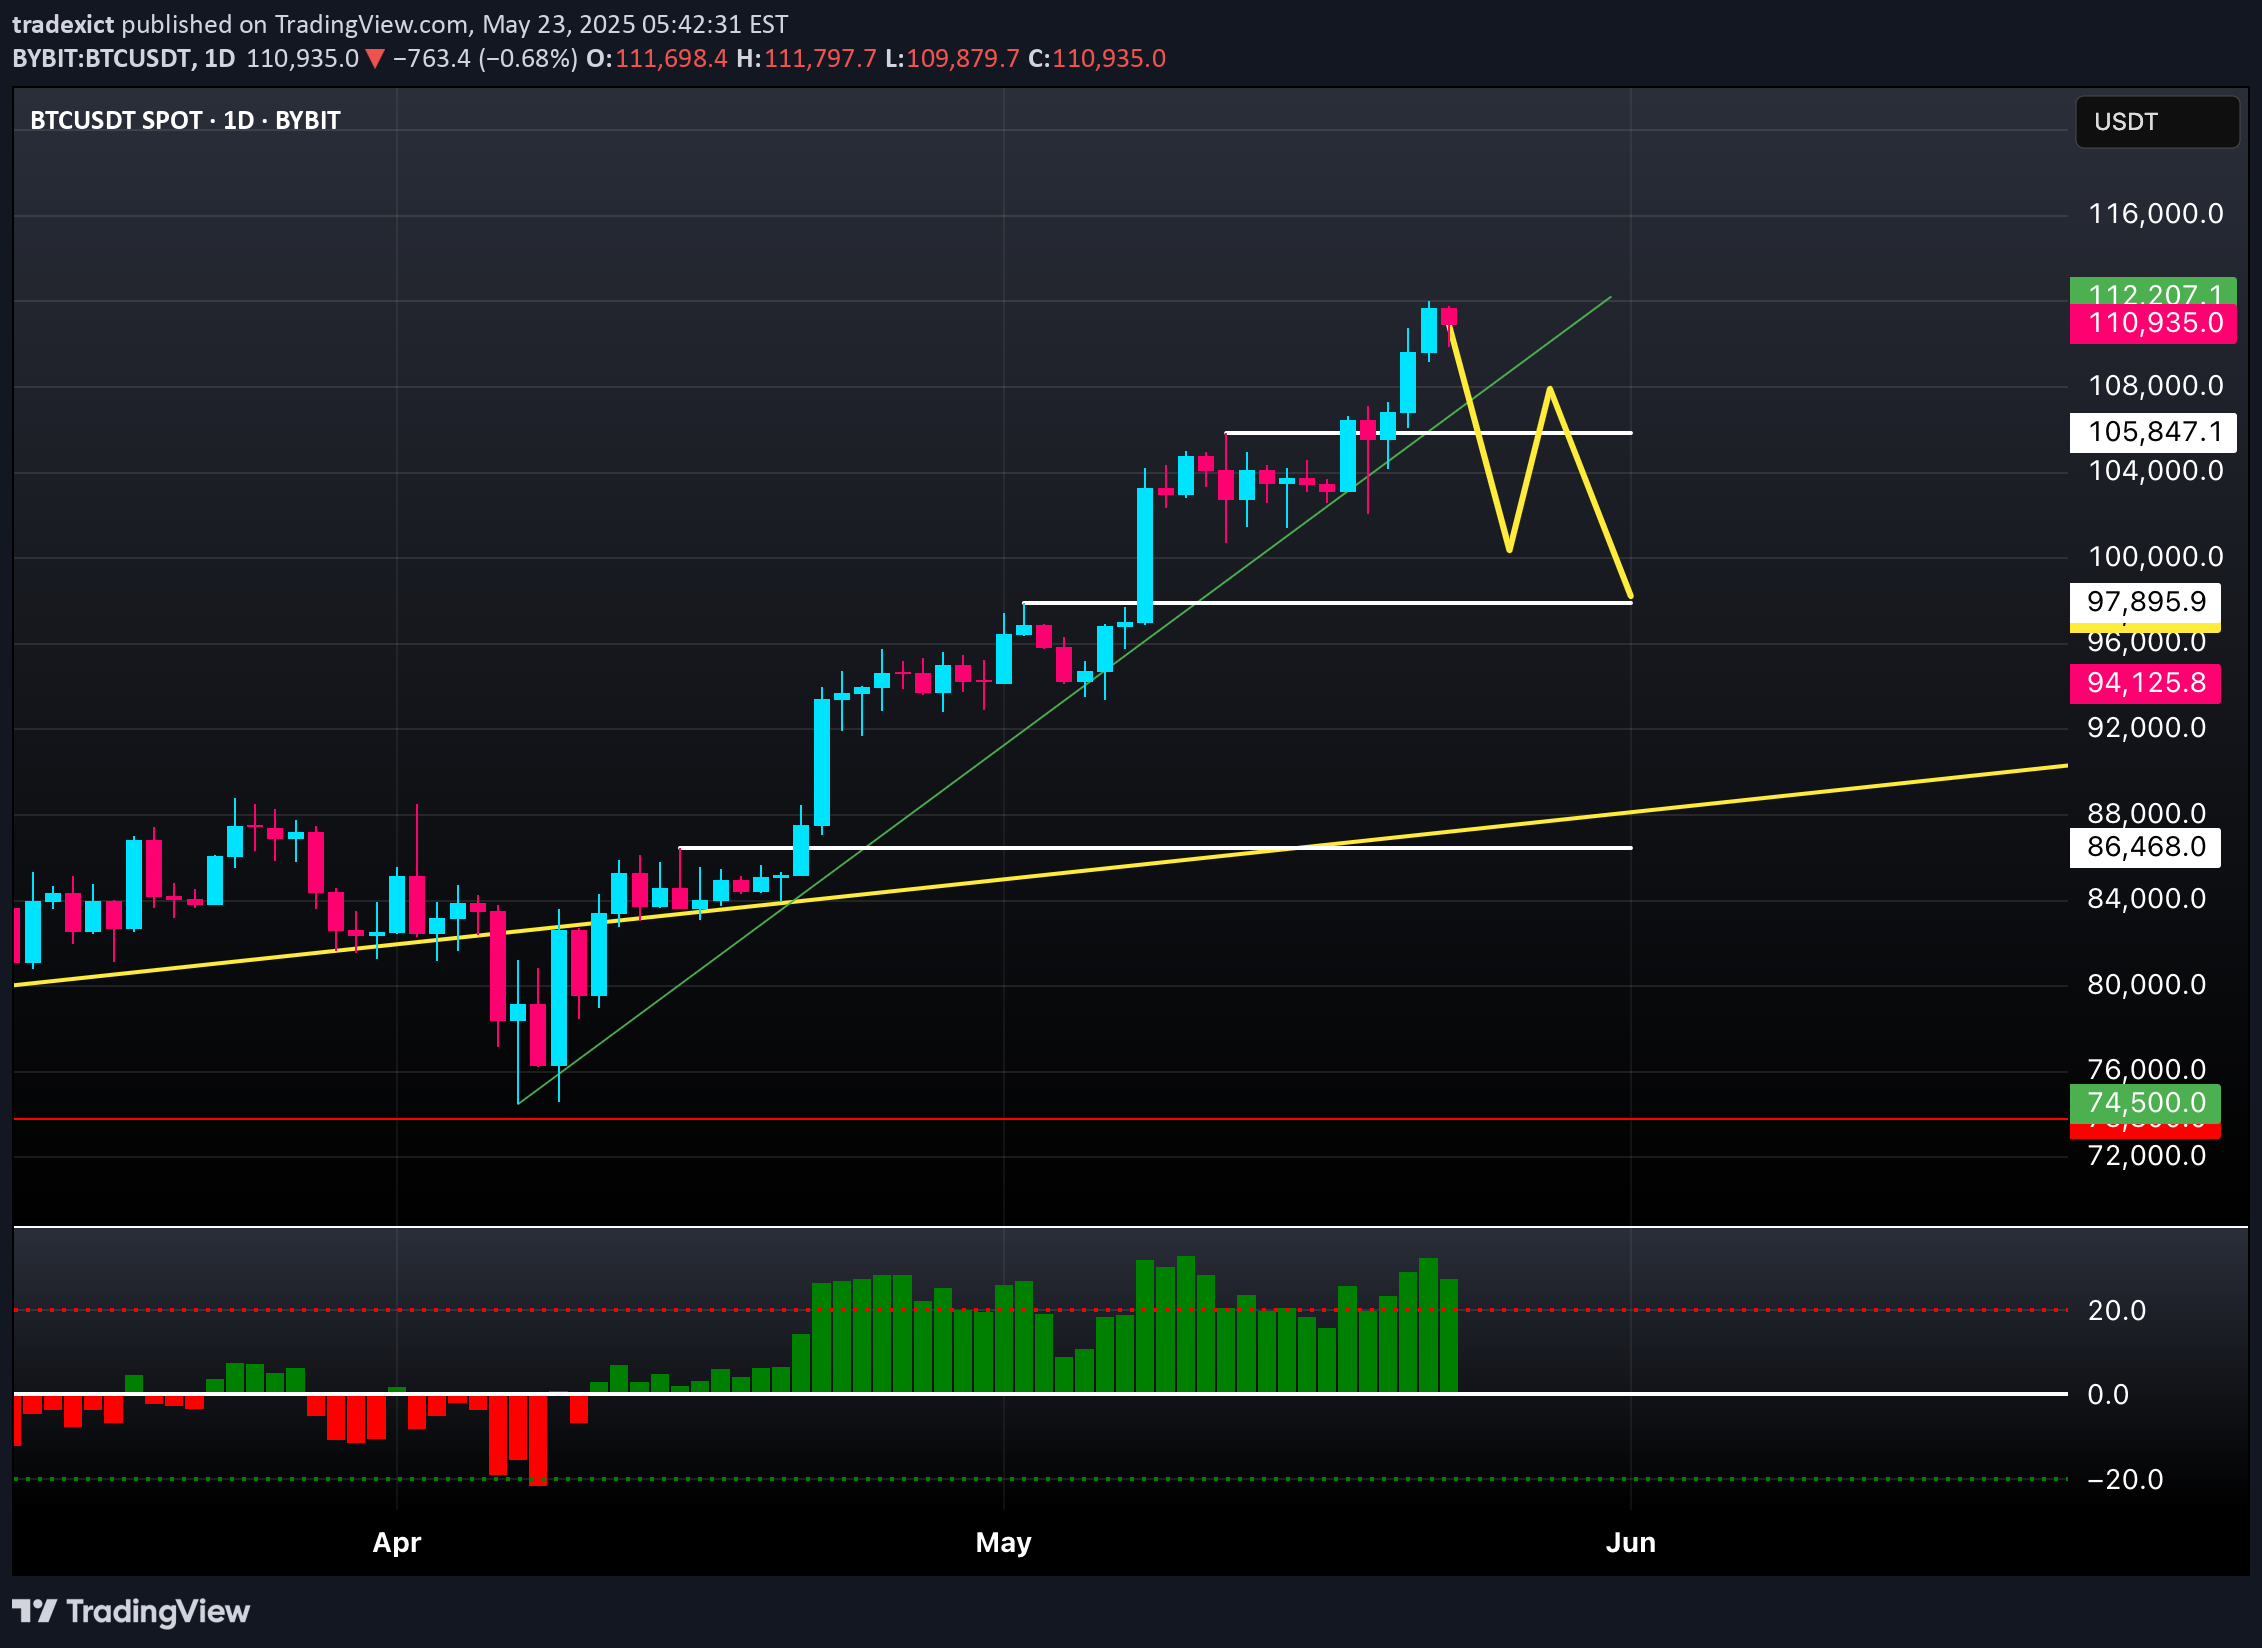
1. Rising Wedge PatternThe daily chart shows a Rising Wedge formation – a technical pattern that often signals a potential trend reversal downward.Moreover, the price increase is accompanied by decreasing volume, reinforcing the likelihood of an upcoming correction.(Source: Investopedia)2. Indicators in Overbought TerritoryRSI (Relative Strength Index): above 70 – signals overbought conditions.CCI (Commodity Channel Index): above 100 – also signals overbought.Williams %R: above -20 – again, confirms excessive buying pressure.These conditions typically indicate market exhaustion and a high chance of short-term pullback.(Source: CentralCharts)3. Bearish Harami Candlestick PatternA Bearish Harami has formed on the chart – a potential reversal pattern, especially after an uptrend.It often marks a shift in market sentiment and weakening momentum.4. Bearish DivergenceThere is a clear bearish divergence between price and RSI – while price makes new highs, RSI is trending lower.This classic signal suggests weakening buying power and a possible trend reversal.(Source: CentralCharts)🧭 Key Support Levels to Watch$107,000: first minor support area.$100,000: a strong psychological support level.$92,000: deeper support, aligned with historical trading zones and moving averages.📊 SummaryWhile Bitcoin’s long-term trend remains bullish, the short-term indicators suggest a potential correction.Traders looking for short opportunities should monitor the technical signals above and use key support zones as potential profit targets.
tradexict
XRPUSDT Chart Analysis (as of April 5, 2025)

📉 General Trend:This is a short-term chart (1H timeframe).The market is moving sideways with high volatility – no clear trend, but a range-bound movement between support and resistance levels.A directional breakout may be coming soon.🔍 Support and Resistance Levels:🔵 Support:2.0472 USDT – Key support with BOS and Discount zone.2.000 USDT – Strong Low + PM area below.1.920–1.950 USDT – Historical demand zone.🔴 Resistance:2.2244 USDT – Equilibrium zone + PDH.2.3556 USDT – Significant resistance with supply block.2.4978 USDT – Upper resistance level.2.7461 USDT – Strong resistance from previous highs.3.00–3.20 USDT – Major Premium zone with PM and Weak High.🎯 Short-Term Price Forecast (1–2 Days):If a breakout to the upside occurs:First target – 2.22 USDT, then 2.35 USDT.If a breakdown occurs:First target – 2.04 USDT, then 2.00 USDT.📉 Short Trade Setup:Entry: Around 2.22–2.23 USDT (PDH + resistance + potential BOS)Take Profit: 2.05 USDTStop Loss: Above 2.25 USDTRisk-to-Reward Ratio: ≈ 1:2Trigger: Bearish rejection candle or BOS near resistance.📈 Long Trade Setup:Entry: Between 2.04 – 2.06 USDT (demand zone + lower BOS)Take Profit: 2.22–2.24 USDTStop Loss: Below 2.00 USDTRisk-to-Reward Ratio: ≈ 1:2.5Trigger: Bullish hammer or confirmation candle with increasing volume.🔻 Lowest Expected Price:If 2.00 USDT breaks down, price could fall toward the 1.90–1.92 USDT zone.🔁 Potential Reversal Zones:High probability of reversal around 2.04–2.05 USDT, a key local low in a discount zone.Another bullish reversal may form if the price breaks and holds above 2.24–2.25 USDT with confirmation.🧠 Additional Notes:The chart includes many Smart Money Concepts (SMC): BOS, CHoCH, EQH, etc.There’s a clear battle between bulls and bears – we must wait for a confirmed breakout or breakdown.Volume is balanced – not indicating a strong impulsive move yet.
tradexict
ETHUSDT Chart Analysis (as of April 5, 2025)

📉 General Trend:Ethereum is in a clear and strong downtrend since the peak around $4,042 (early 2024).A series of BOS (Break of Structure) and CHoCH (Change of Character) to the downside confirm bearish control.A recent BOS below a weak low indicates further downside pressure.🔍 Support and Resistance Levels:🔵 Support:$1,592 – 0% Fibonacci level, a critical low. A breakdown could lead to $1,300 or even $1,000.$1,720–$1,760 – Minor support zone before the low.$1,300–$1,400 – Historical demand block.🔴 Resistance:$2,170 – 23.6% Fibonacci retracement.$2,400 – Order block and strong resistance area.$2,817 – 50% Fibonacci level.$3,512 – 78.6% Fibonacci retracement.$4,042 – Previous strong high.🎯 Short-Term Outlook (Next 1–2 Days):Likely trading range:Downside target: ~$1,750Upside target: ~$2,000–$2,050 (resistance zone)📉 Short Setup:Entry: $2,000–$2,050 (resistance block + bearish confirmation)Take Profit: $1,750–$1,720Stop Loss: Above $2,100Risk/Reward Ratio (RRR): ≈ 1:2.5Trigger: Rejection pattern (e.g., Bearish Engulfing or Shooting Star)📈 Long Setup:Entry: Around $1,600–$1,620 (support zone with confirmation)Take Profit: $1,950–$2,000Stop Loss: Below $1,580Risk/Reward Ratio (RRR): ≈ 1:2Trigger: Bullish hammer + increasing volume🔻 Lowest Expected Price:If the $1,592 level breaks, next strong support lies between $1,300–$1,400, with potential to drop as low as $1,000 in a worst-case macro scenario.🔁 Expected Reversal Area:A potential bullish reversal might happen at $1,592 if a bullish structure break or confirmation candle appears.An early reversal could occur if price breaks and holds above $2,200 with strong bullish momentum.🧠 Additional Notes:ETH currently appears weaker compared to BTC.A comparison with the ETH/BTC pair might reveal whether it’s a better time to hold BTC over ETH.Rallies are likely to be used by bears for shorting unless significant structure changes occur.
tradexict
General Chart Analysis & BTCUSDT Trading Plan (April 5, 2025)

Overall Market Trend:The chart shows a long-term bullish trend from 2023 up to early 2025.However, since the high at 110,994 USDT, we can observe a local downtrend, confirmed by multiple market structure breaks (CHoCH and BOS).Market Structure:Several Breaks of Structure (BOS) to the downside indicate the start of a mid-term bearish correction.The yellow ascending trendline is still intact, serving as a dynamic support level.The price is currently consolidating near the Equilibrium zone (~80,000 USDT).🔍 Support and Resistance Levels:Support:80,000 USDT – Equilibrium zone and trendline.72,773 USDT – Fibonacci 61.8% level.64,000–66,000 USDT – Strong demand/order block zones.49,140 USDT – Full 100% Fibonacci retracement, key long-term support.Resistance:86,800 USDT – Previous Day’s High (PDH).90,709 USDT – Fibonacci 32.8% retracement.96,398 USDT – Fibonacci 23.6% retracement.110,994 USDT – Local all-time high.🎯 Short-Term Price Prediction (Next 1–2 Days):The price is currently around 83,600 USDT, consolidating sideways.Near-term target range:Upside: Around 86,800 USDT (PDH).Downside: If broken – heading toward 80,000 USDT.📉 Short Entry (Sell Setup):Entry zone: Between 86,500 – 87,000 USDT (PDH/PWH).Take profit: Around 80,000 USDT.Stop loss: Above 87,200 USDT.📈 Long Entry (Buy Setup):Entry zone: Between 79,800 – 80,200 USDT (PDAL + trendline support).Take profit: Between 86,000 – 87,000 USDT.Stop loss: Below 78,500 USDT.🔻 Lowest Expected Price:If 80K is broken, next strong support is at 72,773 USDT.Further drop may reach 64,000 – 66,000 USDT demand zones.In a worst-case macro scenario: 49,140 USDT.🔁 Expected Reversal Zone:A potential bullish reversal could happen around 72,773–73,000 USDT if a bullish candlestick pattern (e.g., hammer with confirmation) appears.Alternatively, an earlier reversal is possible around 80,000 USDT, if supported and followed by a BOS to the upside.🧠 Additional Notes:The chart uses:Smart Money Concepts (SMC) – BOS, CHoCH, FVG.Premium & Discount zones – price is near equilibrium (EQ).Clear demand/supply blocks.Volume has been relatively low recently – watch for volume spikes to signal potential strong moves.
tradexict
DOT - Analysis

Analysis: Combined Tools1. Chart Patterns (Technical Patterns)From late 2022 to early 2024, we can see a falling wedge forming — a bullish reversal pattern. It eventually broke out upward around late 2023.Post-breakout, price attempted to rally but failed to sustain above key levels (~$9-$10), showing weakness.2. Candlestick PatternsJanuary 2024: Strong bullish engulfing pattern (after prolonged downtrend) = signal for reversal.March 2025 (current): A red candle with small body after several red candles indicates potential base-building or a pause in the bearish move.3. CRT (Compression, Reversal, Trend)Compression between late 2022 to early 2023 (small candles, low volume).Reversal hinted late 2023 with breakout and volume spike.Trend is currently sideways/bearish — no strong follow-through.4. Support and ResistanceSupport Zones: $3.60–$4.00 (historical bounce zones).Resistance Zones: $6.80–$7.20 and $9.50–$10.00.5. Order BlocksBullish OB: Around $3.60–$4.00 (April 2023 candle).Bearish OB: Near $9.50–$10.00 (Feb 2024 supply zone).6. Fair Value Gaps (FVG)FVG (imbalance) seen between $6.80–$7.40 from Jan-Feb 2024. Price could revisit to fill this.7. Price ActionPrice is making lower highs and lower lows, showing bearish structure.However, there’s accumulation-like behavior between $3.50–$4.50.✅ Trade Setup Based on Above ToolsEntry: $4.10–$4.30 (near support, bullish OB).Stop-Loss: Below $3.50 (strong invalidation level).Take-Profit 1: $6.80 (gap fill / first resistance).Take-Profit 2: $9.60 (major supply zone).
tradexict
XRP - My toughts

Support and Resistance LevelsResistance Levels:$2.745 – $2.760 zone → Strong resistance from previous swing highs (seen multiple rejections here).$2.87 – $2.90 → Smaller resistance, visible as a local high.$3.10 – $3.20 → Psychological round number and a potential target if a breakout occurs.Support Levels:$2.12 – $2.15 → Strong support zone (also 50–61.8% Fib retracement area).$1.95 → Key support level from the bottom of the range, previous major low.$2.29 – $2.31 → Minor support, marked by local consolidation.Entry Price for Long Trade (Breakout Strategy)Aggressive Entry: Around $2.50, on confirmation of higher low and early momentum shift. (Stop loss below $2.30)Conservative Entry: Wait for breakout above $2.75, retest and support confirmation → enter around $2.76 – $2.78.Target 1: $2.90Target 2: $3.10 – $3.20Stop loss: Below $2.60 or $2.50 depending on your risk appetite.
tradexict
Bitcoin (BTCUSDT) Monthly Chart Analysis

1. Overall Trend:The chart is on a 1-month timeframe, which means each candlestick represents one month of price action.BTC has shown a strong uptrend, with a series of bullish monthly candles since mid-2023.There is some recent consolidation, indicating potential profit-taking or a short-term correction before the next move.2. Key Annotations on the Chart:"BOTTOM LINE" (Red Line)This likely represents a support level, a key price level where buyers may step in if the price pulls back.If BTC remains above this level, the uptrend is intact."UP TO TREND" (Green Line)This suggests an expected continuation of the trend if BTC follows the current pattern.It may act as a resistance level or a target for the next price move."THANK EXPECTED" (Blue Text)This is unclear, but it might indicate a confirmation or expectation of a price move based on trend analysis.3. Technical Outlook:Bullish Scenario:If BTC holds above the support zone ("Bottom Line"), it could continue towards the next resistance level.A breakout above the current consolidation may trigger a new all-time high.Bearish Scenario:If BTC breaks below the support level, a deeper correction could occur.Potential retracement levels could be previous resistance zones or Fibonacci retracement levels.4. Potential Trade Setup:Entry: Look for a bullish confirmation candle above the support zone.Stop-loss: Below the bottom trendline to manage risk.Take-profit: Near the green "UP TO TREND" zone or next resistance level.
tradexict
ETH/USDT Analysis & Forecast - March 1, 2025

Current Market Overview- **Timeframe:** 4-hour chart- **Current Price:** **$2,161.24** (-1.07%)- **Recent Low:** ~$2,074.46- **Key Resistance Levels:** - **$3,015.76** (Fib 0.5) - **$3,064.11 - $3,200** (Critical zone for bullish breakout) - **$3,400 - $3,460** (Fib 0.705-0.79 retracement)- **Key Support Levels:** - **$2,181.93** (Current near-term support) - **$1,811.21** (Major historical support)Technical Indicators & Analysis1. **Fibonacci Retracement:** - The price has dropped significantly from the high of **$3,957**, currently testing the **Fib 0 level (~$2,074)**. - The first major resistance will be at **$3,015 - $3,200** (Fib 0.5-0.618). - A break above **$3,400** will indicate a strong bullish recovery.2. **Price Action:** - The sharp drop to around **$2,000** suggests a liquidity sweep or stop-loss hunting. - A potential **V-shaped recovery** is possible if ETH finds strong buying momentum at this level. - The **red arrow projection** on the chart suggests a short-term bounce back toward **$2,900 - $3,000**.3. **Support & Resistance:** - ETH is **testing a strong support** level at **$2,181**. - If this support fails, ETH may test **$1,811**. - A recovery would target **$2,700 - $3,015** as the first resistance.Forecast & Trading Strategy- **Bullish Scenario:** - If ETH holds **$2,074 - $2,181**, a **rebound** to at least **$2,700 - $3,015** is likely. - A breakout above **$3,200 - $3,400** could push ETH towards **$4,000**.- **Bearish Scenario:** - If ETH loses **$2,074**, the next major support is **$1,811**, a **key long-term buying zone**. - Below **$1,800**, bearish momentum could extend losses toward **$1,500**.- **Suggested Trade:** - **Long Entry:** **$2,100 - $2,200** with a target at **$3,000 - $3,200**. - **Stop-loss:** Below **$2,050** to prevent downside risk. - **Short Entry:** If ETH rejects **$3,000 - $3,200**, shorting down to **$2,500** is an option.Conclusion- ETH is at a **critical support zone**, with **potential for a strong bounce**.- If bulls reclaim **$3,000**, expect a continuation to **$3,400+**.- If ETH loses **$2,000**, watch for **$1,800 - $1,500** as next supports.- **Traders should watch volume and price reaction at $2,100 - $2,200** for a bullish reversal confirmation.
tradexict
Chart for APE/USDT on a 4-hour timeframe

Key Observations:Price Action: The price has been trending downward for a significant period, but it seems to have found support near the $1.00 level and is attempting a recovery.Indicators:MACD (Moving Average Convergence Divergence): The MACD histogram is showing bullish momentum, with the MACD line crossing above the signal line.RSI (Relative Strength Index) or Histogram Indicator: The histogram shows bullish divergence from the oversold levels, suggesting a potential reversal or continuation of the recovery.Trading Setup:1. Entry Point (Long):Enter around the current price ($1.17 - $1.20 range), as the price is showing strength with a breakout from a consolidation phase.2. Stop Loss:Place a stop loss slightly below the recent support at $1.10 to minimize risk if the bullish momentum fails.3. Target Levels:First Target (TP1): $1.30 - This is a short-term resistance level.Second Target (TP2): $1.45 - A mid-term resistance level from previous price action.Third Target (TP3): $1.60 - A longer-term resistance area.4. Risk-to-Reward Ratio:Ensure a risk-to-reward ratio of at least 1:2 or 1:3 for this trade.Alternative Scenario (Short Setup):If the price fails to hold the $1.10 support level and breaks below, consider a short position with the following setup:Entry Point (Short): Below $1.10.Stop Loss: Above $1.17.Targets: $1.00 and $0.85.Additional Notes:Monitor the volume closely. A breakout with high volume will add confidence to the trade.Watch for external news or announcements about APE that could affect the price.Keep an eye on Bitcoin and general market trends, as they can influence altcoins like APE.
Disclaimer
Any content and materials included in Sahmeto's website and official communication channels are a compilation of personal opinions and analyses and are not binding. They do not constitute any recommendation for buying, selling, entering or exiting the stock market and cryptocurrency market. Also, all news and analyses included in the website and channels are merely republished information from official and unofficial domestic and foreign sources, and it is obvious that users of the said content are responsible for following up and ensuring the authenticity and accuracy of the materials. Therefore, while disclaiming responsibility, it is declared that the responsibility for any decision-making, action, and potential profit and loss in the capital market and cryptocurrency market lies with the trader.