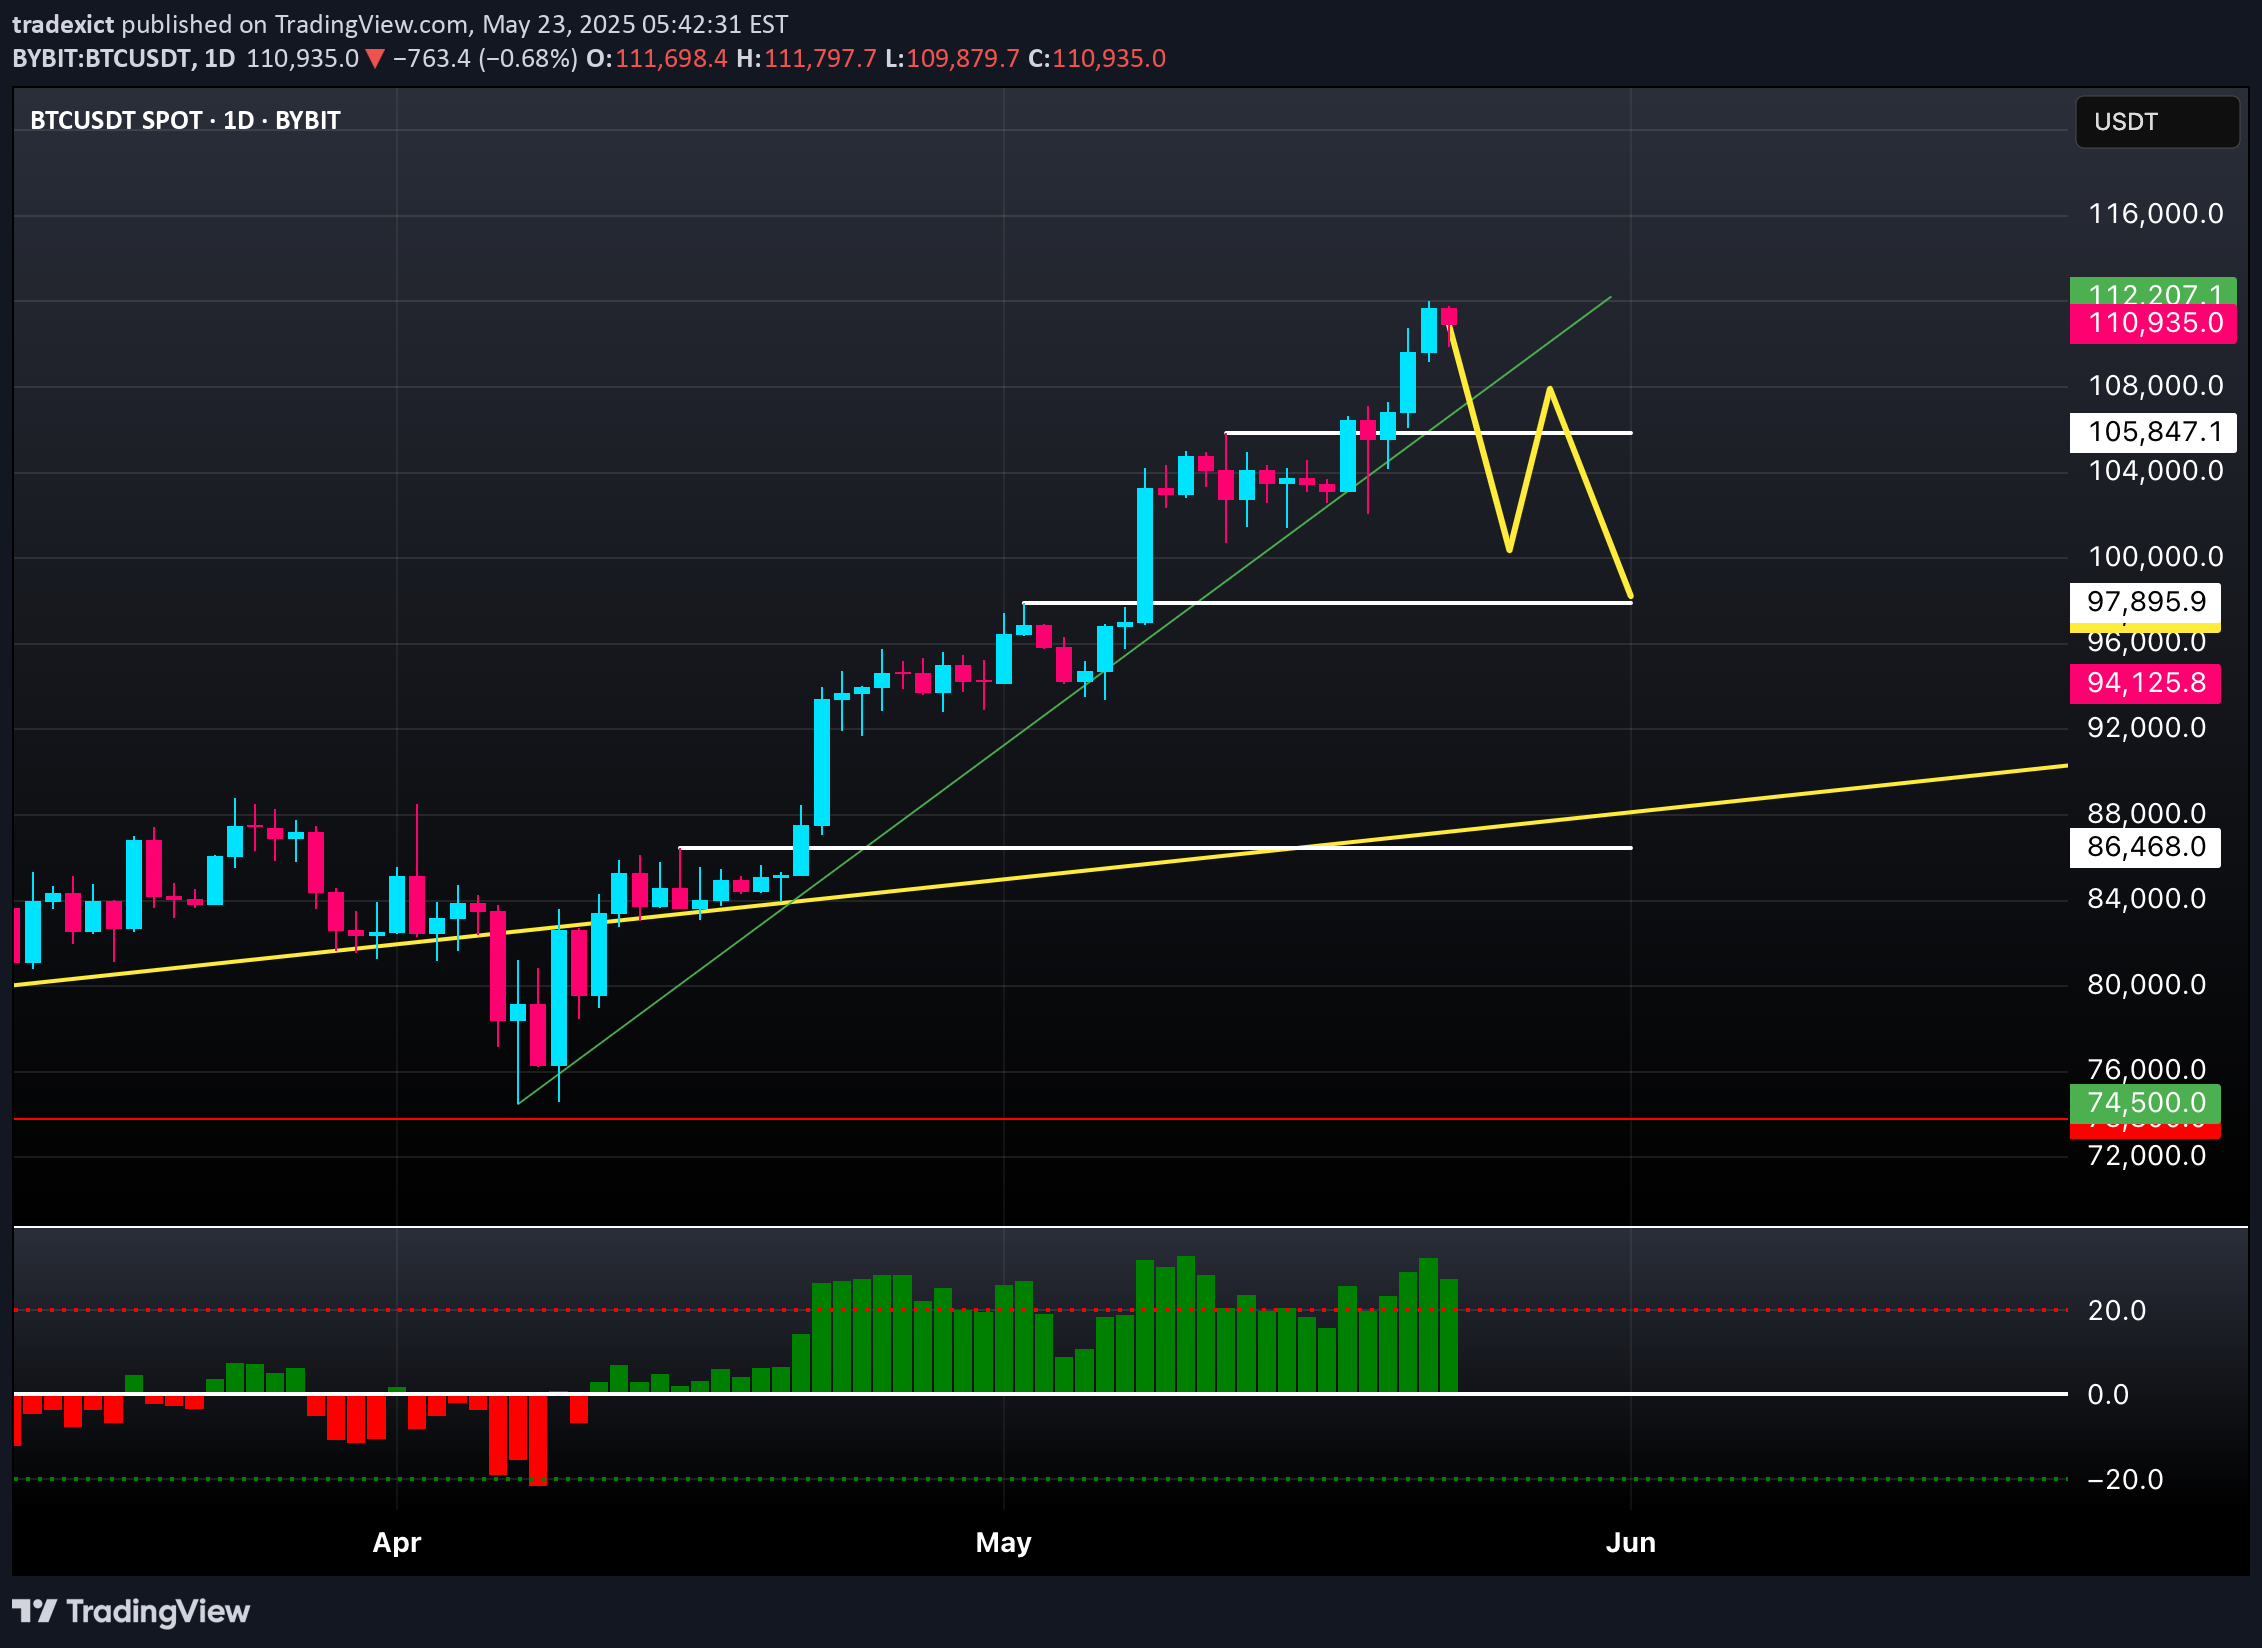
Technical analysis by tradexict about Symbol BTC: Sell recommendation (5/23/2025)

tradexict
Daily BTC Technical Analysis – Bearish Evidence (Short Setup)

1. Rising Wedge PatternThe daily chart shows a Rising Wedge formation – a technical pattern that often signals a potential trend reversal downward.Moreover, the price increase is accompanied by decreasing volume, reinforcing the likelihood of an upcoming correction.(Source: Investopedia)2. Indicators in Overbought TerritoryRSI (Relative Strength Index): above 70 – signals overbought conditions.CCI (Commodity Channel Index): above 100 – also signals overbought.Williams %R: above -20 – again, confirms excessive buying pressure.These conditions typically indicate market exhaustion and a high chance of short-term pullback.(Source: CentralCharts)3. Bearish Harami Candlestick PatternA Bearish Harami has formed on the chart – a potential reversal pattern, especially after an uptrend.It often marks a shift in market sentiment and weakening momentum.4. Bearish DivergenceThere is a clear bearish divergence between price and RSI – while price makes new highs, RSI is trending lower.This classic signal suggests weakening buying power and a possible trend reversal.(Source: CentralCharts)🧭 Key Support Levels to Watch$107,000: first minor support area.$100,000: a strong psychological support level.$92,000: deeper support, aligned with historical trading zones and moving averages.📊 SummaryWhile Bitcoin’s long-term trend remains bullish, the short-term indicators suggest a potential correction.Traders looking for short opportunities should monitor the technical signals above and use key support zones as potential profit targets.