tradersboat
@t_tradersboat

What symbols does the trader recommend buying?
Purchase History
پیام های تریدر
Filter
Signal Type
tradersboat

📖 Description: Most traders enter positions without measuring probability. This framework solves that. The Trading Probability Index (TPI) combines: ✔️ Confluences (indicators & structure) ✔️ Liquidity zones ✔️ Market structure shifts ✔️ Historical edge It categorizes setups from Very Low → High Probability so traders know when to stay flat, go small, or go big with conviction. 📊 In this example, the trade scored 64 → High Probability Zone, meaning the setup has strong confluence and is worth taking—with proper risk management. This tool helps traders filter noise, focus on quality setups, and avoid overtrading. 👉 Do you have your own system to measure trade quality? Or do you go by gut feeling?
tradersboat
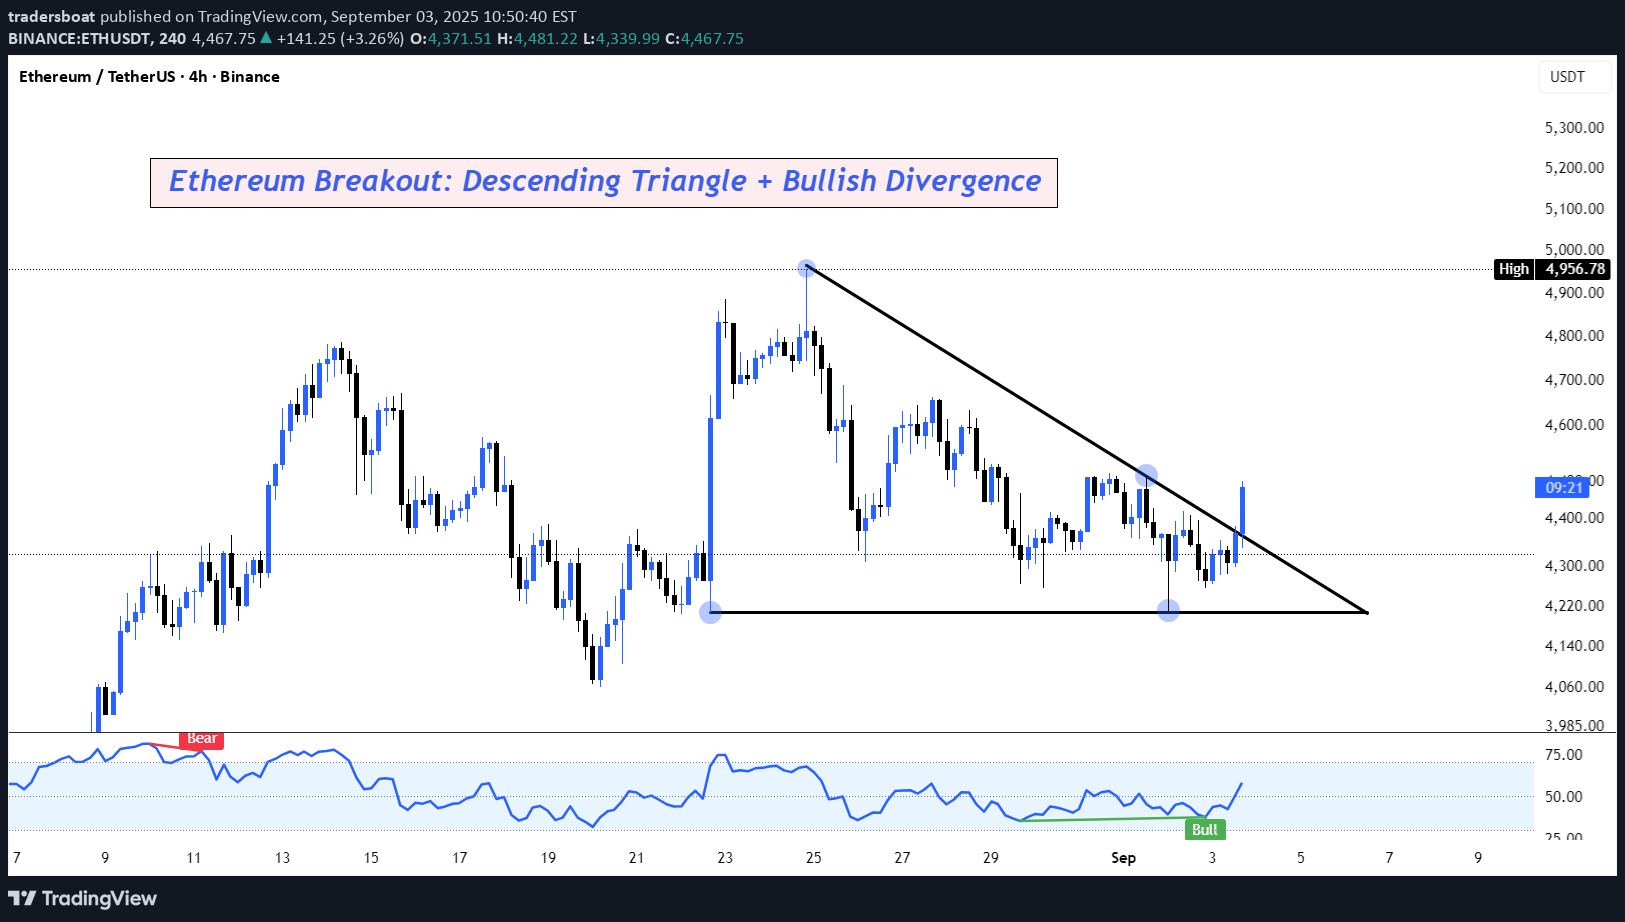
ETH has been consolidating inside a descending triangle, with lower highs pressing into horizontal support around $4,200–$4,250. On this 4H timeframe, price has just broken above the trendline resistance with momentum confirmation from the RSI, showing a bullish divergence. 🔹 Bullish Case: If ETH holds above the breakout zone, we could see continuation towards $4,480 → $4,600 liquidity pocket. A sustained move above $4,600 opens the door toward $4,950–$5,000. 🔹 Bearish Invalidation: If ETH fails to hold above $4,250, a retest of the $4,060 low remains on the table. This breakout, paired with RSI strength, makes ETH one to watch closely this week. 👉 Do you think bulls can finally reclaim $4,600 and flip structure back to bullish?
tradersboat
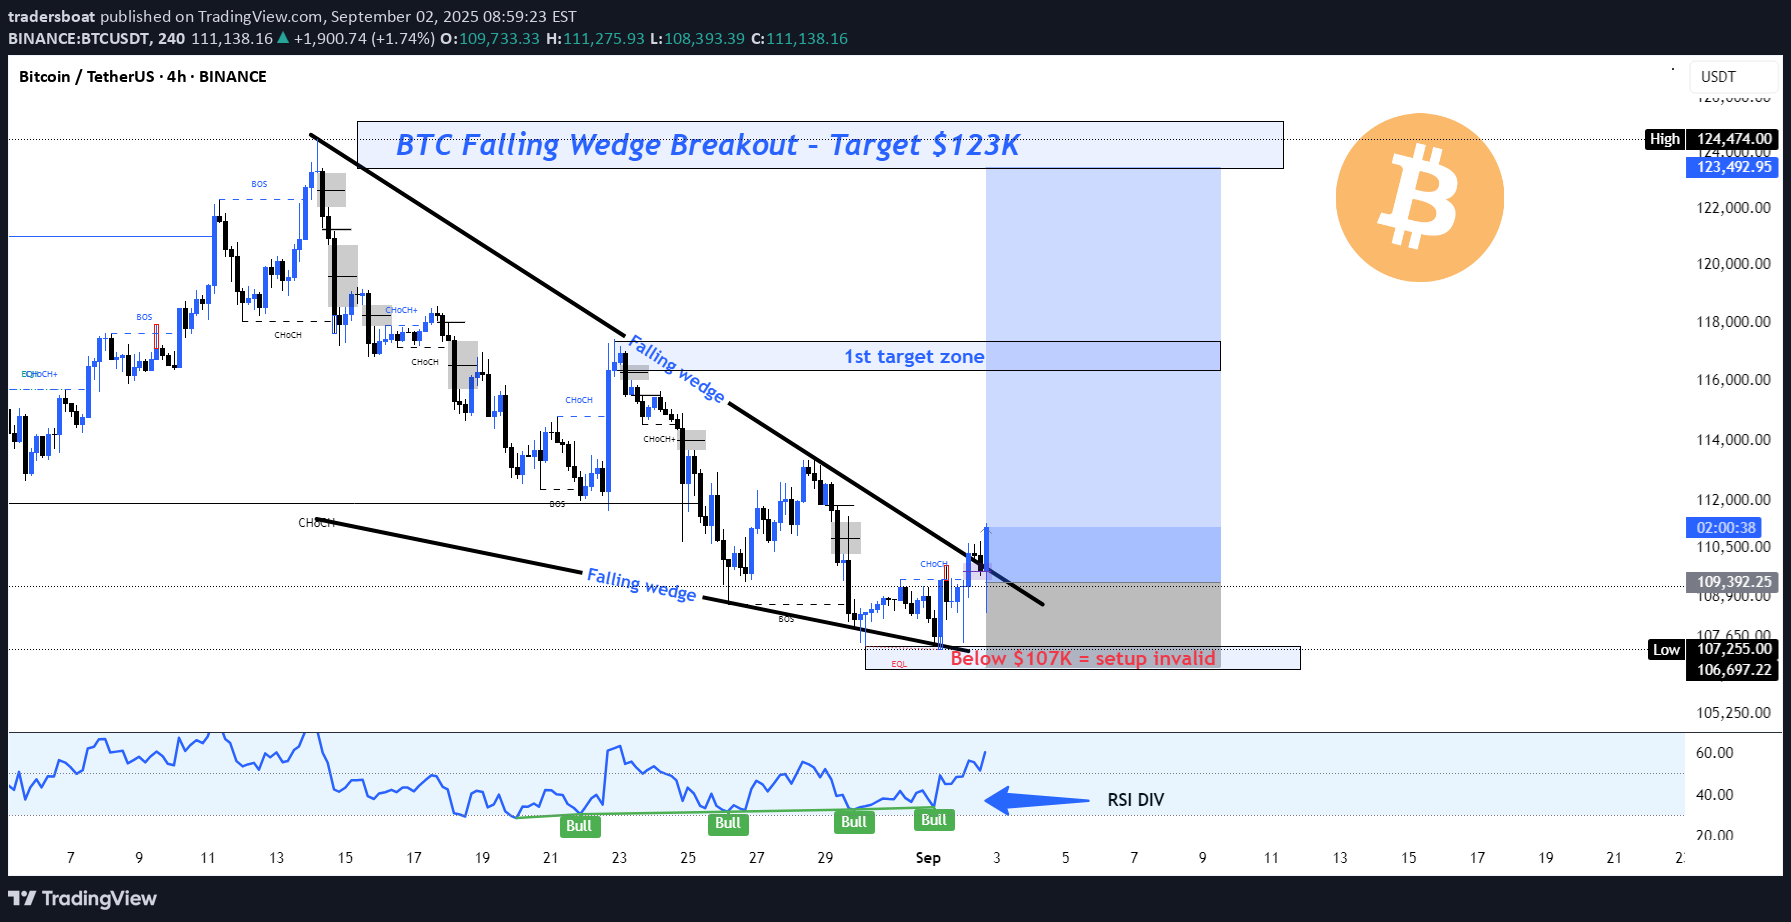
📖 Bitcoin has been consolidating inside a falling wedge on the 4H timeframe. A breakout has just occurred, with the first target zone near $117,000. Multiple CHoCH + BOS signals hint at a possible bullish trend reversal. If momentum holds, upside continuation toward $123K is on the table. 🔹 Invalidation: Below $107K (wedge low). 🔹 Confluence: Liquidity sweep + market structure shift.
tradersboat
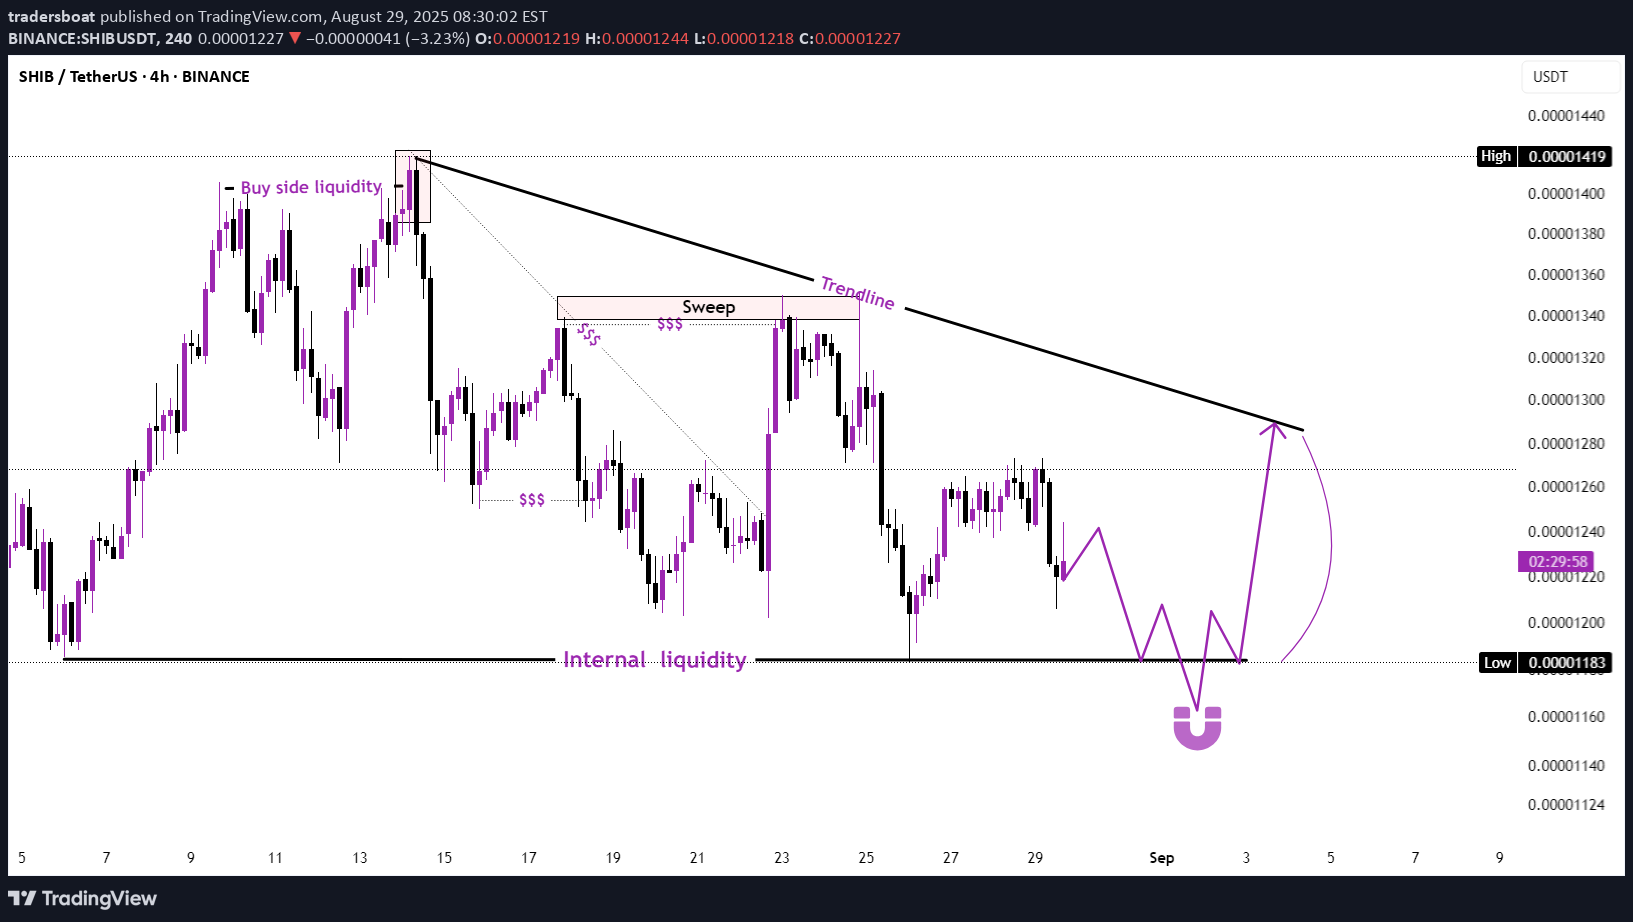
SHIB/USDT is consolidating under a descending trendline while sweeping liquidity levels. Internal liquidity around 0.00001180 is acting as a key magnet for price. A sweep of this zone could trigger a reversal toward the trendline. Break and close above may open the path to higher liquidity grabs.
tradersboat
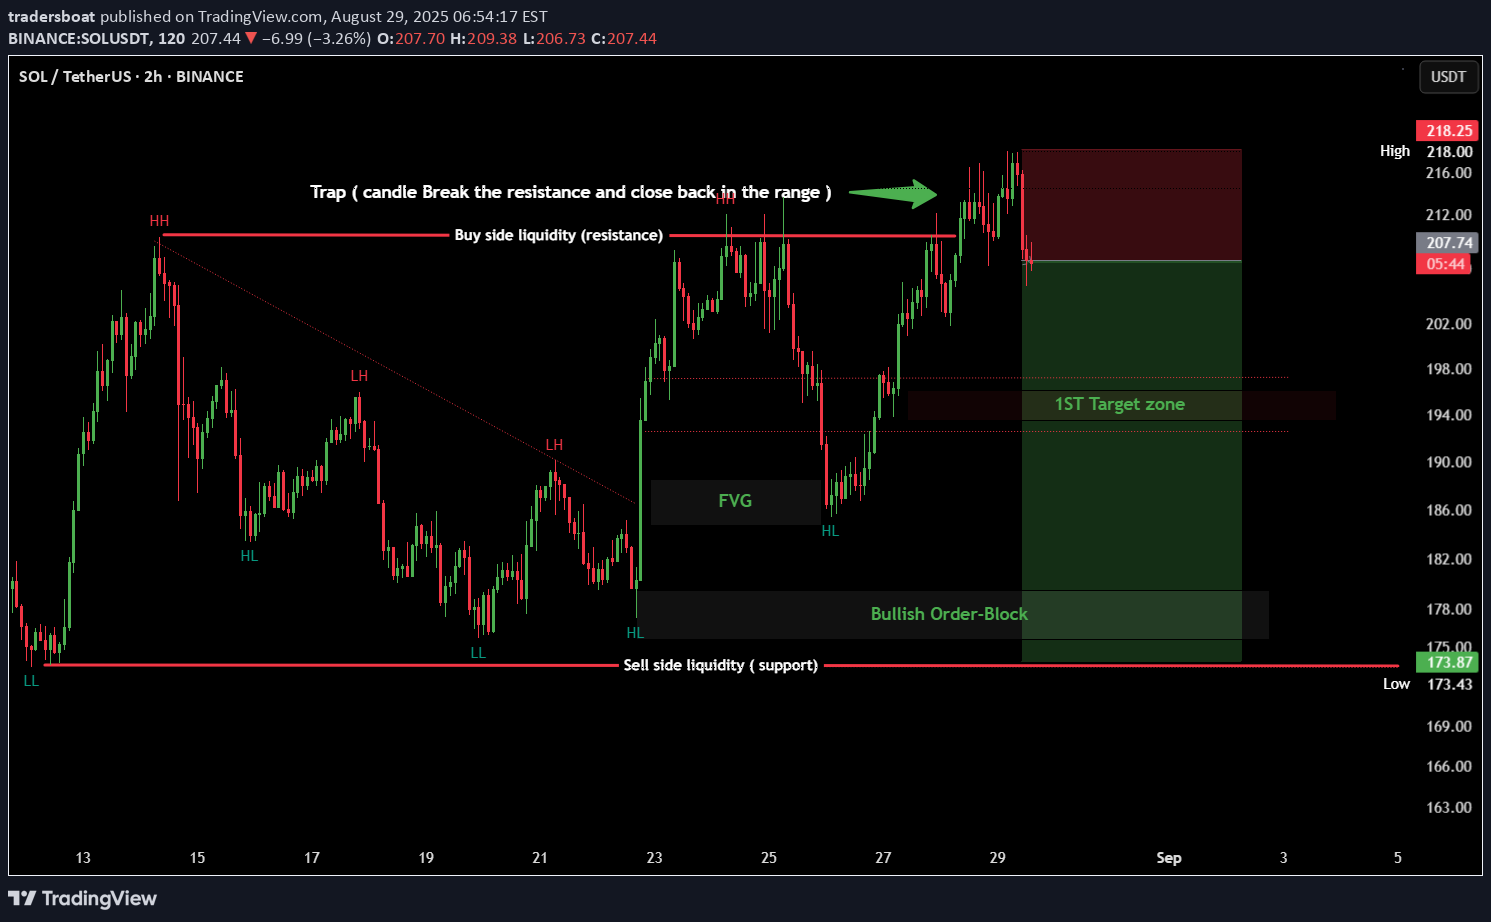
Price broke above resistance but quickly closed back in the range, signaling a potential bull trap. Liquidity was grabbed at the highs, and now sellers may target the first demand zone near $194. If momentum extends lower, the bullish order block at $175 becomes the key support. False breakout above resistance, liquidity grabbed – eyes on $194 first, then $175 bullish OBTrade is not active yet
tradersboat
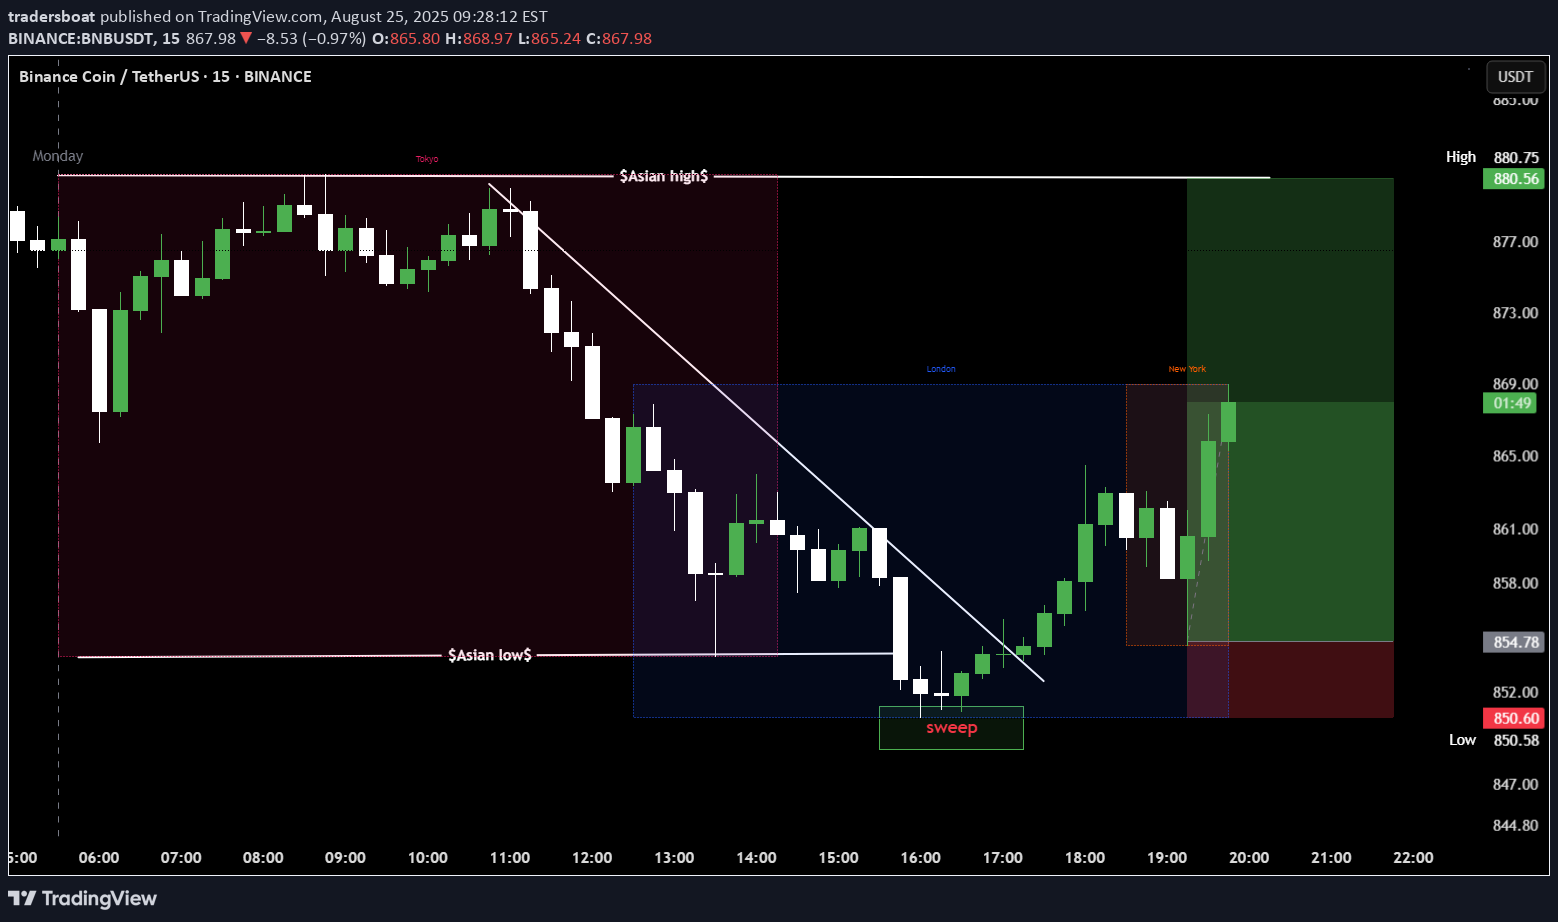
Price swept the Asian session low, grabbing liquidity before reversing. Entry taken on bullish confirmation, targeting liquidity above Asian highs.
tradersboat
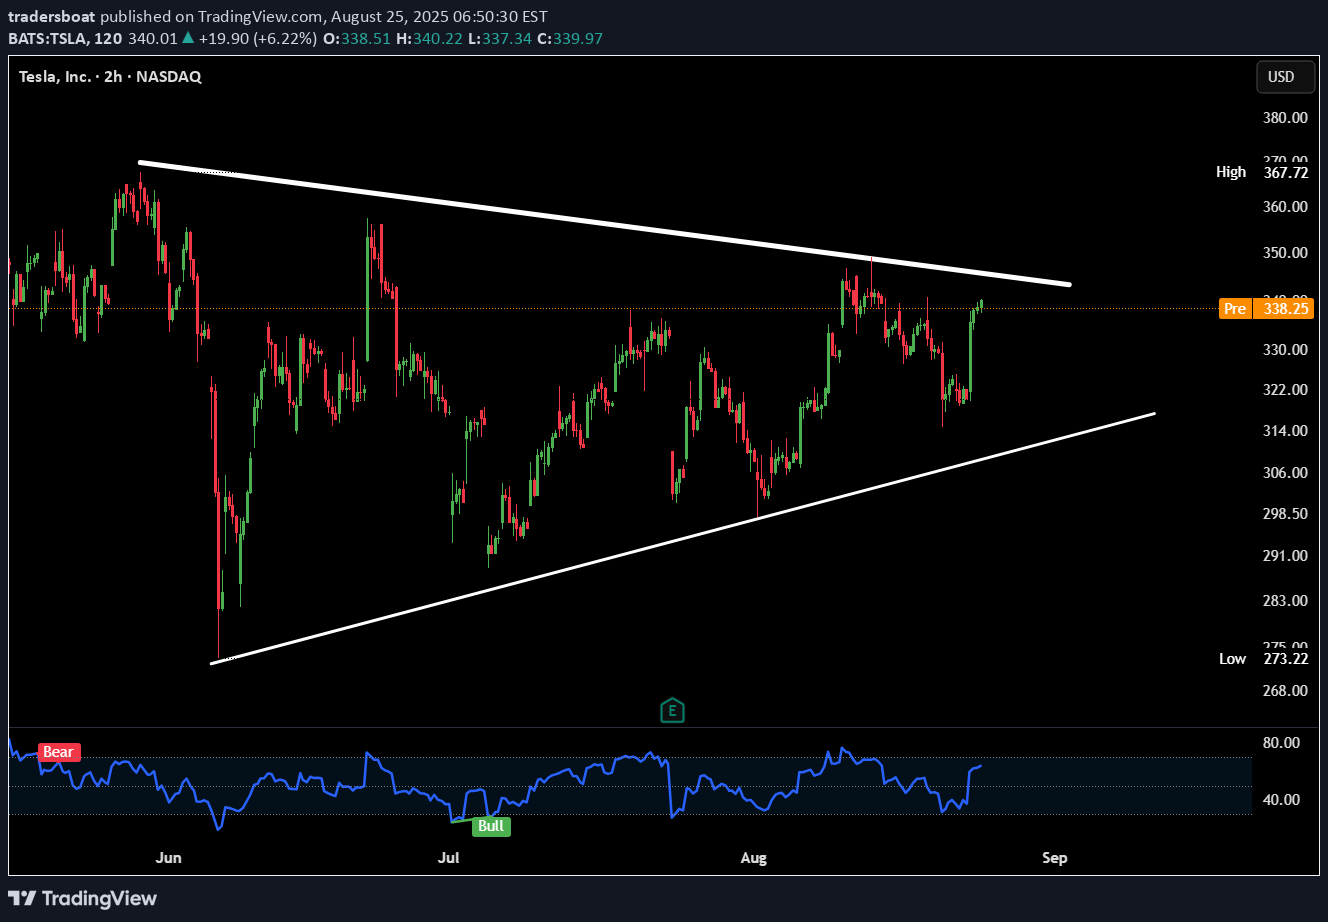
Breakdown (what the chart shows): Tesla is forming a symmetrical triangle on the 2H chart. Price is squeezing between higher lows and lower highs. Currently testing resistance near $338–340. Breakout or rejection incoming. Confluence: 1. RSI bouncing back from near oversold → bullish momentum returning. CTA : Which way do you think it breaks — up or down? Would you trade the breakout or fade the first move?
tradersboat
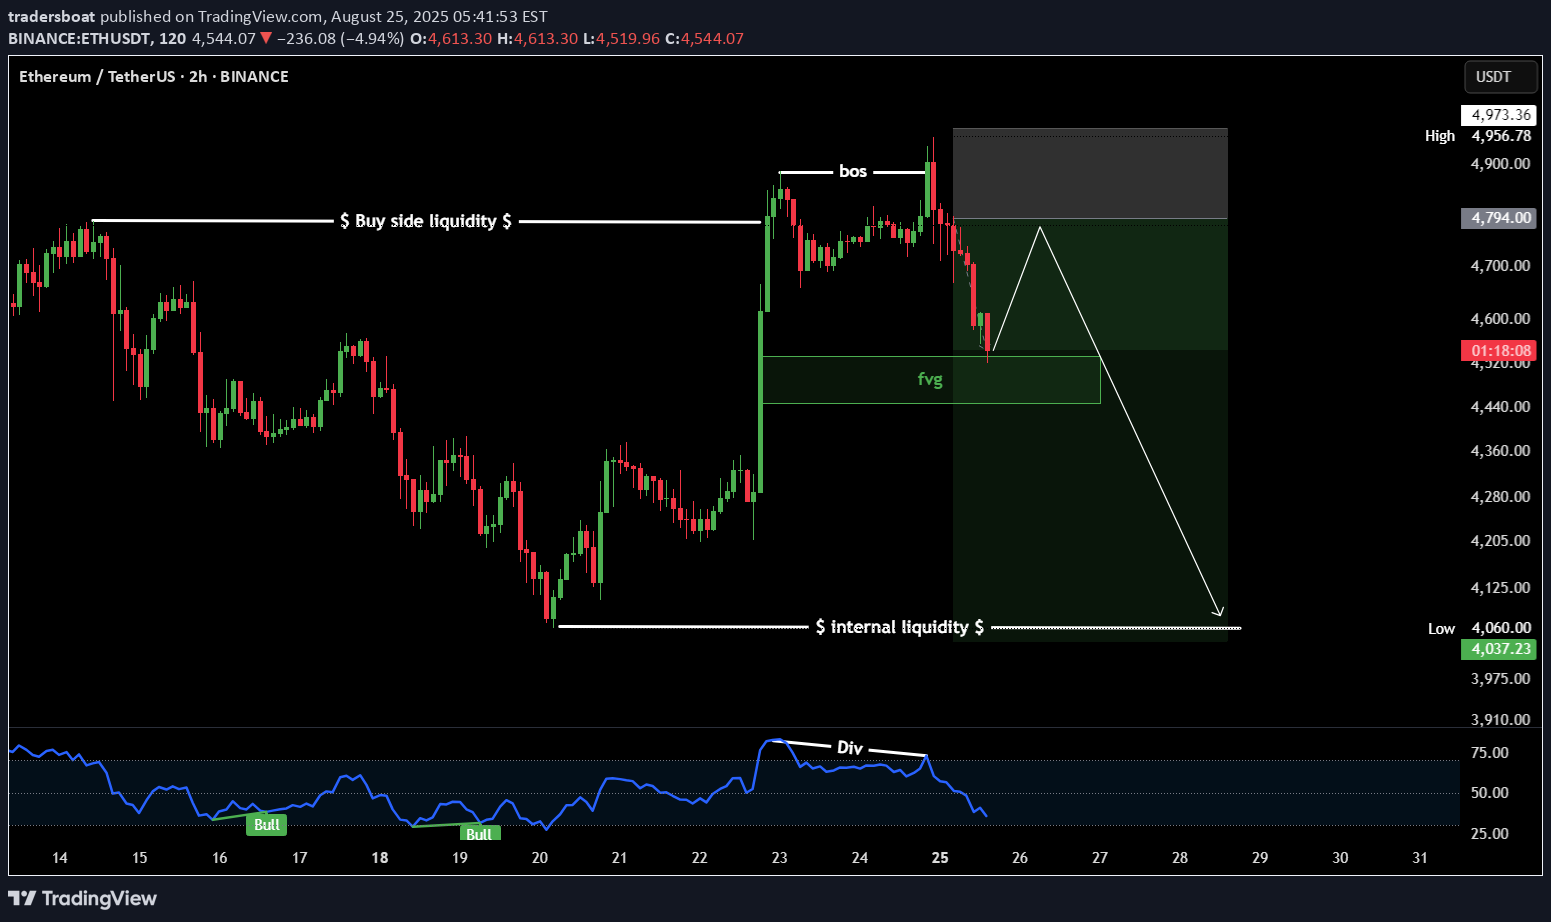
Price swept buy-side liquidity above the recent highs and created a BOS. Fair Value Gap (FVG) formed, aligning with internal liquidity below. Expecting a retracement into internal liquidity zone. CONFLUENCES - 1. Bos + liquidity sweep ( price break the resistance and close back in the range.) 2. Engulfing candle + RSI DIV ( Price making HH and the RSI making LL.)
tradersboat
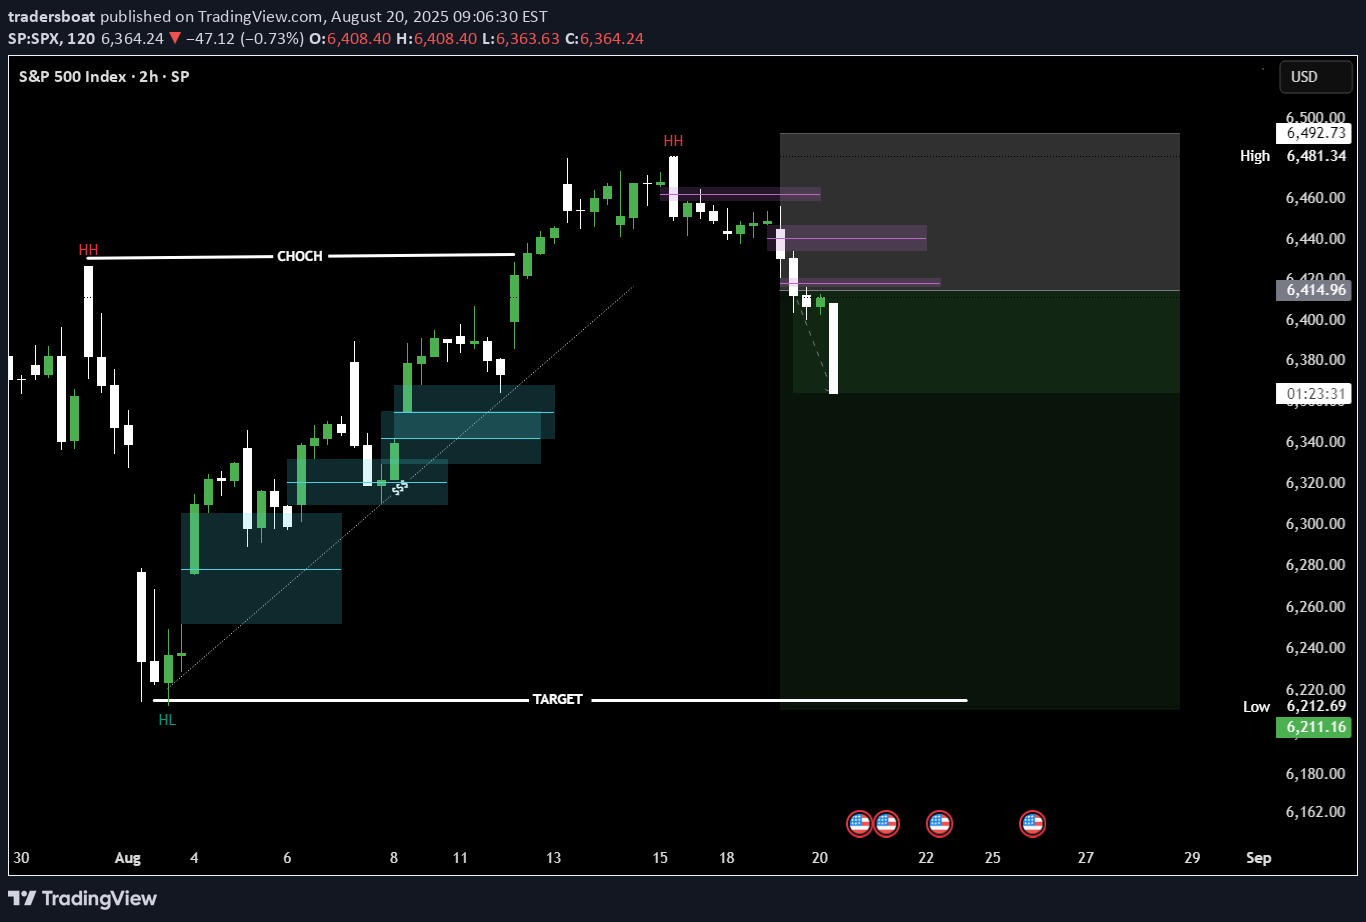
Price formed a Change of Character (CHOCH) after printing equal highs, signaling weakness. Supply zones got respected, confirming bearish order flow. Now targeting liquidity at the prior Higher Low (HL) around 6210.
tradersboat
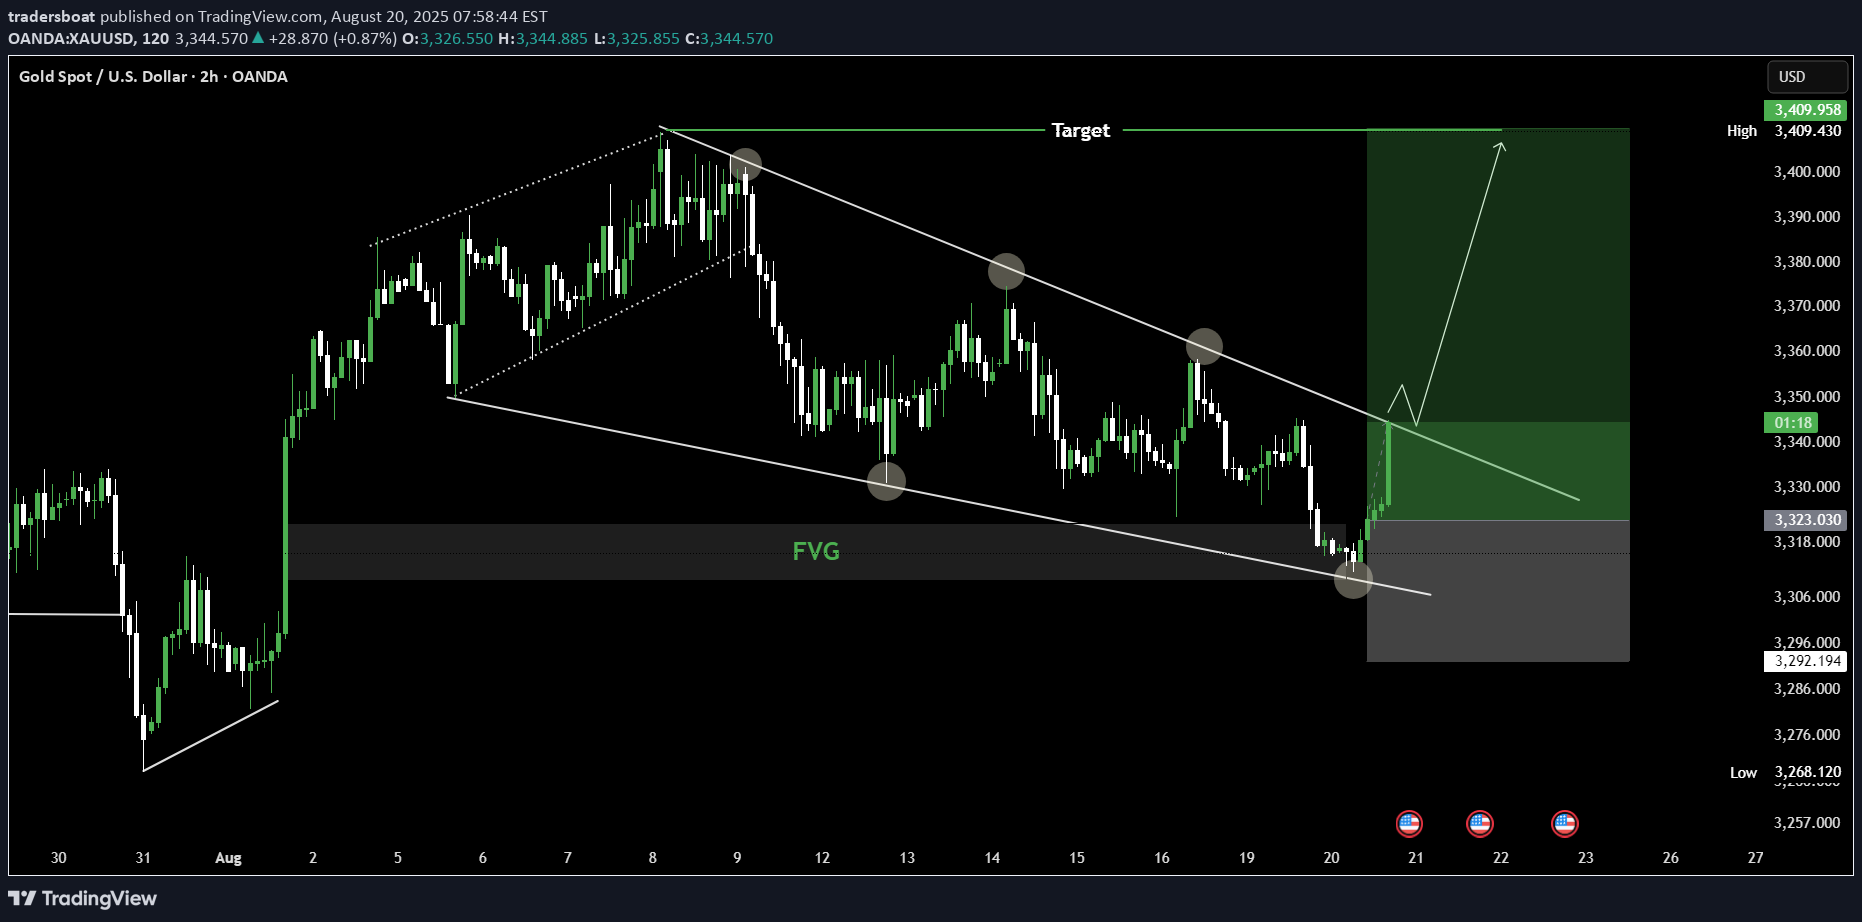
Price tapped into the Fair Value Gap (FVG) and rejected strongly from the descending channel support. A bullish breakout above the trendline confirms momentum shift. Targeting liquidity towards the previous swing high around 3409.1.25% UP
Disclaimer
Any content and materials included in Sahmeto's website and official communication channels are a compilation of personal opinions and analyses and are not binding. They do not constitute any recommendation for buying, selling, entering or exiting the stock market and cryptocurrency market. Also, all news and analyses included in the website and channels are merely republished information from official and unofficial domestic and foreign sources, and it is obvious that users of the said content are responsible for following up and ensuring the authenticity and accuracy of the materials. Therefore, while disclaiming responsibility, it is declared that the responsibility for any decision-making, action, and potential profit and loss in the capital market and cryptocurrency market lies with the trader.