Technical analysis by tradersboat about Symbol TSLAX on 8/25/2025
https://sahmeto.com/message/3733557

tradersboat
Rank: 2322
Analytical Power:
2.2
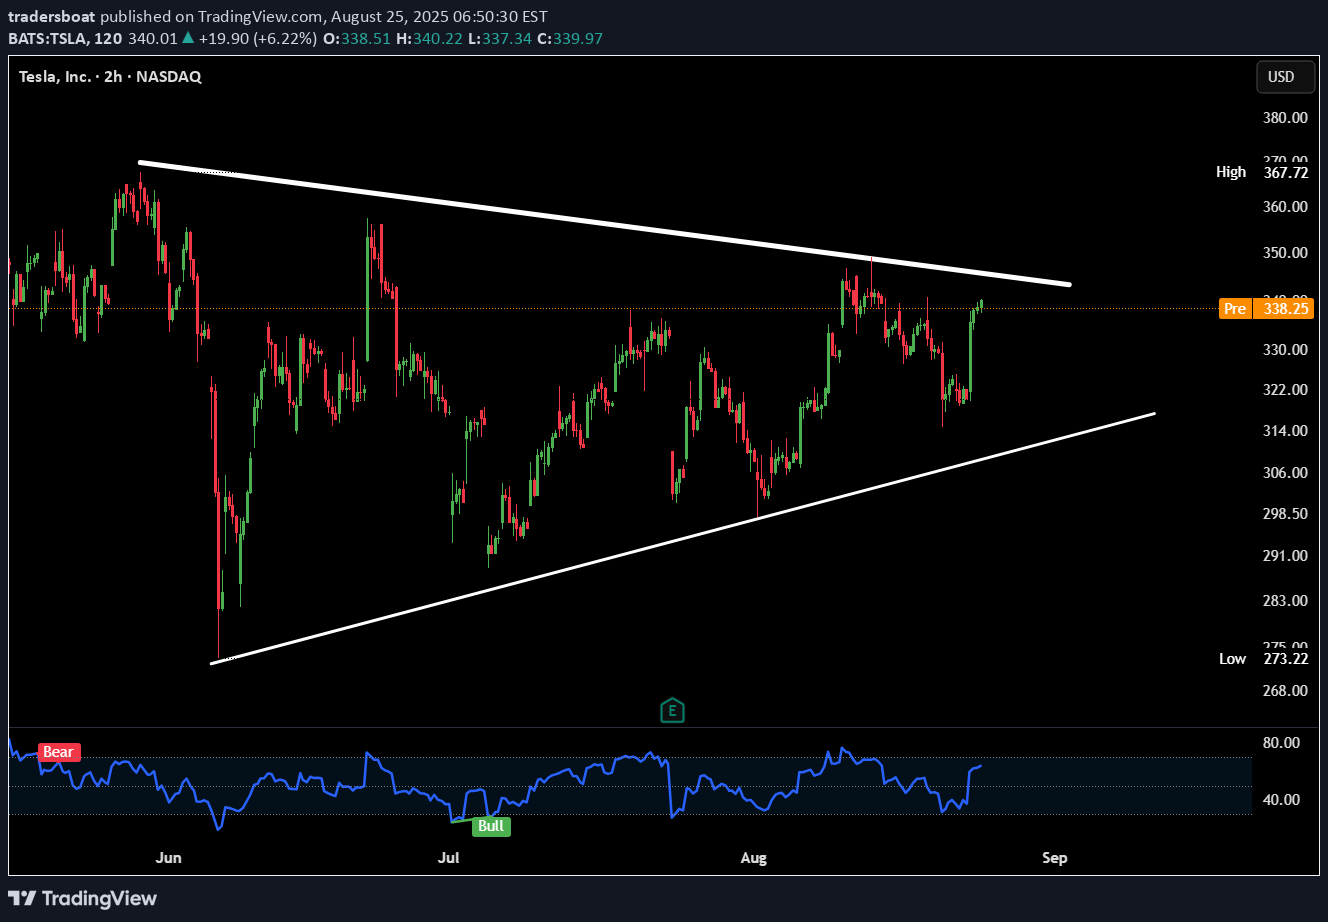
Breakdown (what the chart shows): Tesla is forming a symmetrical triangle on the 2H chart. Price is squeezing between higher lows and lower highs. Currently testing resistance near $338–340. Breakout or rejection incoming. Confluence: 1. RSI bouncing back from near oversold → bullish momentum returning. CTA : Which way do you think it breaks — up or down? Would you trade the breakout or fade the first move?
Translated from: English
Show Original Message
Signal Type: Neutral

Time Frame:
2 ساعتPrice at Publish Time:
$338.84