
tradeflowadvisors
@t_tradeflowadvisors

What symbols does the trader recommend buying?
Purchase History
پیام های تریدر
Filter
tradeflowadvisors
طلا در آستانه پرواز: هدفگذاری ۴۴۱۳ با الگوی فنجان و دسته!
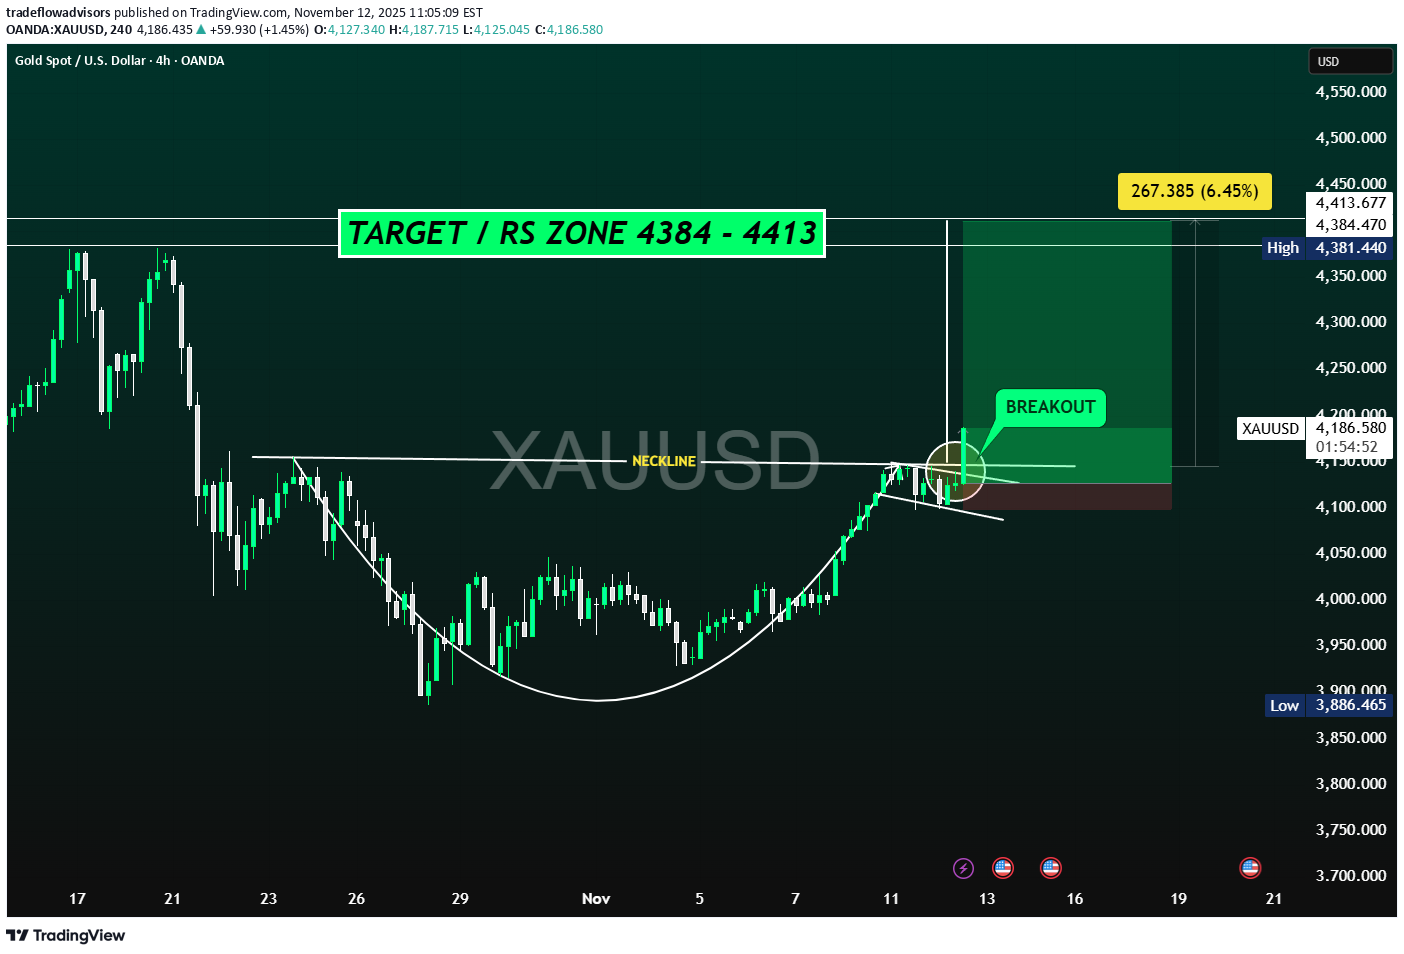
Gold (XAU/USD) has confirmed a bullish Cup and Handle breakout on the 4-hour timeframe, signaling a potential continuation of its upward trend. The neckline around 4,120–4,140 has been broken decisively with strong momentum and rising volume, confirming buyer dominance. After this breakout, the price is trading near 4,180, and the projected measured move suggests a potential upside of around 267 points (≈6.45%), targeting the 4,384–4,413 resistance zone. This zone aligns with previous structural resistance, making it an ideal short- to medium-term target. If momentum sustains, an extended move toward 4,450+ remains possible. On the downside, 4,120 now acts as immediate support and could be retested before another push higher, while 4,000 remains the major support below which the bullish pattern would be invalidated. Overall, the outlook remains strongly bullish, with a clear breakout confirmation and favorable risk-to-reward structure for long positions.
tradeflowadvisors
طلا متوقف شد! آیا مسیر صعود به ۴۶۳۰ دلار باز میشود؟ (تحلیل تکنیکال و فاندامنتال)
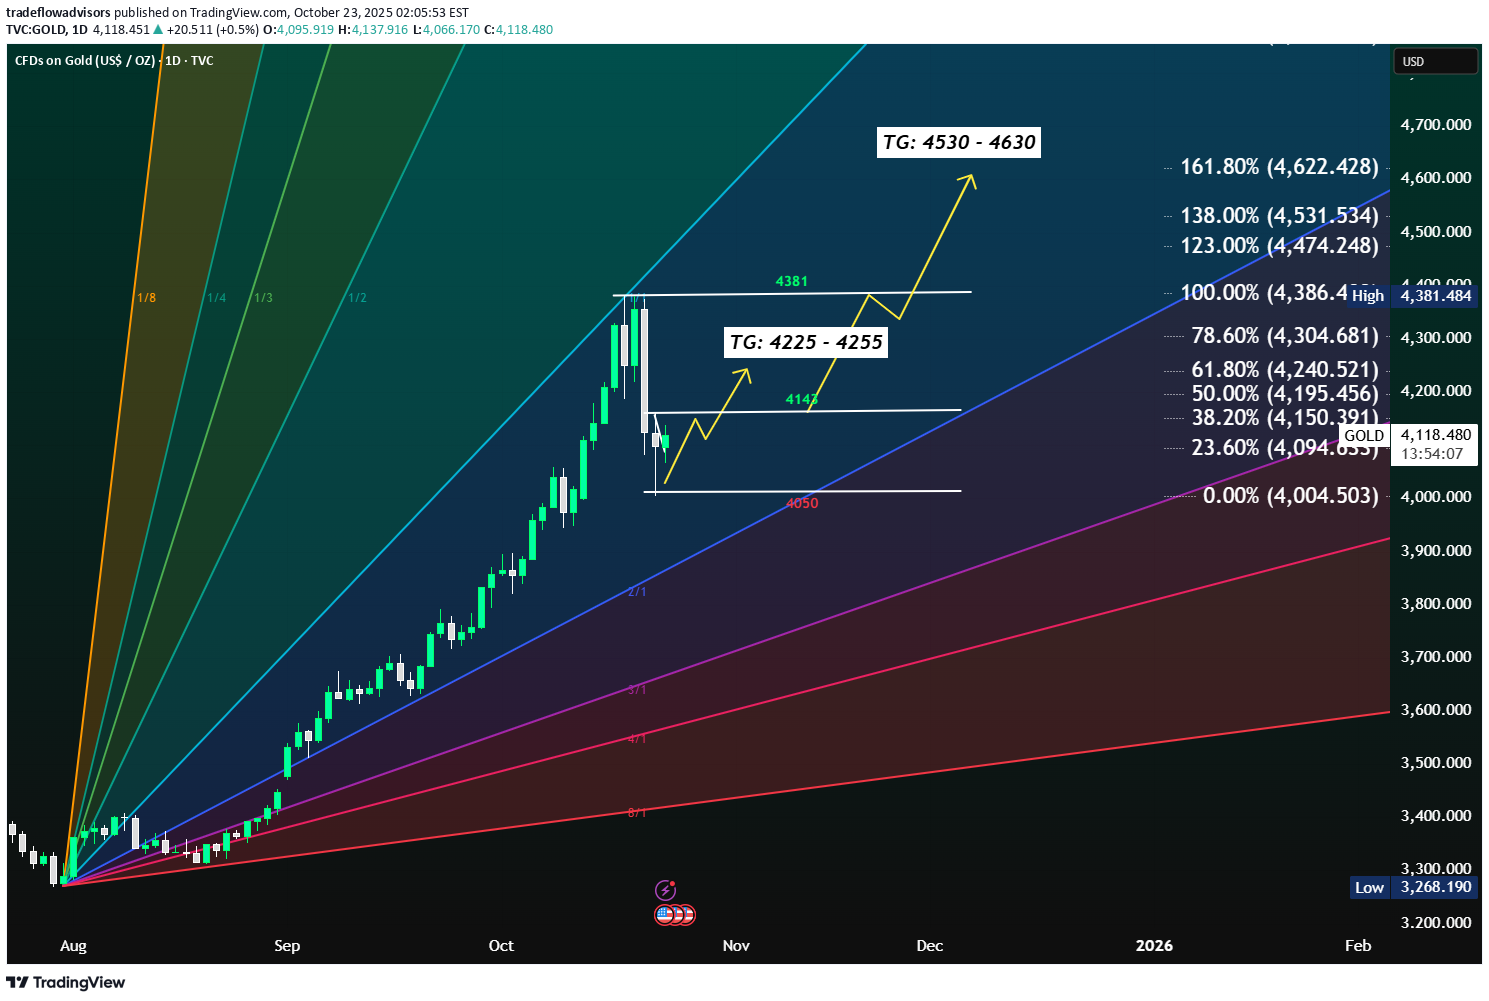
GOLD Macro Outlook Gold prices rose to around $4,120 per ounce on Thursday, halting a two-day decline as investors weighed trade developments and geopolitical tensions that lifted the metal’s safe-haven appeal. Reports indicated that the US is considering export restrictions on China involving American-made software, though President Donald Trump later confirmed plans to meet with Chinese President Xi Jinping. Gold is setting up for a potential bullish continuation as falling bond yields and anticipated Federal Reserve rate cuts continue to weaken the U.S. dollar and boost demand for safe-haven assets. The 10-year Treasury yield remains below 4%, and yields across the curve have softened. This reinforces expectations that the Fed will announce rate cuts during its upcoming FOMC meetings on October 29 and December 10. Looking into 2026, the trend of global monetary easing is likely to persist. Economies in Asia and Northern Europe are showing signs of structural weakness due to aging demographics and declining household formation, leading to prolonged low growth and further pressure on global interest rates. Gold Technical Structure On the technical front, Gold is currently trading near $4,137, after correcting from the recent high of $4,398. The chart shows price consolidating along the lower Gann support, with a potential reversal setup forming. Immediate Support: $4,023–$4,100 Immediate Resistance: $4,175 and $4,225–$4,255 (key breakout zone) Breakout Targets: $4,318 → $4,398 → $4,485 → $4,631 Stop-Loss: Below $4,025 (closing basis) A daily close above $4,255 would confirm bullish continuation, opening the path toward $4,400–$4,630 levels in the medium term. A breakdown below $4,050 would invalidate the setup and shift bias back to neutral. Summary Bias: Bullish (above $4,225) Entry Zone: $4,060–$4,150 Confirmation: Close above $4,255 Stop-Loss: $4,025 (closing basis) Targets: $4,318 → $4,398 → $4,485 → $4,631 Macro Catalyst: Fed easing cycle, weaker USD, global rate decline Gold remains well-positioned for a renewed upside phase driven by macro tailwinds and technical recovery from support zones. Sustained trade above $4,225–$4,255 could confirm a breakout, aligning both macro fundamentals and technical signals in favor of the bulls.
tradeflowadvisors
فرصت خرید طلا: ورود از "منطقه طلایی" با اهداف ۴۵۶۶!
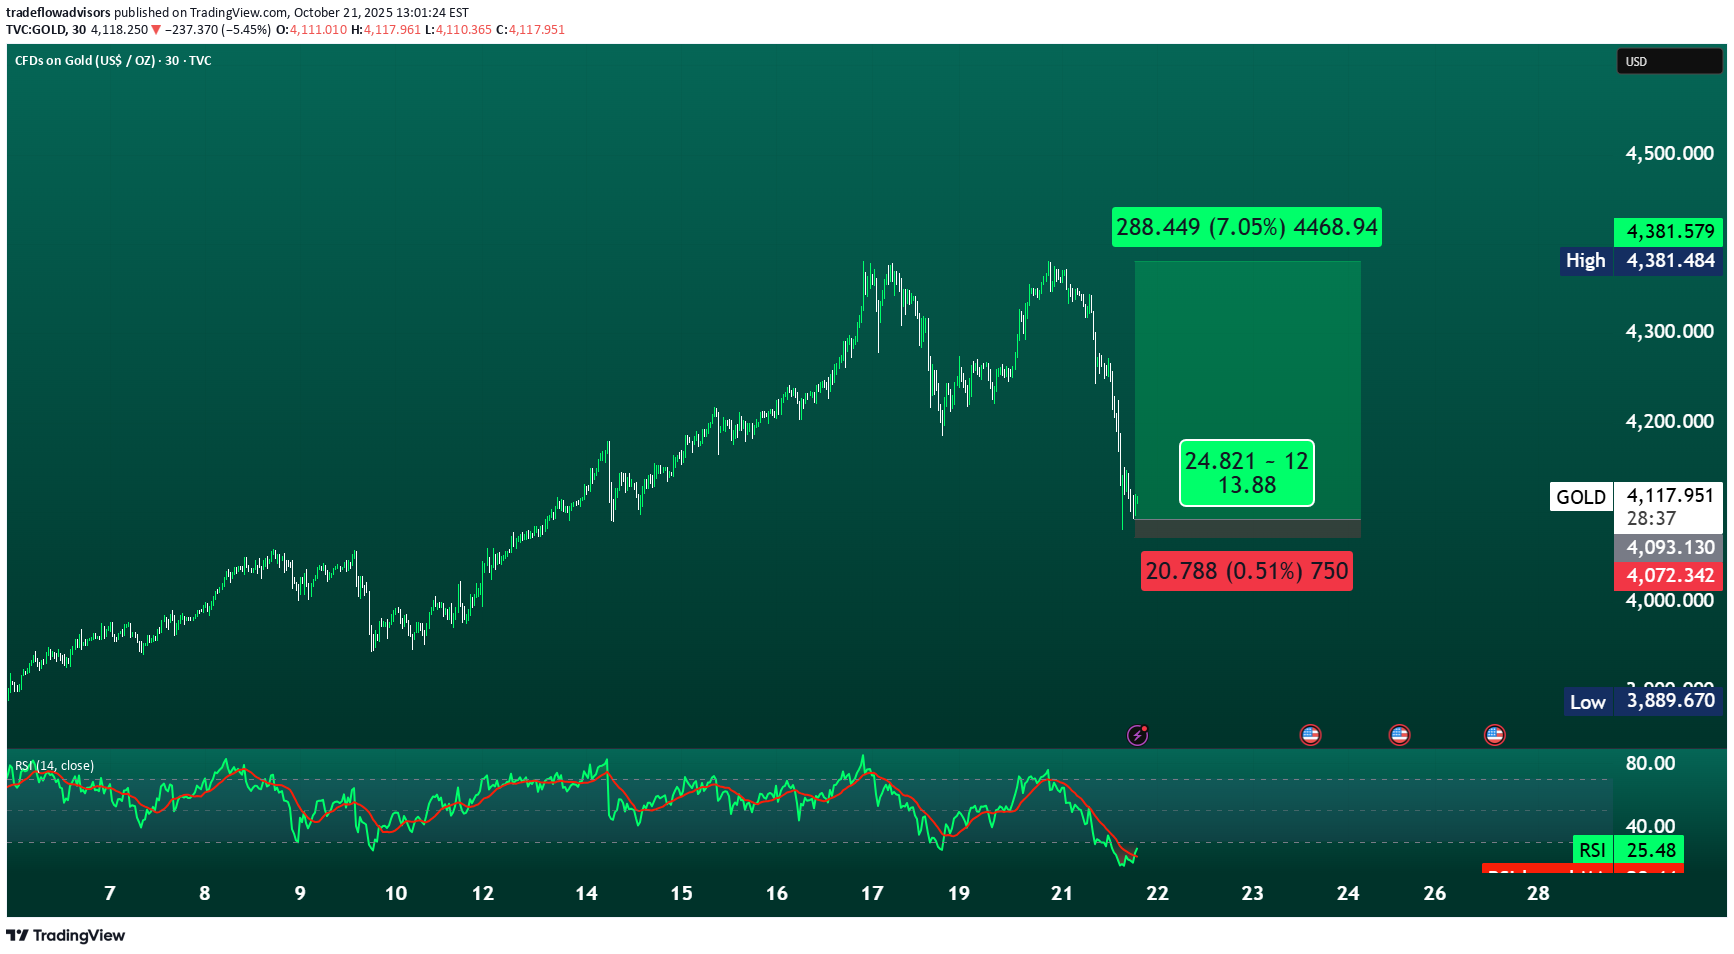
Gold Buy Opportunity Setup: Rebound from Key Support Zone ("Golden Zone") Current Price Level: ~ 4,381.48 Entry Zone: 4,380 – 4,390 (on confirmation of bounce) Stop-Loss: 4,340 (below recent swing low) Take-Profit Targets: Target 1: 4,450 Target 2: 4,500 (major resistance) Target 3: 4,550 - 4566 (extension level) Risk Management Risk per Trade: Do not risk more than 1-2% of your trading capital. Reward-to-Risk Ratio: ~ 2:1 or better Position Size: Adjust based on stop-loss distance and account size. Trading gold and other financial instruments involves significant risk, including the potential loss of all invested capital. The analysis provided is based on technical indicators and market conditions at the time of writing and is subject to change without notice. This is not financial advice. Always conduct your own research and consider consulting a licensed financial advisor before making any trading decisions. Past performance is not indicative of future results.Gold Buy Opportunity — Rebound from the Golden Zone Current Price: ~4138 Trade Setup Entry Zone: 4106 – 4138 Stop-Loss: 4100 Take-Profit Targets: •Target 1: 4184 – 4220 •Target 2: 4274 – 4307 •Target 3: 4340 – 4380 •Target 4: 4470 – 4530 Risk Management •Risk per Trade: Max 1–2% of total capital •Reward-to-Risk Ratio: ~2:1 or better •Position Size: Adjust according to stop-loss distance and account size ⚠️ Disclaimer: Trading gold and other financial instruments carries significant risk, including potential loss of capital. This analysis is based on technical factors at the time of writing and may change with market conditions. This is not financial advice — always conduct your own due diligence or consult a licensed financial advisor before taking action.The first description had a typo error and it’s too late to edit. So here are the updated levels.
tradeflowadvisors
INJ/USDT: Approaching BO TP1: 24 → TP2: 35 → TP3: 43 → TP4: 53
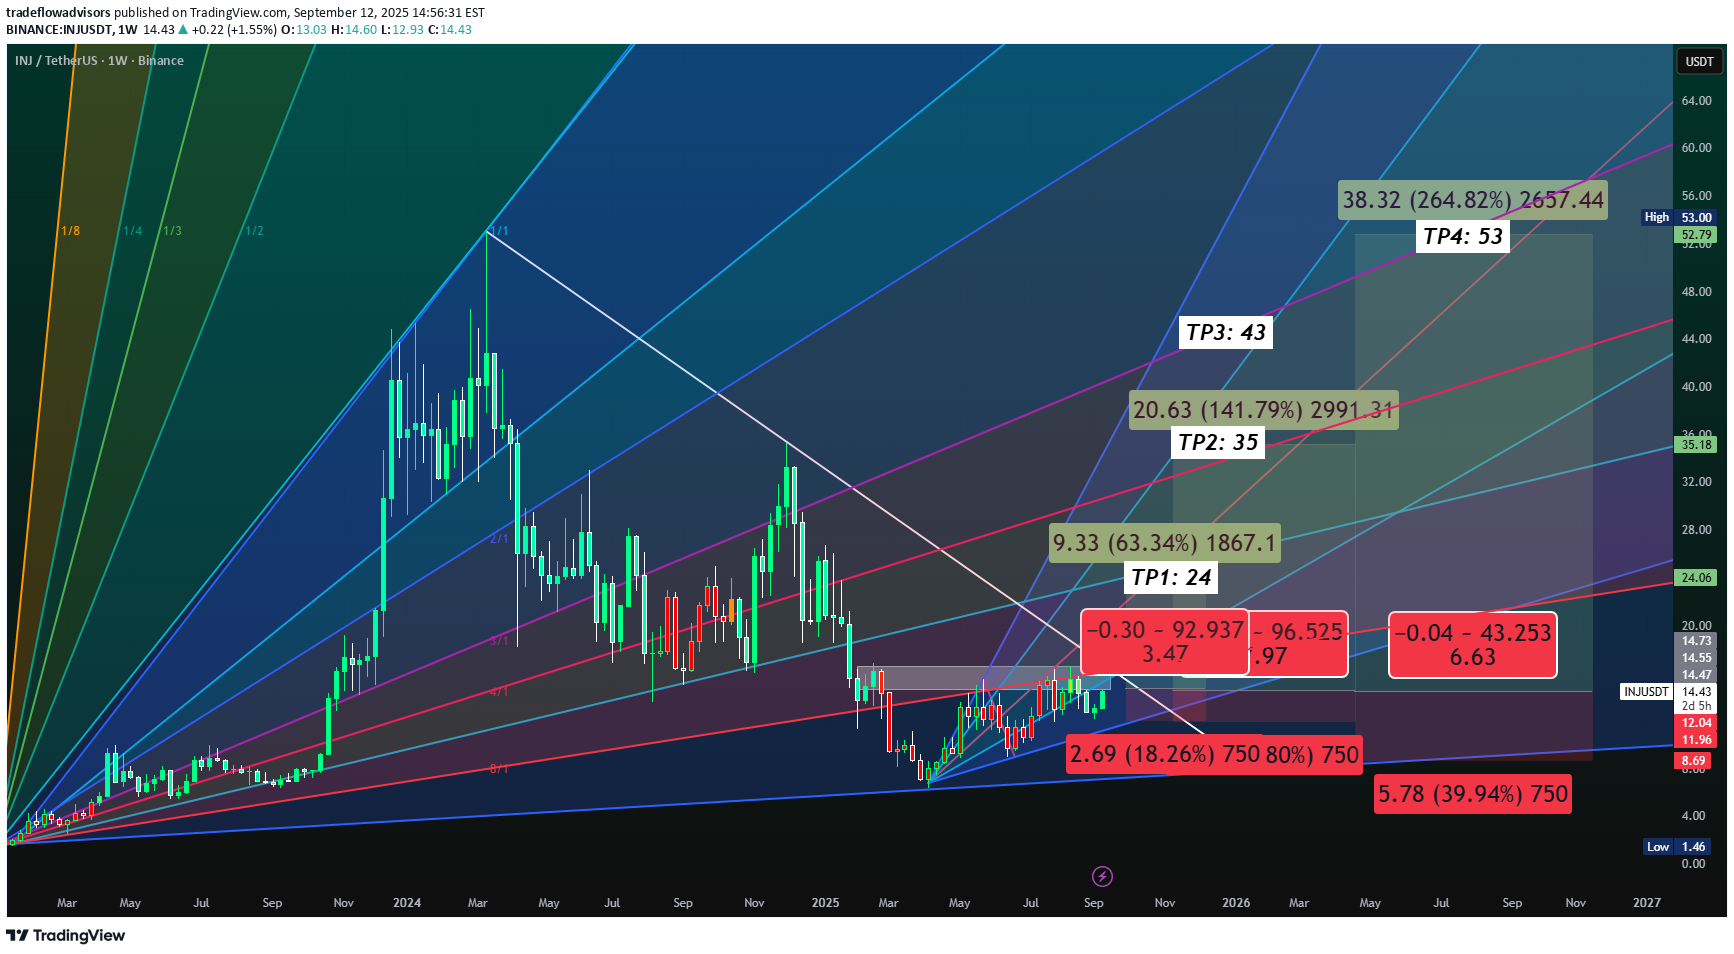
INJ/USDT is trading at 14.42 and approaching a key breakout level at 17.00. Price has been consolidating at the lower range, building energy for the next leg. A clean weekly break and close above 17 will confirm a major structure shift and ignite strong bullish momentum toward recent highs. Above 17, the upside map opens up to TP1: 24 → TP2: 35 → TP3: 43 → TP4: 53. This breakout level also aligns with the upper channel, making it a critical pivot for trend continuation. Until 17 is cleared, expect range-bound action, but once broken, the move can trigger a multi-month trend reversal with explosive upside potential. Watch 17 — breakout here flips structure fully bullish.
tradeflowadvisors
SOLANA (SOL/USD) C&H TG: 298 → 341→ 370 → 450 → 475 → 523
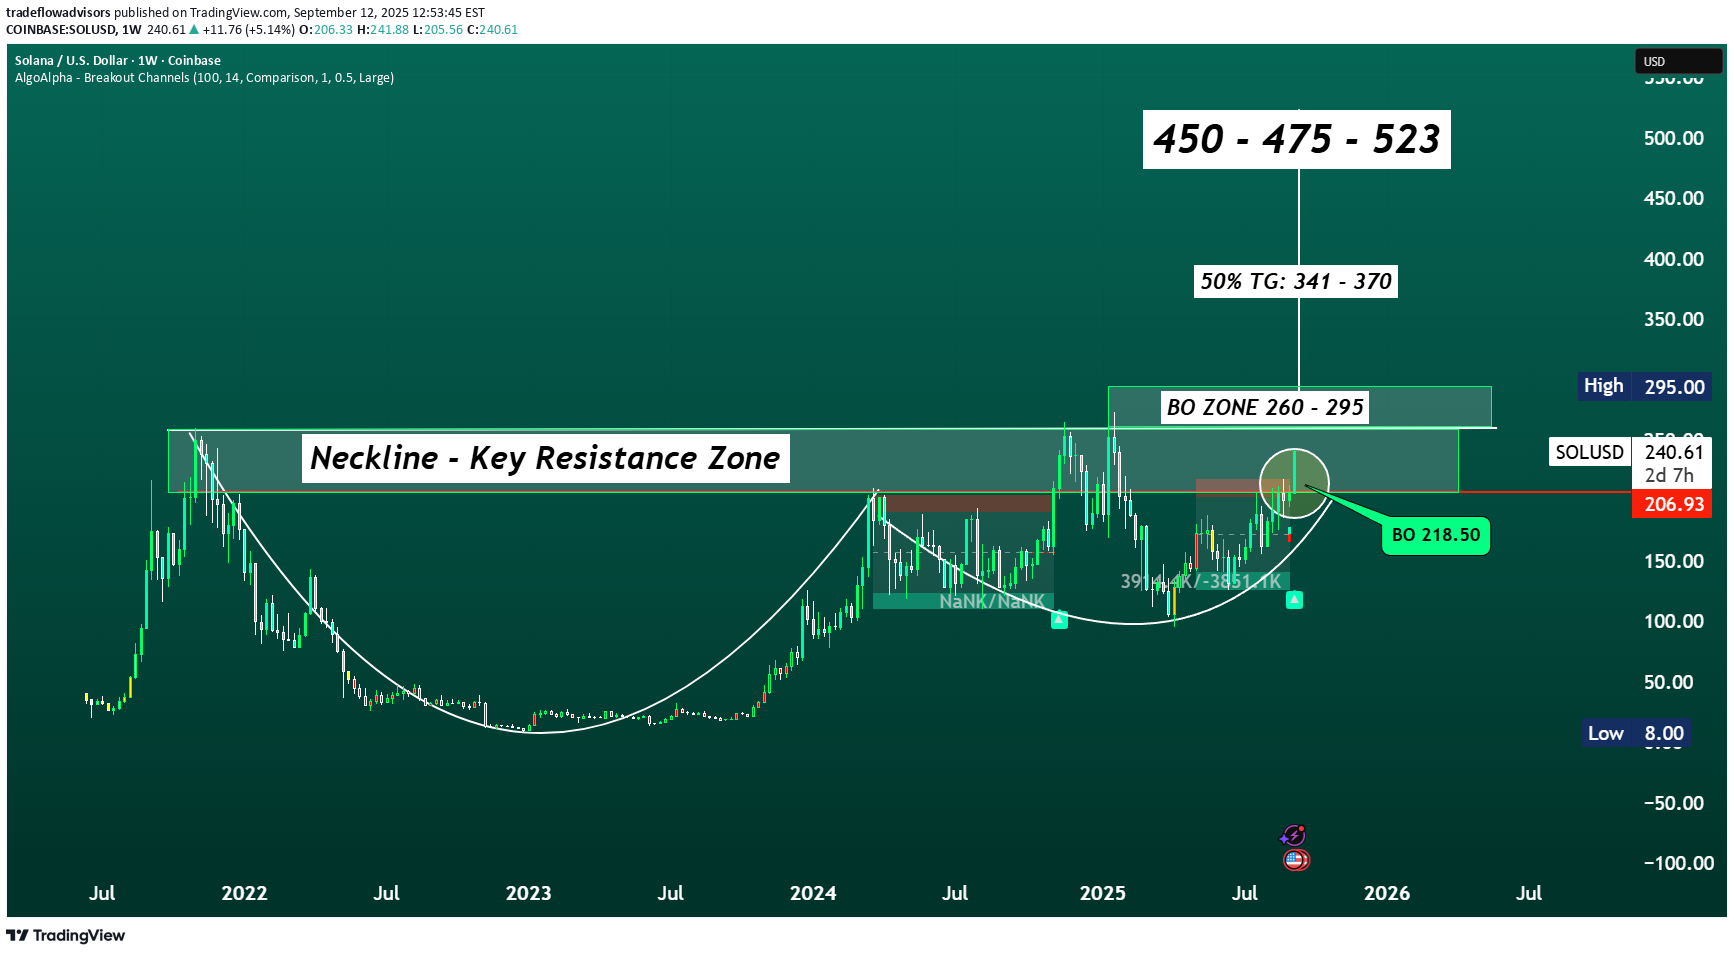
SOL/USD is building a multi-year Cup & Handle on the weekly chart, signaling the potential start of a major long-term bull cycle. Price has reclaimed the breakout trigger at 218.50 and is heading towards the key breakout zone at 260–295. A clean weekly close above this zone can confirm a structural breakout and shift the market structure bullish on the higher timeframe. Once confirmed, the long-term measured move points to 341–370 initially, followed by extended targets at 450 → 475 → 523. Any sustained hold above 260–295 will likely flip this zone into a strong demand base, supporting a multi-month uptrend. Ideal strategy for investors: Accumulate gradually on dips near 218.50–230, add on confirmed weekly close above 260, and hold for long-term trend targets with a protective stop below 206 to manage downside risk.
tradeflowadvisors
BM/USDT - Bullish Cup & Handle Breakout Setup on 4H

BMT/USDT – Bullish Cup & Handle Breakout Setup on 4H Chart ☕🚀 BMT/USDT has formed a classic Cup & Handle pattern on the 4H timeframe and is gearing up for a breakout above the neckline zone (0.1454). The price is currently hovering around 0.1321 with increasing volume, suggesting bullish momentum is building. Fibonacci extensions project key upside targets post-breakout. Pattern: Cup & Handle Breakout (BO) Point: 0.1454 Fibonacci Targets: 🎯 TP1 (50%): 0.1582 – 0.1662 🎯 TP2 (Full): 0.1882 – 0.2126 Volume: Gradually rising – bullish confirmation confirmation 📈 Trade Setup: Buy Entry: On breakout above 0.1454 (with retest confirmation if conservative) Stop-Loss: Below 0.1300 (recent lows and handle support) TP1: 0.1582 TP2: 0.1882+ Risk-Reward Ratio: ~1:2.5
tradeflowadvisors
BTCUSD Weekly Analysis Targeting; 94k - 96k, Followed By 109k

BTCUSD Weekly Analysis Bitcoin is currently trading around $88,638, showing strong recovery momentum after bouncing off the key 61.8% Fibonacci retracement level at $74,412, often referred to as the “golden pocket.” This bounce suggests that buyers are stepping in aggressively at this support zone, which has historically acted as a major turning point in bullish market structures. On the upside, BTC has now reclaimed the 38.2% retracement level at $87,375, turning it into a short-term support zone. Holding above this level gives Bitcoin a clear path toward the next key resistance at $94,430, followed by a stronger resistance cluster around $96,211, where both Fibonacci and historical horizontal resistance align. Technically, the weekly chart also confirms a breakout above the descending trendline, adding confluence to the bullish reversal. This move aligns with the Inverse Head & Shoulders pattern seen on the daily chart — a classic bullish formation that typically leads to strong upward continuation. If BTC continues to hold above $87,000, the next short-term target would be $94,000–$96,000, and if that level breaks with volume, Bitcoin could be gearing up for a retest of its previous highs around $109,000. On the downside, $81,145 (50% retracement) and $74,412 (61.8%) remain critical support levels, with any break below $74K shifting the outlook back to bearish. The chart structure, key Fibonacci zones, and bullish reversal pattern all point toward continued upside, with BTC needing to maintain above 87K to sustain the bullish trend.94K TESTED
tradeflowadvisors
SOLANA (SOL/USDT) – TP: 170 - 252 & 295

SOLANA (SOL/USDT) is currently trading at $130.17 after rebounding from a well-defined sell-side liquidity zone between $98 and $131. The recent weekly candle shows a strong bullish recovery (+22.93%), suggesting that liquidity has been swept and buyers are stepping in. This level has historically served as a key accumulation zone, and the bounce aligns with oversold conditions on the StochRSI, which is now curling upward — indicating growing bullish momentum. If price sustains above the $125–131 level, the next immediate upside target lies between $170 and $188, where prior supply and consolidation occurred. A confirmed breakout above this range opens the path toward a higher resistance zone between $254 and $295 — a region that aligns with unfilled inefficiencies and previous price distribution. The ideal swing trade approach would be to enter on a pullback within the $110–125 range, set a stop loss below $98, and scale out at the $170 and $254 levels. This setup offers a favorable risk-to-reward ratio of approximately 1:3.5. Trade Strategy Suggestion (Swing or Positional): Entry: Ladder between $115–$125 on retrace SL: $105–110 (below wick low) TP1: $170–188 TP2: $254–295 Scaling Out: 50% at TG1, rest at TG2 or trail stops above $200 With macro tailwinds like renewed interest in Solana’s DeFi and meme coin ecosystems, institutional flow returning, and technical confirmation across multiple timeframes, this could be a high-conviction mid-term play for swing traders and positional investors alike. 🔮 Narrative & Fundamentals: ETH L2 congestion → SOL gets transactional inflows SOL’s DeFi, NFT, and memecoin activity resurging (e.g., W WIF , B BONK ecosystem) Institutional flow picking up (Grayscale SOL trust rallying) SOL remains one of the fastest L1s with growing developer tractionSOL/USD is building a multi-year Cup & Handle on the weekly chart, signaling the potential start of a major long-term bull cycle. Price has reclaimed the breakout trigger at 218.50 and is heading towards the key breakout zone at 260–295. A clean weekly close above this zone can confirm a structural breakout and shift the market structure bullish on the higher timeframe. Once confirmed, the long-term measured move points to 341–370 initially, followed by extended targets at 450 → 475 → 523. Any sustained hold above 260–295 will likely flip this zone into a strong demand base, supporting a multi-month uptrend. Ideal strategy for investors: Accumulate gradually on dips near 218.50–230, add on confirmed weekly close above 260, and hold for long-term trend targets with a protective stop below 206 to manage downside risk.
tradeflowadvisors
SOLUSDT (M) - CUP & HANDLE BREAKOUT, PREDICTION 400+

SOLUSDT: Cup & Handle Pattern Testing Crucial Breakout Zone (193 - 208) SOLUSDT is currently testing a crucial breakout zone between 193 and 208. A confirmed breakout above this range could signal the resumption of a strong bullish trend, with an initial target of 315 - 350, followed by 400 - 437 in the medium to long term (2025 - 2026). Immediate Support: The immediate support level is at 169 on the monthly timeframe.
tradeflowadvisors
GOLD Likely to test the key support zone @1810.50

GOLD-Xaususd c&h formation reversal target completingLikely to test the key support zone @1810.50 - 1805.
Disclaimer
Any content and materials included in Sahmeto's website and official communication channels are a compilation of personal opinions and analyses and are not binding. They do not constitute any recommendation for buying, selling, entering or exiting the stock market and cryptocurrency market. Also, all news and analyses included in the website and channels are merely republished information from official and unofficial domestic and foreign sources, and it is obvious that users of the said content are responsible for following up and ensuring the authenticity and accuracy of the materials. Therefore, while disclaiming responsibility, it is declared that the responsibility for any decision-making, action, and potential profit and loss in the capital market and cryptocurrency market lies with the trader.