
trade-God
@t_trade-God

What symbols does the trader recommend buying?
Purchase History
پیام های تریدر
Filter
trade-God
A Tolled Bell
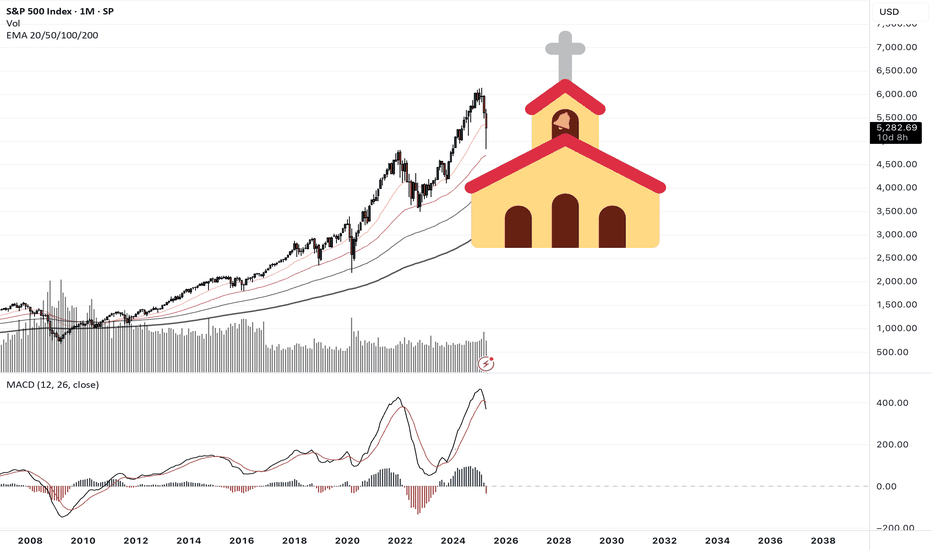
The first bell has rung. A bridge is being paved across the $6000 range. IF it blows up, it likely won't happen until the bridge is constructed and sentiment improves. Expect a few heartfelt endeavors to shoot above $6,660. Base case is long term crab market.Let it run alongside the 20 EMA. The current 6 handle will be the bottom much later in the future. I wouldn't worry about it until 2027.
trade-God
Chips and Dip
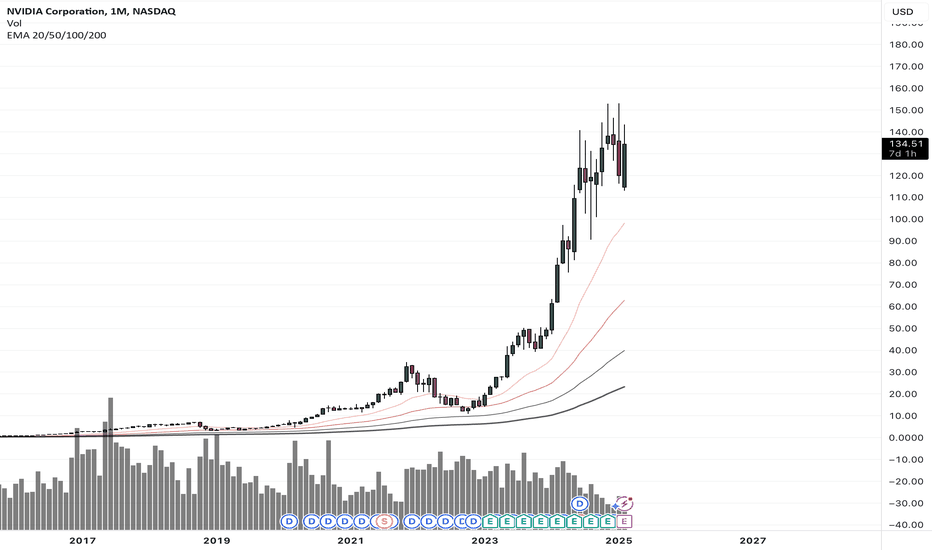
It's over. On the monthly. On the weekly. On the money flow.After this price action is where many "pick and shovel" bagholders decided they should go all in. Hopefully its not too bad.Below $70 seems right to me. Sooner or later.Eroding revenue growth is nothing new. The question is, will it ever return to levels that trigger euphoric fomo? Or is it dead money for a while? Either way there is no buy opportunity until revenue growth ticks up.
trade-God
Goldaholics Anonymous

Pour yourself a glass of Goldschläger and let's review the 12 steps before diving into this. 1. We admitted that we were powerless over the Fed -- that our balance sheet had become unmanageable. 2. Came to believe that a Power greater than our central bank could restore us to solvency. 3. Made a decision to turn our fiat over to the care of sound money, as we understood it. 4. Made a searching and fearless inventory of our finances. 5. Admitted to Peter Schiff, Lyn Alden, and Pomp the exact nature of our wrongs. 6. Were entirely ready to have big, fat Gains. 7. Humbly asked to avoid getting short squeezed. 8. Made a list of all the naysayers about to be harmed. 9. Sent direct messages to them to gloat in victory. 10. Continued to count our gains and polish our bullion. 11. Sought through fundamental and technical analysis to improve our entries and exits. 12. Having had a financial awakening as the result of these steps, we tried to carry this message to other goldaholics, and practice these principles in all of our trades. Macro Fibonacci Below we can see the magic of Fibonacci extensions, measuring the last macro bull run to the 2016 low. Zooming in a bit, it is clear that these levels attract attention. Each one of these fibs acts as a step in the staircase. All we need to do is look at volume and price action to validate each level. The smart money had their sell orders at the 0.618 Fibonacci extension. The 0.5 could not hold which indicates that the next level down will be tested. Watch for heavy volume to come in there near the 0.382 level. In the U.S. stock market and many other developed financial markets, about 70-80 percent of overall trading volume is generated through algorithmic trading. Historical Price Action Looking back to the last bull run there are a few simple patterns to watch for... 1. Weekly MACD flailing around above the zero level. 2. Mark the down trends and wait for the break. 3. Price action is above the 20 Week EMA. Trading Setup Using historical price action the trading setup becomes clear... 1. Weekly MACD is flailing above the zero level. 2. The down trend line is clear. Wait for the break. 3. Wait for 20 Week EMA support. Now, the targets are the Fibonacci levels above, and the ghost bars look reasonable, however, it would be wise to take a look at what exactly is driving Gold on this path. The U.S. Dollar The Dollar index inversely pressures Gold prices so this is worth noting. 1. Momentum is shifting bullish as a bullish MACD divergence reveals itself on the daily chart. 2. This recent move was the 3rd wave down which often precedes a reversal. 3. The index is at the bottom of this future channel. As this index recovers back towards the 200 Week EMA, it will surely scare the metals market. However, the macro downtrend is only on it's first wave down. From a technical standpoint, the second wave is often the deepest as panic sets in from the failed recovery. Treasury Yields Yields recently had a similar bullish MACD divergence with a very weak recovery that followed. The trend is still clear and it's highly likely to roll over as it timidly approaches the trendline in the coming months. Gold has been riding along side Bonds so this should continue to drive up prices. Depending on the severity of falling yields, it could trigger temporary crashes in the metals. But longer term, buying the dips is the way to go. Trading is risky. Don't do it. Long Bullion: Gold, Silver, Platinum Equities: GDX, PHYS, CEF, SLV, RIO, SPPP Futures: (Not yet)Comment: 1. The daily MACD has crossed above zero... 2. The price action is supported, for now, above the fib level... 3. Sort of broke the down trend... If there is a break higher it could be time to buy... BUT the DXY is still poised for a rally so caution is important. Stay tuned.Trade active: I like buying dips in Gold futures now that price has stabilized above resistance with the daily MACD above zero... I'll be using the 4hr chart, the 50 EMA, and the RSI set at 10. RSI is now near the bottom of the range and price is supported by the 50 EMA +1 @ 1921Comment: Gold price is right at the 200 day EMA so could be a bounce here. The problem is DXY looks like it could make that reversal so I'll set a stop loss on Gold below that 200 day EMA. In that case I would take a short term loss and just wait to get in at a better price.Comment: I'm going to play this by holding through this sell off and buying more if there's a bounce at the next fib level. But to hedge my losses, I'll look to short oil if this DXY rally continues to demolish the markets.Comment: Still coasting above the main trendline. I think downside is limited but will remain cautious about adding here to a leveraged futures position. However, I am still accumulating a core position in gold/silver/metal equities like PHYS, CEF, SLV, RIO.Comment: Once it gets back above that fib level (again) I'd expect a short squeeze.Trade active: Frankly, gold has been such a pain in the ass. I'm slightly net red from last years big win and this years big loss. Long @ 1734 on the August contract. Trusting the fib gods on this one.Comment: Fib bounce, good. Above the 50 EMA, good. 1,800 almost hit, almost good. Probably will be a messy journey but the 0.5 fib is where I'd consider selling this long.Comment: Taking a step back on the weekly view, the MACD is showing momentum is much stronger now than in the last few attempts to break trend. The downside risk is there but the upside looks much bigger but could take a while if there's a pullback from here. Another reason why I grabbed the December(z) contract on this one.Comment: Gold prices are now approaching the target 0.5 fib extension. I'm up about $1,400 on this position but took a big fat L on the last dips. As of now I've broken even on Gold futures YTD. This setup looks to be the beginning of a larger move so I'm just going to hold it through in case of a squeeze up to $2000 happens sooner rather than later.Comment: Momentum hasn't even kicked in yet.Comment: Gold is forming a very similar pattern as the previous top in, price and the MACD. If history does repeat, the place to cut positions is where the MACD dips below 0 and price breaks the trendline.Comment: next resistances and then longer term top.
trade-God
Bitconacci

Some insights panned out, not all. Nevertheless, the red path was dead on top and bottom. Inebriated mania severed by a wyckoff top. The weight of the Monthly MACD momentum spike happened to tip price over, corroborated by price drifting underneath the 12 EMA. These were the signals. These signals are reversed now. Momentum is poised.12 EMA flipped.What is expected, lower prices and higher prices? What about an extended lull that grinds into an unexpectedly massive climb. There are reasons for this analysis, one is a new concept on nobody's radar yet. First, the weekly MACD seems to need a short breather. What is more interesting, however, is the Fibonacci time sequence marked in Blue. Cycles lining up since in 2009, btc genesis.more or less flat for some time in the worksboring crab walk sideways to slight incline is fairstep back view with williams vix in the trenchessteady accumulateGiven the lynchpin, 66k is a base to overshoot towards 2M. Settling around 660k.channel established~90k pause for a bit, likely.pause. perchance. prepare for dip buys in coming weeks.The channel tilt is now adjusted upwards. A hard crash up and out might be looming. Otherwise the channel trend continues.crash up
trade-God
The House

The House Bitcoin is a symbolic play against the House in a game of blackjack, hence the 21 million limit. The player soon finds the odds are stacked against him despite his enthusiasm Looking at the stack you find some things aside from the momentum indicators rolling over A. How euphoric does a market need to be to create laser eyes? 2. Or a president of a country going all in and celebrating like he's won 3. Media attention on full blast with ads on every corner of the web 4. The sense of "I'm going to be rich" K. Doge Even if this is not the end, a note on crypto in general. It's clear all of this is centralization profiting from decentralization. Does the majority really want platforms where people are completely uncensored and responsible for themselves. Or does it make more sense that the House absorbs what's useful and leaves the rest for dead As a final thought and the perhaps most important. Keep in mind the entire bitcoin saga started 2009, in the midst of asset bubbles in nearly every corner of the marketComment: To expand a bit more on this. I still own some bitcoin and the tech is solid so it's unlikely Bitcoin dies. The question is more about where we are in the market cycle and what exactly is the reason the price is where it's at. Is the upside potential greater than the risk. Technicals Technically it is in a fifth wave up. Originally my fib analysis in previous posts pointed toward $123k, which could still happen as it hasn't broken trend yet. But that upside potential isn't really that much considering the gain from $11k when this cycle started. The fib level below would be more attractive to buy. Psychology In previous articles I wrote about the emotions and phases of market cycles. You can feel exactly where people are at if you follow social media. There is a sense of invincibility. That 1 btc = 1 btc so price doesn't matter. Total nonsense as it's all relative to what you can buy and 1 of anything = 1 of anything 1. The Stealth Phase: Accumulation of the unknown 2. The Awareness Phase: Institutional investors start to see potential 3. The Mania Phase: Media injections to hype it up. 4. The Dump: Profit taking Strategies When someone with resources spots opportunity, efforts are made to maximize it. Tether is born and who knows what other schemes to capitalize on this new asset in the wake of super low interest rates and next to no regulation. Inflows build up the price. Money chases the hype. A Congress member adds laser eyes to their avatar. Companies and countries yolo in.Comment: Bitcoin has never crossed below the 12 month EMA without falling from that EMA about 50 - 68% That puts the downside risk target around 21kComment:
Disclaimer
Any content and materials included in Sahmeto's website and official communication channels are a compilation of personal opinions and analyses and are not binding. They do not constitute any recommendation for buying, selling, entering or exiting the stock market and cryptocurrency market. Also, all news and analyses included in the website and channels are merely republished information from official and unofficial domestic and foreign sources, and it is obvious that users of the said content are responsible for following up and ensuring the authenticity and accuracy of the materials. Therefore, while disclaiming responsibility, it is declared that the responsibility for any decision-making, action, and potential profit and loss in the capital market and cryptocurrency market lies with the trader.