
tokentradertv
@t_tokentradertv

What symbols does the trader recommend buying?
Purchase History
پیام های تریدر
Filter
tokentradertv
Bitcoin Head and Shoulders dip to $60,500

BTCUSDT has created a classic Head & Shoulders pattern on the daily timeframe. If it confirms below the neckline, we could see a pullback to $60,500 - the same distance from the peak of the Head to the neckline from the breakdown.This is not actionable until it confirms, when a candle closes lower than the first candle closing below the breakdown.Given the institutional interest and price manipulation, this could be turned around by market makers, so I won't be entering a short, or exiting my spot positions, until I see confirmation on the daily timeframe.However, I could also see those who manipulate the markets wanting a lower entry for large amounts of institutional capital - so the price could likely be manipulated either way. What the chart tells us is this is a big bearish signal to be monitored.There is also a Bearish Divergence on the RSI, which isn't actionable by itself, but does add a layer of confluence.
tokentradertv
Buying $TAO Retrace with Fibonacci Levels

TAOUSDT had an incredible move up last month, nearly 2x from the mid-300s to a high of $480.We've hit a short term high, and seem to be in a consolidation phase.How low will this go? Well, if we look at the Fib Retracement levels from the start of this run up to the recent high, we can identify three likely entry points:$385$360$315If you want to invest in Bittensor's innovative AI technology, you can buy at market price right now; or, you can set limit orders for the levels above, to DCA into your position.Just keep in mind, the price may not reach these lows, and could turn bullish again at any monent.If/when Binance lists this token, or Coinbase finally changes its flawed ranking on it, or a major tech company announces a partnership, this token could moon. 🚀
tokentradertv
tokentradertv
BTC Price Target: $48k

How high could this BTCUSD pump go? 48K is a solid level to exit.There was a local low at 48K in March of 2022.The Fib retracement level .618 between the ATH of SWB:69K and cycle low of 16k is at 48KMany traders are talking about exiting at this level, which will bring selling pressureI can understand HODLing through the ups and downs, but if you're long with leverage, 48k seems like a great place to exit a trade.I know I just made a price prediction for 136k for Bitcoin, but I think a temporary retrace is likely. Especially if the ETF is announced, and many traders exit to take profits."Buy the rumor, sell the news." We are in the rumor stage, people.
tokentradertv
$BTC Price Prediction: $136,000 (8 Green Weekly Candles Signal)
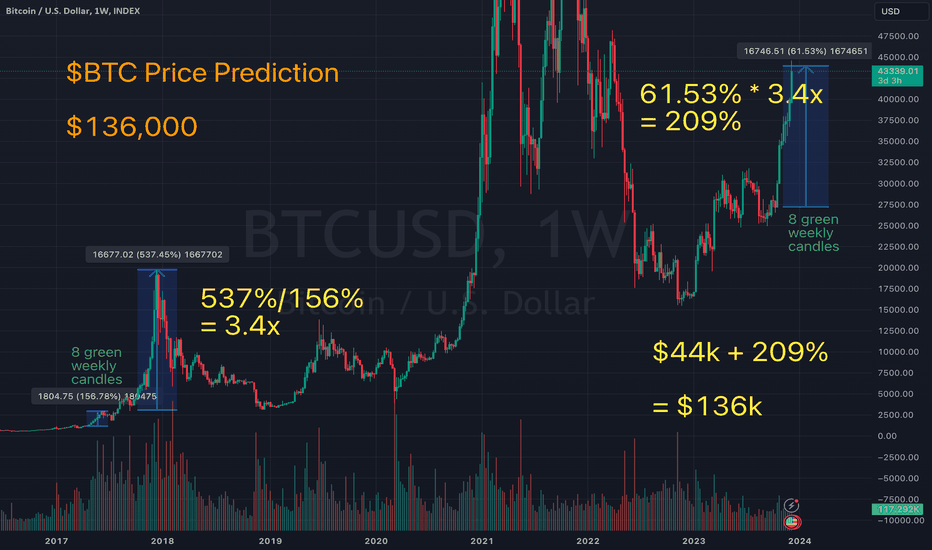
(REPOST with better chart)We know a bull run is coming, with ETF approval and institutional money adding to volume early next year. But how high could BTC go? Here's an educated guess:We just closed 8 weekly green candles on Bitcoin.You can't see the last time this happened in many TradingView exchange charts, because it was back in 2017, and most of today's exchanges weren't even around back then.I had to look on BTCUSD - if it's not working in this link, you have to type INDEX:BTCUSD into Supercharts, as they describe in the most complete Bitcoin trading history, to get to 17 April 2017, and count the eight green weekly candles to 5 June 2017.This was a move of 156%.After some consolidation, Bitcoin then went up in a bull run by 537%, to nearly 20k on 11 December 2017.This is a ratio of 3.4x.That's the ration for 156% for eight green weekly candles, followed by a 537% bullish move.Our recent eight weekly candles from 27K to 44k is an increase of 61.53%.If we have a proportional bull move after some consolidation, 3.4x this 61% is 209%.That brings us to 136k for the top of the incoming bull run.This is all speculation, NFA, I'm just a dude on the internet, and I'm probably wrong. But these numbers look intriguing, and give me a plausible exit point for the trades I'm making today.
tokentradertv
$BTC Price Prediction: $136,000 (8 Green Weekly Candles Signal)

We know a bull run is coming, with ETF approval and institutional money adding to volume early next year. But how high could BTC go? Here's an educated guess:We just closed 8 weekly green candles on Bitcoin.You can't see the last time this happened in many TradingView exchange charts, because it was back in 2017, and most of today's exchanges weren't even around back then.I had to look on BTCUSD - dang, it's not working in this link, you have to type INDEX:BTCUSD into Supercharts, as they describe in the most complete Bitcoin trading history, to get to 17 April 2017, and count the eight green weekly candles to 5 June 2017.This was a move of 156%.After some consolidation, Bitcoin then went up in a bull run by 537%, to nearly 20k on 11 December 2017.This is a ratio of 3.4x.That's the ration for 156% for eight green weekly candles, followed by a 537% bullish move.Our recent eight weekly candles from 27K to 44k is an increase of 61.53%.If we have a proportional bull move after some consolidation, 3.4x this 61% is 209%.That brings us to 136k for the top of the incoming bull run.This is all speculation, NFA, I'm just a dude on the internet, and I'm probably wrong. But these numbers look intriguing, and give me a plausible exit point for the trades I'm making today.Sorry, mobile users, you can't see the entire chart. Here's a screenshot:caelanhuntress.s3.amazonaws.com/crypto/ideas/btc-136k-price-prediction.jpg
tokentradertv
$BTC Price Prediction: $136,000 (8 Green Weekly Candles Signal)
We know a bull run is coming, with ETF approval and institutional money adding to volume early next year. But how high could BTC go? Here's an educated guess:We just closed 8 weekly green candles on Bitcoin.You can't see the last time this happened in many TradingView exchange charts, because it was back in 2017, and most of today's exchanges weren't even around back then.I had to look on BTCUSD - dang, it's not working in this link, you have to type INDEX:BTCUSD into Supercharts, as they describe in the most complete Bitcoin trading history, to get to 17 April 2017, and count the eight green weekly candles to 5 June 2017.This was a move of 156%.After some consolidation, Bitcoin then went up in a bull run by 537%, to nearly 20k on 11 December 2017.This is a ratio of 3.4x.That's the ration for 156% for eight green weekly candles, followed by a 537% bullish move.Our recent eight weekly candles from 27K to 44k is an increase of 61.53%.If we have a proportional bull move after some consolidation, 3.4x this 61% is 209%.That brings us to 136k for the top of the incoming bull run.This is all speculation, NFA, I'm just a dude on the internet, and I'm probably wrong. But these numbers look intriguing, and give me a plausible exit point for the trades I'm making today.Sorry, mobile users, you can't see the entire chart. Here's a screenshot:caelanhuntress.s3.amazonaws.com/crypto/ideas/btc-136k-price-prediction.jpg
tokentradertv
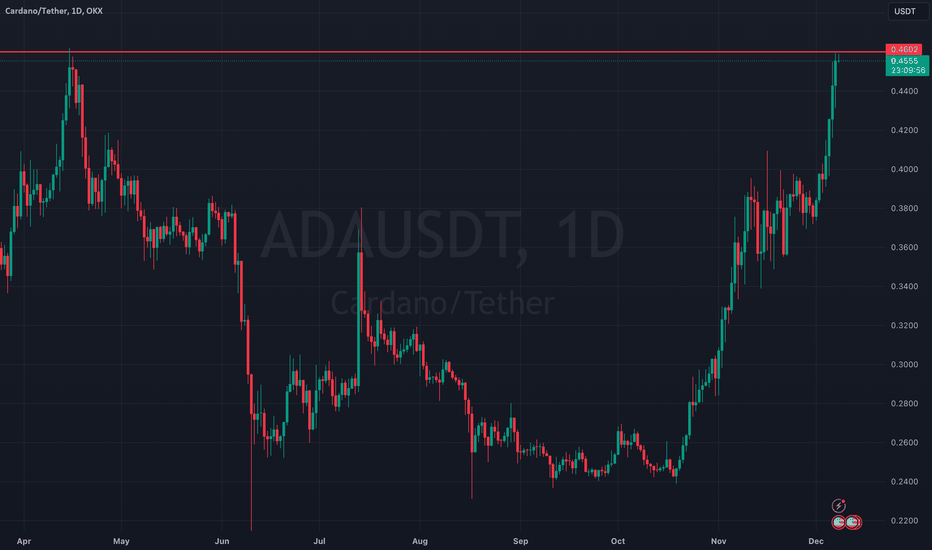
XRP broke out of a descending wedge pattern on the daily chart

For the past two weeks, XRPUSDT has been in a descending channel. Price just broke out of this channel, making higher highs for the first time in a while. If this maintains, we could see a retrace back up to $0.73.Are you bullish on XRP? Now is a good time to load up your bags!
tokentradertv
$SOL Price Target: $75

Solana has been on a tear the last few weeks, one of the best performing large-cap tokens this year.How high could it go? Well, looking back to February of 2022 on the Monthly chart, $75 was the low point of the wick. Price recovered, and then fell through that level with the FTX collapse.If SOL continues to climb, $75 would be a good place to take some profits.
tokentradertv
Time for a BTC pullback?

BTC is not only at resistance, there's also a Death Cross on the RSI indicator. - BTCUSDT is at an upsloping resistance line going back to Feb 2022- There is also significant horizontal resistance around 36,500- The RSI is at 77.5, going lower than the RSI MA (81.19) which could signal a downtrendShorting looks very appealing. But, the last time I said that, at 31k, we hit a god candle and all my shorts got stopped out, so don't listen to me, I'm an amateur.
Disclaimer
Any content and materials included in Sahmeto's website and official communication channels are a compilation of personal opinions and analyses and are not binding. They do not constitute any recommendation for buying, selling, entering or exiting the stock market and cryptocurrency market. Also, all news and analyses included in the website and channels are merely republished information from official and unofficial domestic and foreign sources, and it is obvious that users of the said content are responsible for following up and ensuring the authenticity and accuracy of the materials. Therefore, while disclaiming responsibility, it is declared that the responsibility for any decision-making, action, and potential profit and loss in the capital market and cryptocurrency market lies with the trader.