
tofinse
@t_tofinse

What symbols does the trader recommend buying?
Purchase History
پیام های تریدر
Filter
tofinse
One of the best of all time in this game sold big lot of AAPL
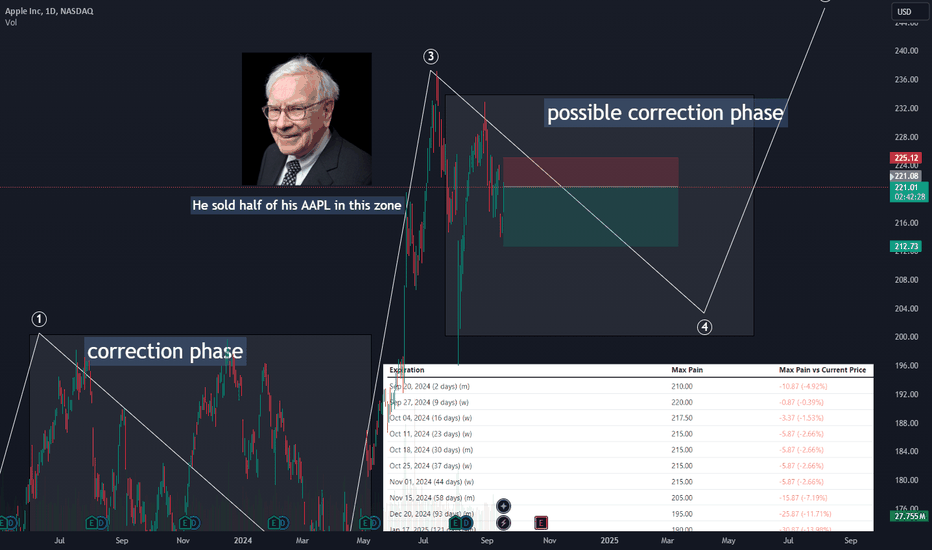
Warren Buffett sold half of his AAPL share in this zone This possible tricker correction Elliot wave also show that we are on 4 wave phase Options chain data show that every drop of AAPL benefit to investment bank who write the options So I short sell AAPL this area hope this good
tofinse
73% and 54% win rate SNRC1 backtesting with Python

Clear up trend in 1D time frame Refer to Elliot wave theory correction seem already finish Python backtest resistance become support trade set up RR=1 when set SL at 1% is 73% RR=4 when set SL at 1% is 54% Win or loss is find because This is very good trade in my opinion
tofinse
we almost can buy the same as big player average price
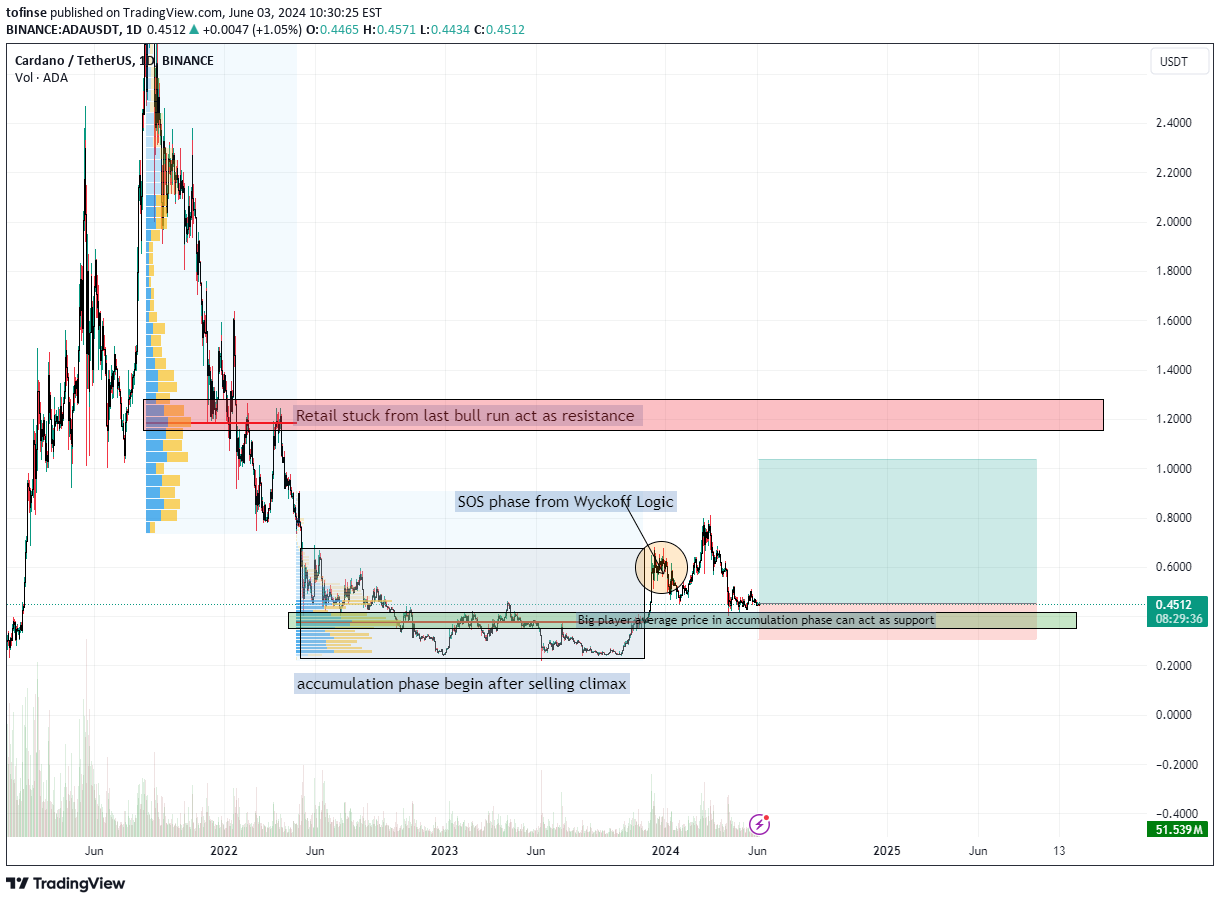
Wycoff logic accumulation phase is explain about big player buy back coin back from retail player who loss their hope and sell coin back to big player which take vey long time we can check estimated price of bid player in accumulate phase using volume profile indicator Now I think price is already pass accumulation phase to fist step of "mark up phase" because we can see SOS (Sign of Strength) that big player try to phase price up and show buying volume last bull run POC can be act as resistance because retail normally sell their coin the get money back as it is retail behavior
tofinse
tofinse
Wyckoff Distribution for META
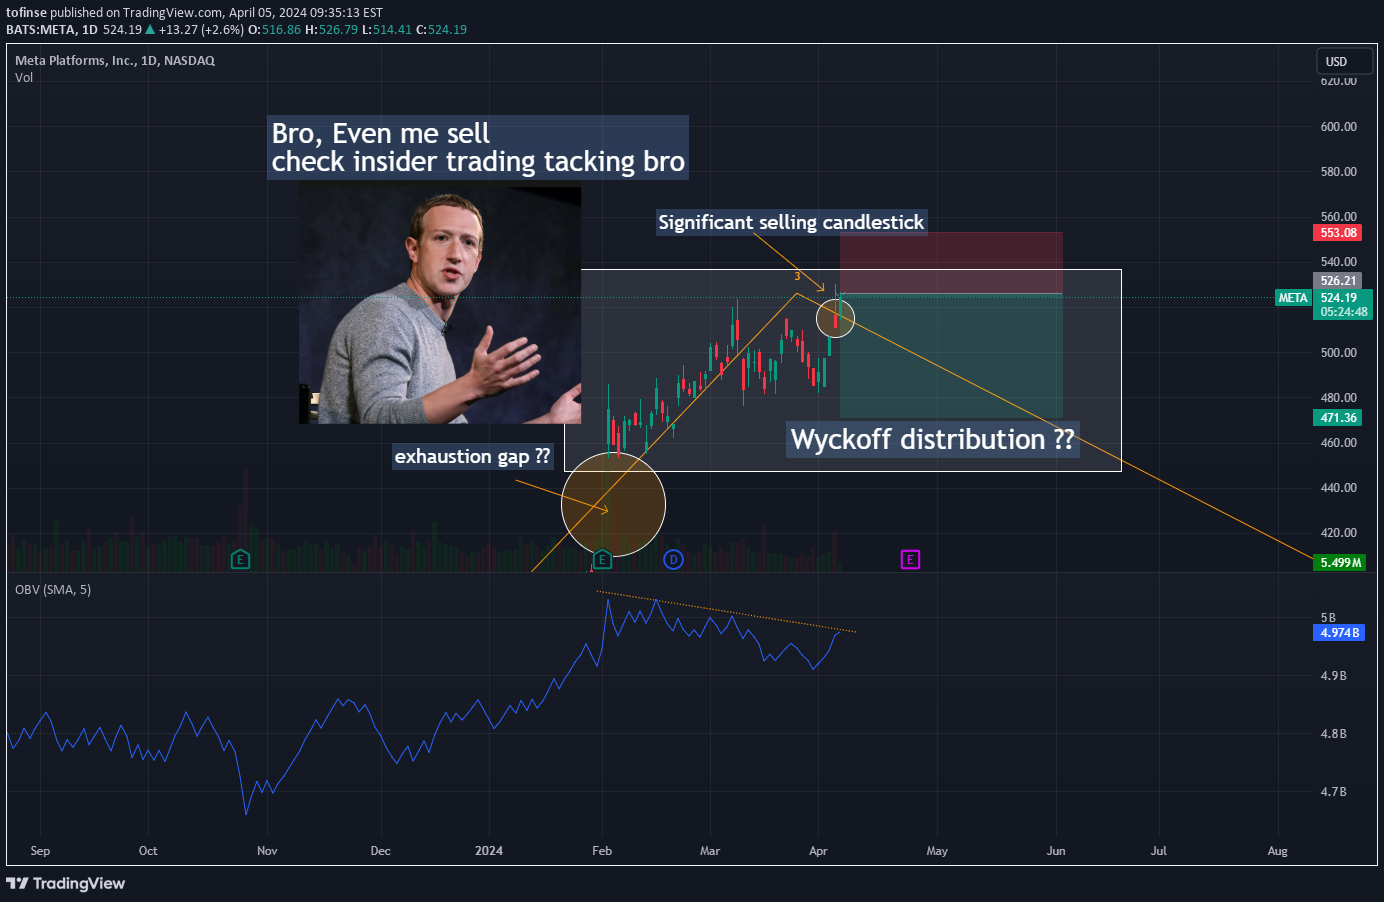
Elliot wave some gap that might be "runway gap" and "exhaustion gap" But there are momentum divergence shown so it more likely to be "exhaustion gap" for sentiment analysis CEO of this company is selling all the way with 0 buying activity for 12 months straight I have little worry about about upthrust that can touch SL so I have to set SL quite far also yesterday have every high volume rejection candlestick | I use it and OBV divergence as confirmation to short selling META with RR=2
tofinse
Gold correction seem not to finish yet

Gold correction seem not to finish yet After clear impulse up wave 12345 now price is correction down quite strong so I assume this correction might be Zigzag pattern to confirm entry this short I check in 4H chart that show high volume of bearish engulfing candle stick For take profit there are many scenario to happen maybe C leg is not go below A So we can manage to close position partially (if we correct LOL)
tofinse
Human behavior is strong resistance

Human behavior is strong resistance Retail traders who don't use leverage will survive from last down move to 25,000USDT Retail traders who don't use leverage don't get liquidated but they feel like their money is lost so many days (65 days from last price move from 30,000 to 25,000) They will sell to get cash back because it feel comfortable like they get money they lost back Also Elliott wave analysis price move up from 25,000 to 30,000 by Diagonal pattern this is passible ending diagonal by Elliott wave theory The logic behind this pattern is big player slowly sell while price moving up (that why this pattern retrace deep compare with impulse wave) So Short in this area TP 1 : incase double correction is happen so price not go down strongly TP 2 : incase impulse wave is happen
tofinse
BTC down 5 wave ?

BTC down 5 wave ? 4H chart is seem like 5 wave is on the way 25,500 - 26,500 USD have so many retail in this range due to strong price down to 25,000 so when price move up a above 25,500 - 26,500 level they will sell to take little profit as normal retail behavior so 25,500 - 26,500 will act as supply zone by logical
tofinse
45days of correction wave finish soon ?

45days of correction wave finish soon ? BTC daily chart is clearly uptrend by Dow theory on 4H price show strong impulse wave and clear correction phase now price retrace into 38% of impulse wave It hard to predict correction phase that when it will end also very very difficult to predict complex correction This correction might be double or triple correction that make price ranging for long time but after I check m30 There are possibility of diamond bottom pattern diamond bottom pattern is top 10 continue pattern and rank number 6 in Thomas Bulkonski book so I think RR it overall OK to open long position here
tofinse
BTC bullish pattern confirm with volume and MACD

BTC bullish pattern confirm with volume and MACD I am not indicator guy but on BTC daily is clear divergence falling wedge pattern is form and seem to be break soon also volume analysis is clear that very low selling volume compare with volume when price strongly break up resistance that now become support
Disclaimer
Any content and materials included in Sahmeto's website and official communication channels are a compilation of personal opinions and analyses and are not binding. They do not constitute any recommendation for buying, selling, entering or exiting the stock market and cryptocurrency market. Also, all news and analyses included in the website and channels are merely republished information from official and unofficial domestic and foreign sources, and it is obvious that users of the said content are responsible for following up and ensuring the authenticity and accuracy of the materials. Therefore, while disclaiming responsibility, it is declared that the responsibility for any decision-making, action, and potential profit and loss in the capital market and cryptocurrency market lies with the trader.