
themissionmentor
@t_themissionmentor

What symbols does the trader recommend buying?
Purchase History
پیام های تریدر
Filter
themissionmentor
Bitcoin Levels To Watch
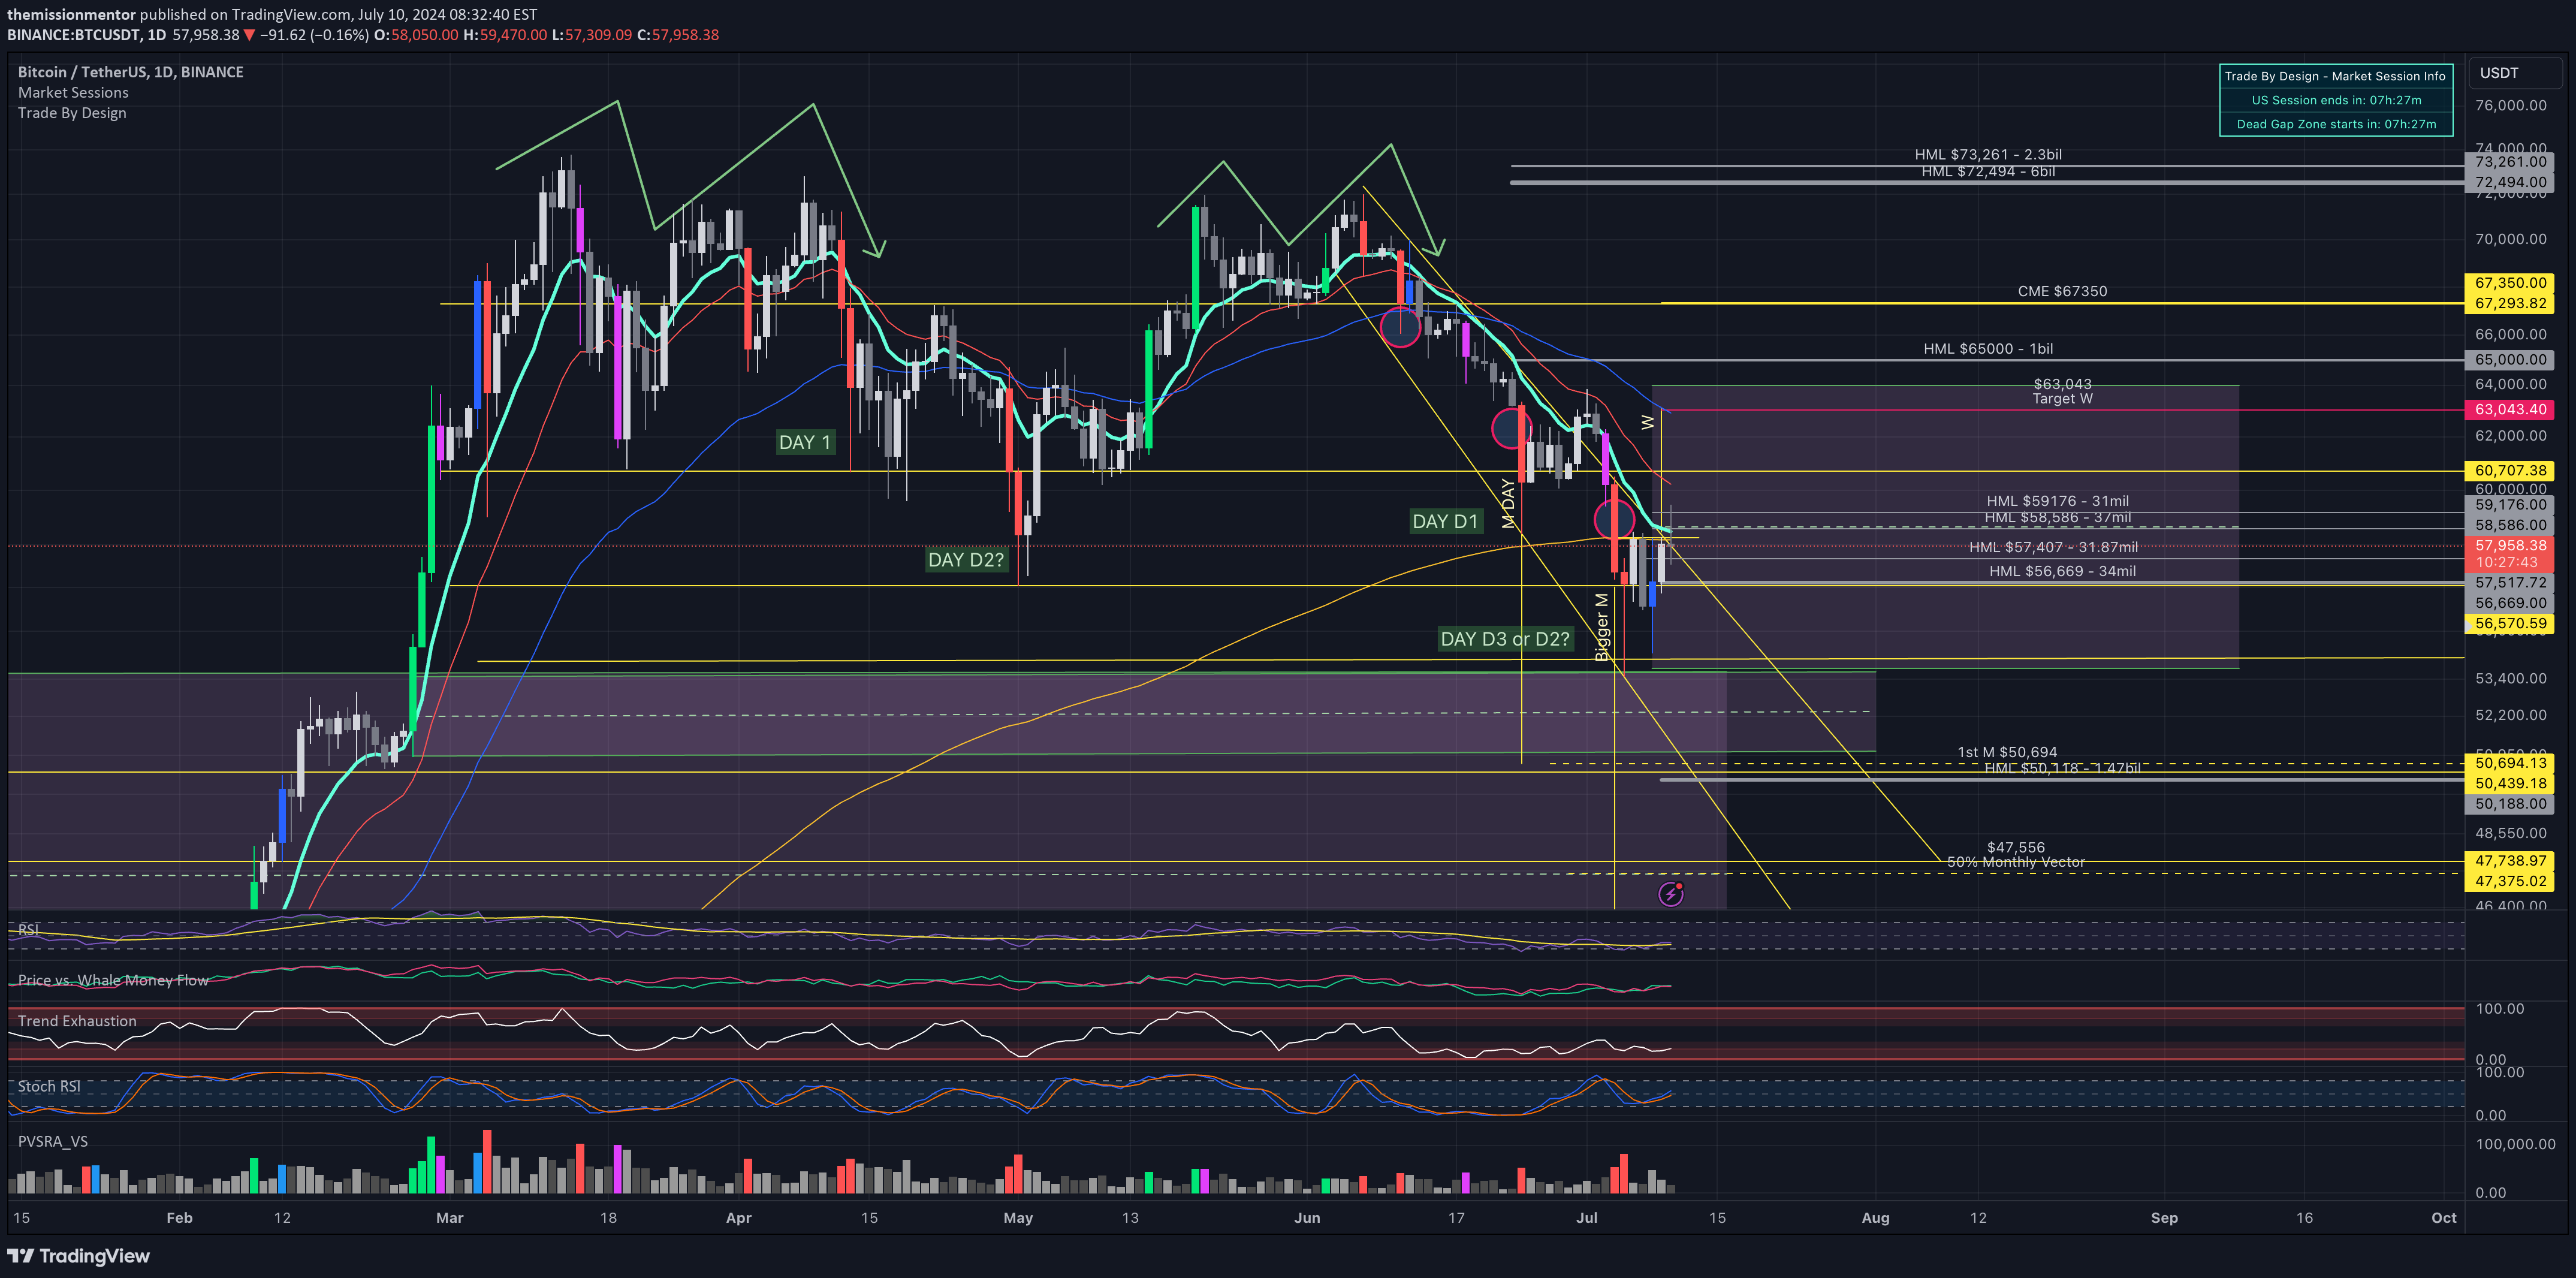
Impulsive wave to the upside completed making the story for a more bullish outlook is compelling. Though we really want to see a move away from that Daily 200 EMA.
themissionmentor
Mana Price Prediction January 2024 After Apple Vision Pro Releas
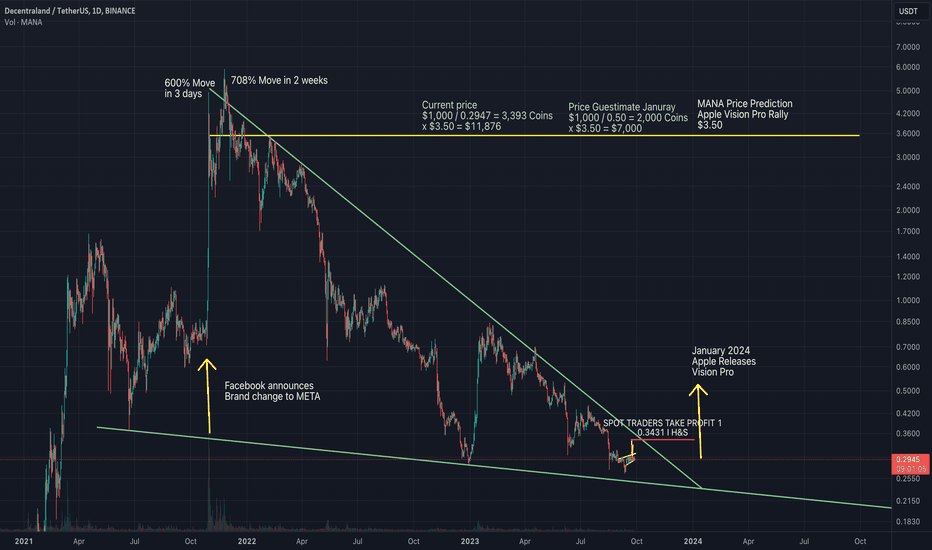
When Facebook announced a brand change to Meta, Mana and other metaverse coins shot up 500-600% in just 3 days. 700% over two weeks. Can we expect the same surge in January when Apple release Vision Pro? This chart is a conservative estimate based on today's price and a predicted 0.50 cent Mana by the end of the year. Of course Mana could be $1 to $1.50 by the end of the year. But you get the picture !
themissionmentor
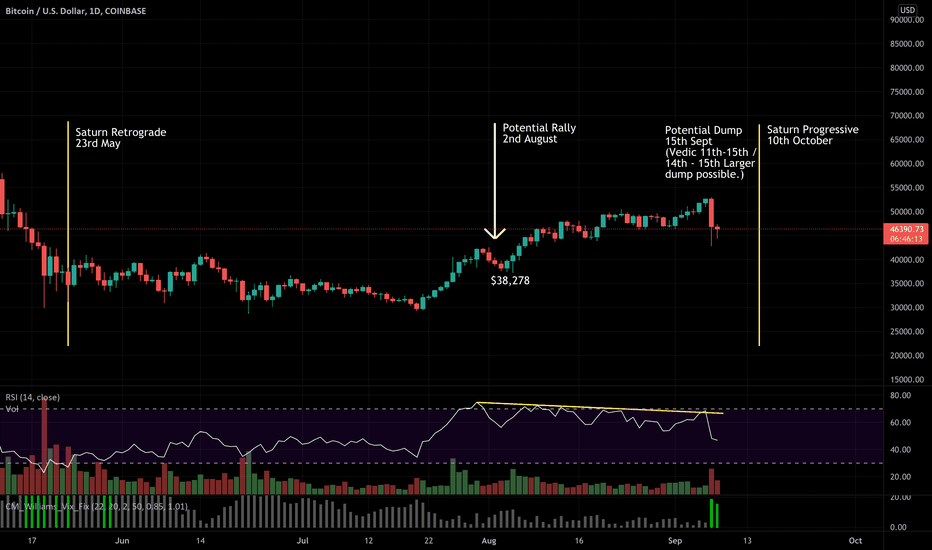
Saturn Retrograde 2022 Bear Market
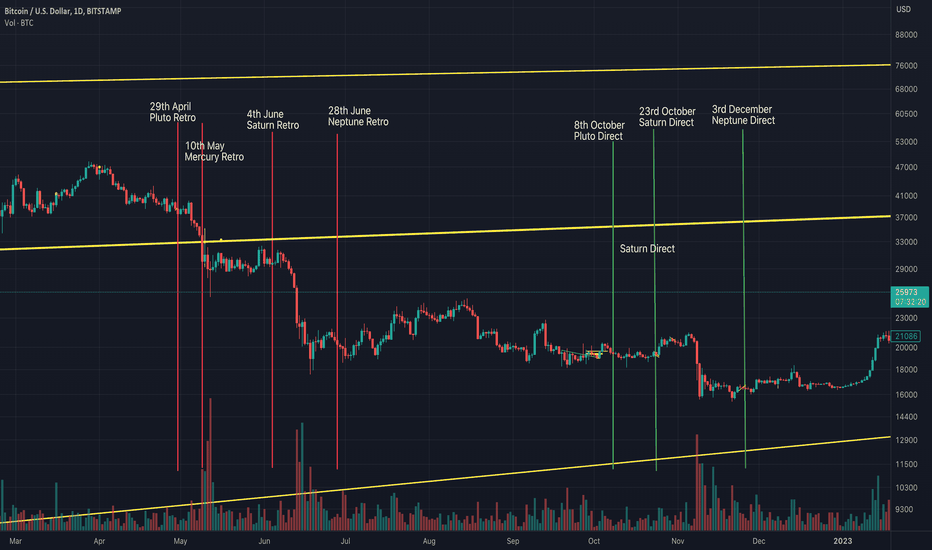
True to form Saturn Retrograe saw a sizable dump in the price of bition in 2022's bear market.
themissionmentor
Having Fun Speculating with Mana

Drinking Kombucha on a Friday night playing with the Mana chart Elliot Wave Count. Mana looking bullish. The TP - Take Profit ideas are prices to watch for spot trading and hodlers to sell and then buy back in on the dip at the BB CBO - Buy Back Cheeky Buy Order - These are the price levels to watch for potential bounces. Of course we may not hit these targets, they may extend or fall short. I'm just playing with speculation to entertain myself becuase i've had too much caffine! What are your thoughts? Let's see how this plays out.
themissionmentor
Does Neptune Retrograde Every Year Signal The Bottom Is In?
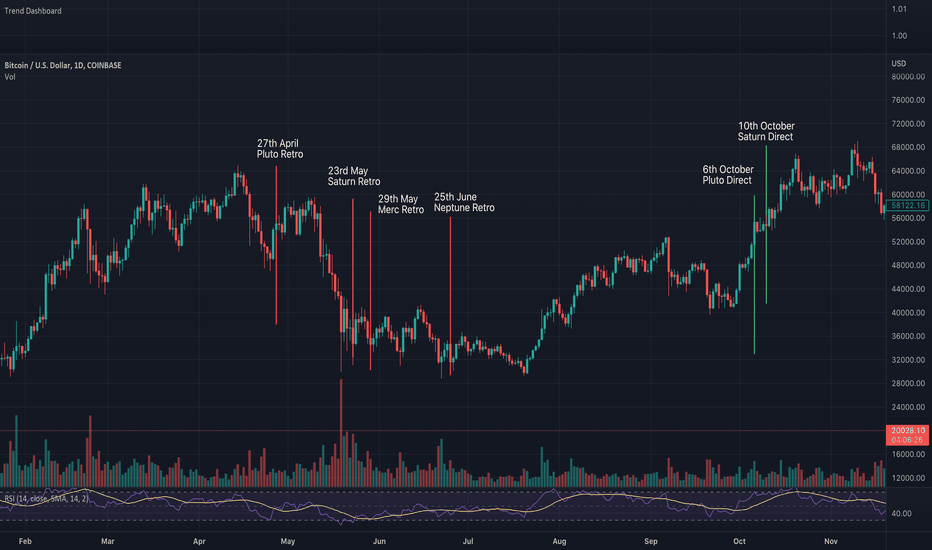
There's a retrograde season of 3 big planets that seem to have yearly consistent patterns. Neptune Retrograde has often signified the bottom is already in not just a few days before. See my other retrograde charts for 2020, 2021, 2022
themissionmentor
Descending Triangle Breaks Bearish Accept For 40% Time Bullish
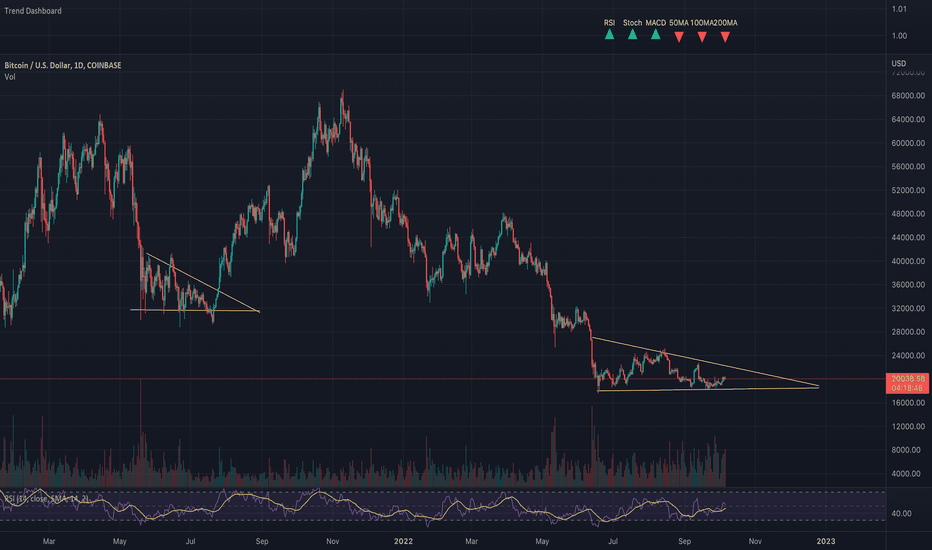
We usually think of descending triangles are bearish patterns as there is a 60/40 change in favour of the bulls. Accept one very notable time when sentiment from many analysts were expecting a $10K Bitcoin back in 2021, and we broke bullish to a new all time high. We have a similar pattern emerging now. Me thinks more likely to break bullish in the next week.
themissionmentor
2022 Retrograde Season Nearing An End - Pump In Sight
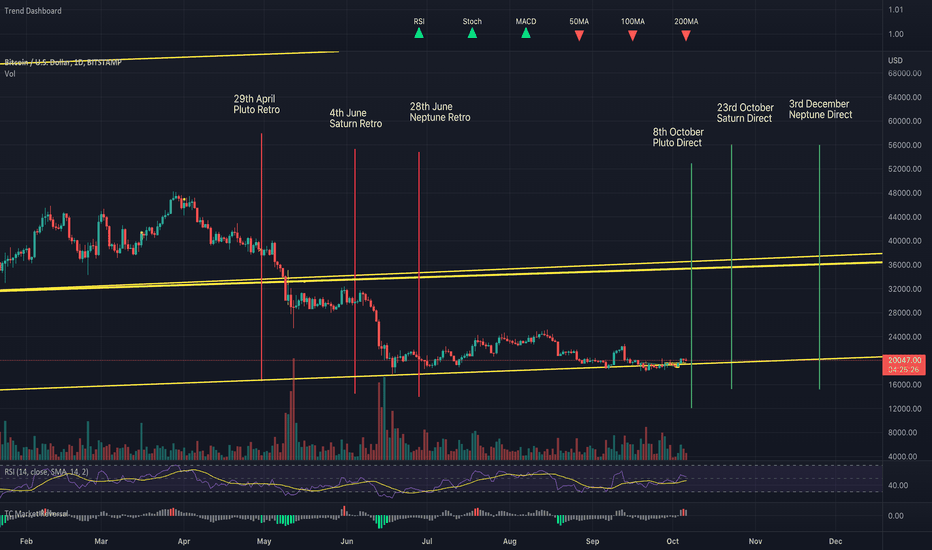
Every year 3 slow moving planets enter what is called Retrograde for several months then go Direct. Every year you can see market reactions around these times. We usually start dumping into Retrograde of Pluto, Saturn and Neptune. When we go retrograde Saturn we usually see a hard dump. Then as we start nearing the end of retrograde season of these 3 slow movers, we have already bottomed out and start our incline to the next all time high, albiet it may take a few years to get there when in a bear market. The dates on the charts reflect dates to watch for pumps away from the bear market bottom for 2022. See my retrograde charts for 2021 and 2020 to see the same patterns playing out.
themissionmentor
Speculating the Bottom for Bitcoin around $10,000 to $13,000K
Many analysts I've listened to over the couple of months have said a bottom in for Bitcoin around $10-$13K because they use the previous ATH at $68,000 ish as the top of this Bull Market season. That would mean a break in pattern from previous cycles where the bottom is lower than the previous Bull Season top out. This is one of the reasons why I'm leaning toward another month or so of upward action, setting a new all time high so the bottom would fall around $22,000 where and unclosed CME gap is. We shall see. If this Full Moon sees a dump to create a higher low I'll lean toward a supercycle on the way. If we see it create a lower low then I'll concede $68K was the top.
themissionmentor
themissionmentor
Can Saturn & Mercury Retrograde Forecast A 77% Hike For Bitcoin?
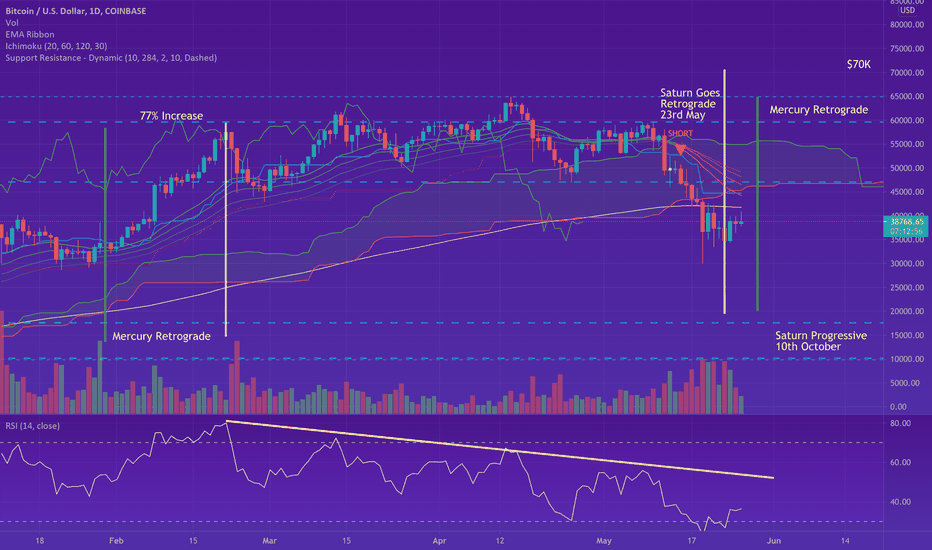
Further to my idea on 2020 Saturn Retrograde and Mercury Retrograde showing patterns in price action, this coming Mercury Retrograde 29th of May, could tell us if we're in a bull or bear cycle. When merc goes retro in bear market price action tends to dip. In a bull market it tends to rally. Note the retrograde period starting in January of 2021 by the first green line. We came into it from the downside, flattened out and trended up for a few days to rally the day mercury went retrograde. We dumped after it went progressive several weeks later. Now Saturn Retrograde is often "retarded speed" as you'll see in the chart line idea below. However this time we're also entering into Mercury retrograde having started to trend up from this recent dump. Februarys mercury retrograde saw a 77% pump to the upside. IF we get the pump this weekend or soon after, 77% takes up into the $70K range. My question I'll be asking as I observe this scenario playing out, is "Will the planets affect any Wychoff plans, or are the Wychoff plans waylaid by the planets? If you're trading over these next 3 weeks, I think it's good be mindful, especially if you're shorting, that we have a potential bullish scenario about to play out. I'm on the fence. Still looking at other years price action to see a bigger pattern. Check out the RSI... Divergence that started back in February's bumper month. Your thoughts?
Disclaimer
Any content and materials included in Sahmeto's website and official communication channels are a compilation of personal opinions and analyses and are not binding. They do not constitute any recommendation for buying, selling, entering or exiting the stock market and cryptocurrency market. Also, all news and analyses included in the website and channels are merely republished information from official and unofficial domestic and foreign sources, and it is obvious that users of the said content are responsible for following up and ensuring the authenticity and accuracy of the materials. Therefore, while disclaiming responsibility, it is declared that the responsibility for any decision-making, action, and potential profit and loss in the capital market and cryptocurrency market lies with the trader.