
sypool-AI-TradeGenius
@t_sypool-AI-TradeGenius
What symbols does the trader recommend buying?
Purchase History
پیام های تریدر
Filter
Signal Type

sypool-AI-TradeGenius
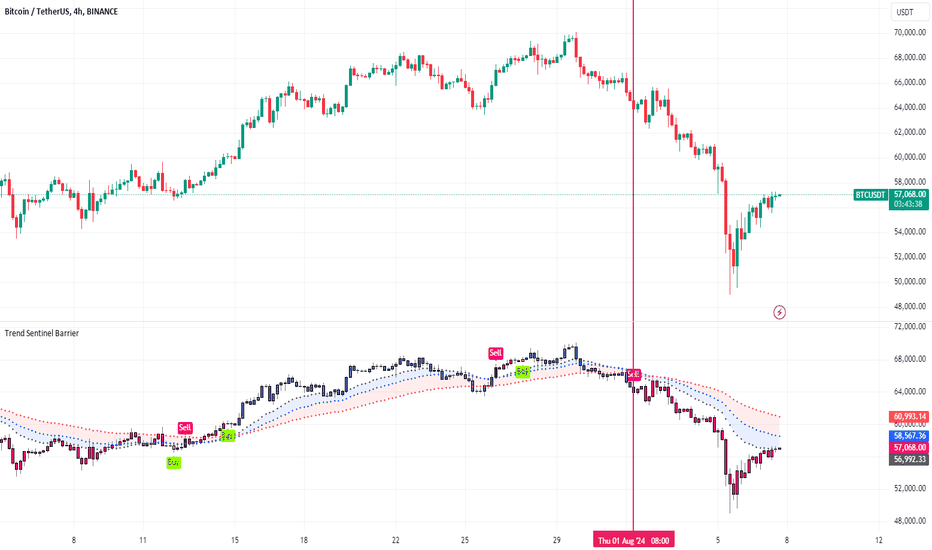
J225 was pump after dump, fixing all the dips. Federal Reserve officials have stated one after another that the United States has not reached recession, and U.S. stocks have fluctuated upward. Assets around the world seem to be back on track. Based on the rising volatility of global assets, today we still analyze BTC, the representative of crypto, which will make more sense. Although U.S. stocks opened lower last Friday due to employment data, they remained volatile on Friday. So the first asset to dump are crypto. And judging from the current rebound, most token have not repaired all the declines since Friday. The correlation between crypto and traditional assets has increased following the listing of BTC ETF and ETH ETF. Therefore, we have reason to believe that the high volatility of global assets this time is caused by the dump of the crypto market and other assets’ misjudgment of the recession. Returning to crypto, regardless of recession or not, a significant increase in bears strength at large levels is certain, and there is a possibility of a trend reversal. In the short-term, V-reversal did not appear. Although BTC is rebounding, the strength of the bulls has not yet been confirmed. In our analysis on Monday, we mentioned that the TSB indicator prompted a SELL signal on August 1, which meant that BTC entered a bearish trend. We see that after a short rebound, the column approaches the wavy area, and the bearish force will increase. This is a suitable to add bearish positions. To sum up, we believe that BTC’s rebound may be coming to an end. Combined with the reactions of various markets, there is a high probability that BTC will enter a volatile period. Introduction to indicators: Trend Sentinel Barrier (TSB) is a trend indicator, using AI algorithm to calculate the cumulative trading volume of bulls and bears, identify trend direction and opportunities, and calculate short-term average cost in combination with changes of turnover ratio in multi-period trends, so as to grasp the profit from the trend more effectively without being cheated. KDMM (KD Momentum Matrix) is not only a momentum indicator, but also a short-term indicator. It divides the movement of the candle into long and short term trends, as well as bullish and bearish momentum. It identifies the points where the bullish and bearish momentum increases and weakens, and effectively capture profits. Disclaimer: Nothing in the script constitutes investment advice. The script objectively expounded the market situation and should not be construed as an offer to sell or an invitation to buy any cryptocurrencies. Any decisions made based on the information contained in the script are your sole responsibility. Any investments made or to be made shall be with your independent analyses based on your financial situation and objectives.

sypool-AI-TradeGenius
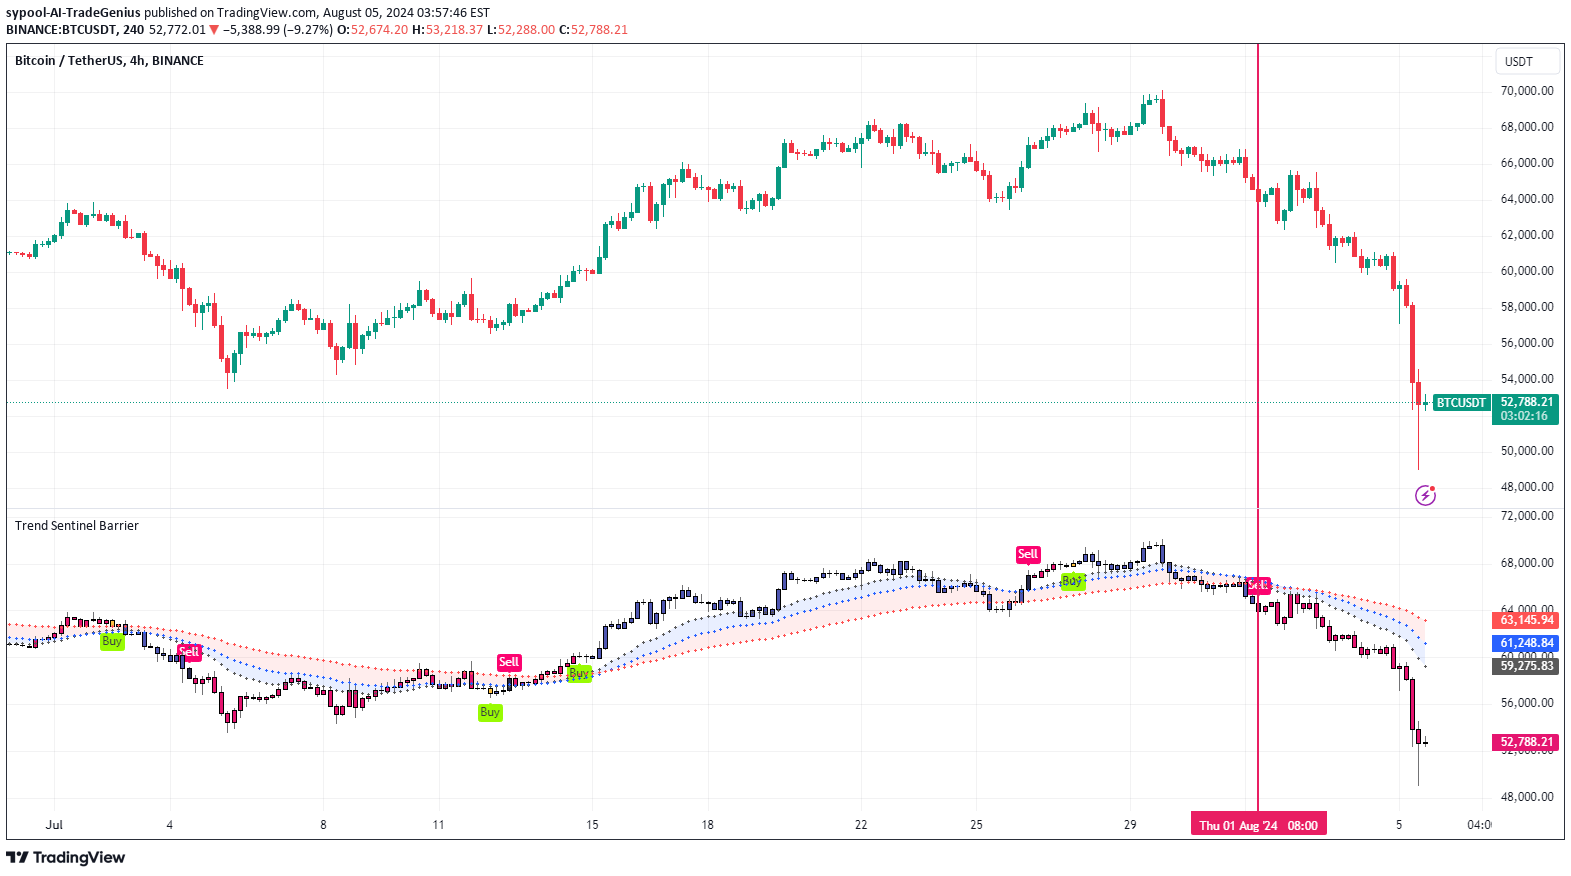
The market saw a massive pullback following Friday's employment data. Not just crypto, but almost all risk assets fell. U.S. employment data in July showed that the employment situation has deteriorated. After that, the interest rate swap market priced in the Federal Reserve to cut interest rates by 50bp in September. This did not bring about a pump, on the contrary, the market began to price in a recession. Stocks and crypto both fell, but gold did not rise further on recessionary factors, indicating that there is still disagreement about recession. Judging from past history, the Federal Reserve held an interim meeting in March 2020 to cut interest rates to combat the recessionary impact of Covid-19. So we believe that the current economic situation is still under the control of the Fed, and if it gets out of control, there will be an interim meeting. Back to market performance. Based on the listing of BTC ETF, BTC is the most stable token in the cryptocurrency market, but it also suffered a drop of nearly 20% over the weekend and penetrated the low in early July. The bears has significant power. At the 4h level, the TSB indicator prompted a SELL signal on August 1, after which BTC began a downward trend. If you had opened a short position based on the TSB indicator at that time, you would have made a gain of over 15%, without any leverage. Introduction to indicators: Trend Sentinel Barrier (TSB) is a trend indicator, using AI algorithm to calculate the cumulative trading volume of bulls and bears, identify trend direction and opportunities, and calculate short-term average cost in combination with changes of turnover ratio in multi-period trends, so as to grasp the profit from the trend more effectively without being cheated. KDMM (KD Momentum Matrix) is not only a momentum indicator, but also a short-term indicator. It divides the movement of the candle into long and short term trends, as well as bullish and bearish momentum. It identifies the points where the bullish and bearish momentum increases and weakens, and effectively capture profits. Disclaimer: Nothing in the script constitutes investment advice. The script objectively expounded the market situation and should not be construed as an offer to sell or an invitation to buy any cryptocurrencies. Any decisions made based on the information contained in the script are your sole responsibility. Any investments made or to be made shall be with your independent analyses based on your financial situation and objectives.

sypool-AI-TradeGenius
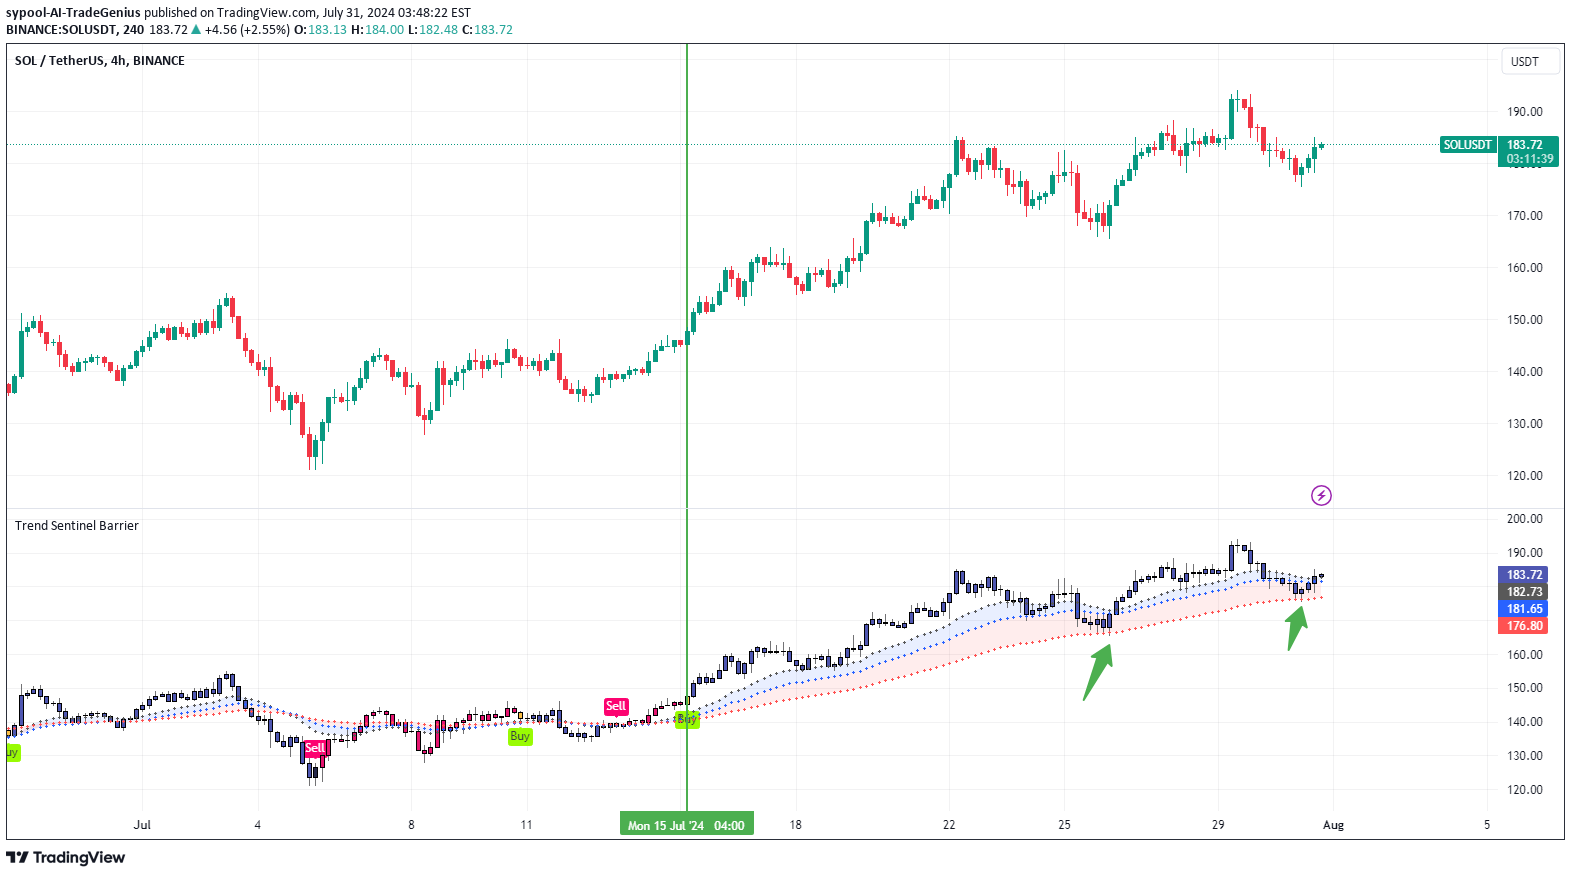
After BTC failed to stand above 70000, it did not fall much. The bulls seemed to intend to gather strength again to attack the 70000. The FOMC will be announced today. Although the market does not expect the FOMC to cut interest rates this time, time is passing and the best news is the absence of bad news. Employment data for July will be released on Friday. Yes, this is a great opportunity for BTC. However, Altcoins do not want to take this risk. Most Altcoins are waiting for BTC to reach the target before taking action. Hah, you know why. Therefore, in the current environment, tokens that are still rising or maintaining fluctuation are good choices for trading, and and are less likely to be manipulated. So, a month after the last article was published, SOL became the subject of our discussion again. At the 4h level, SOL prompted a BUY signal on July 15 and started a new rise after that. After the SOL hit 190 yesterday, it started to pull back, the wavy area came into play again, preventing further declines. The bullish trend in SOL is currently performing well. If you are an investor with a low risk appetite, always choose a bullish token to go long, or a bearish token to go short. Introduction to indicators: Trend Sentinel Barrier (TSB) is a trend indicator, using AI algorithm to calculate the cumulative trading volume of bulls and bears, identify trend direction and opportunities, and calculate short-term average cost in combination with changes of turnover ratio in multi-period trends, so as to grasp the profit from the trend more effectively without being cheated. KDMM (KD Momentum Matrix) is not only a momentum indicator, but also a short-term indicator. It divides the movement of the candle into long and short term trends, as well as bullish and bearish momentum. It identifies the points where the bullish and bearish momentum increases and weakens, and effectively capture profits. Disclaimer: Nothing in the script constitutes investment advice. The script objectively expounded the market situation and should not be construed as an offer to sell or an invitation to buy any cryptocurrencies. Any decisions made based on the information contained in the script are your sole responsibility. Any investments made or to be made shall be with your independent analyses based on your financial situation and objectives.

sypool-AI-TradeGenius
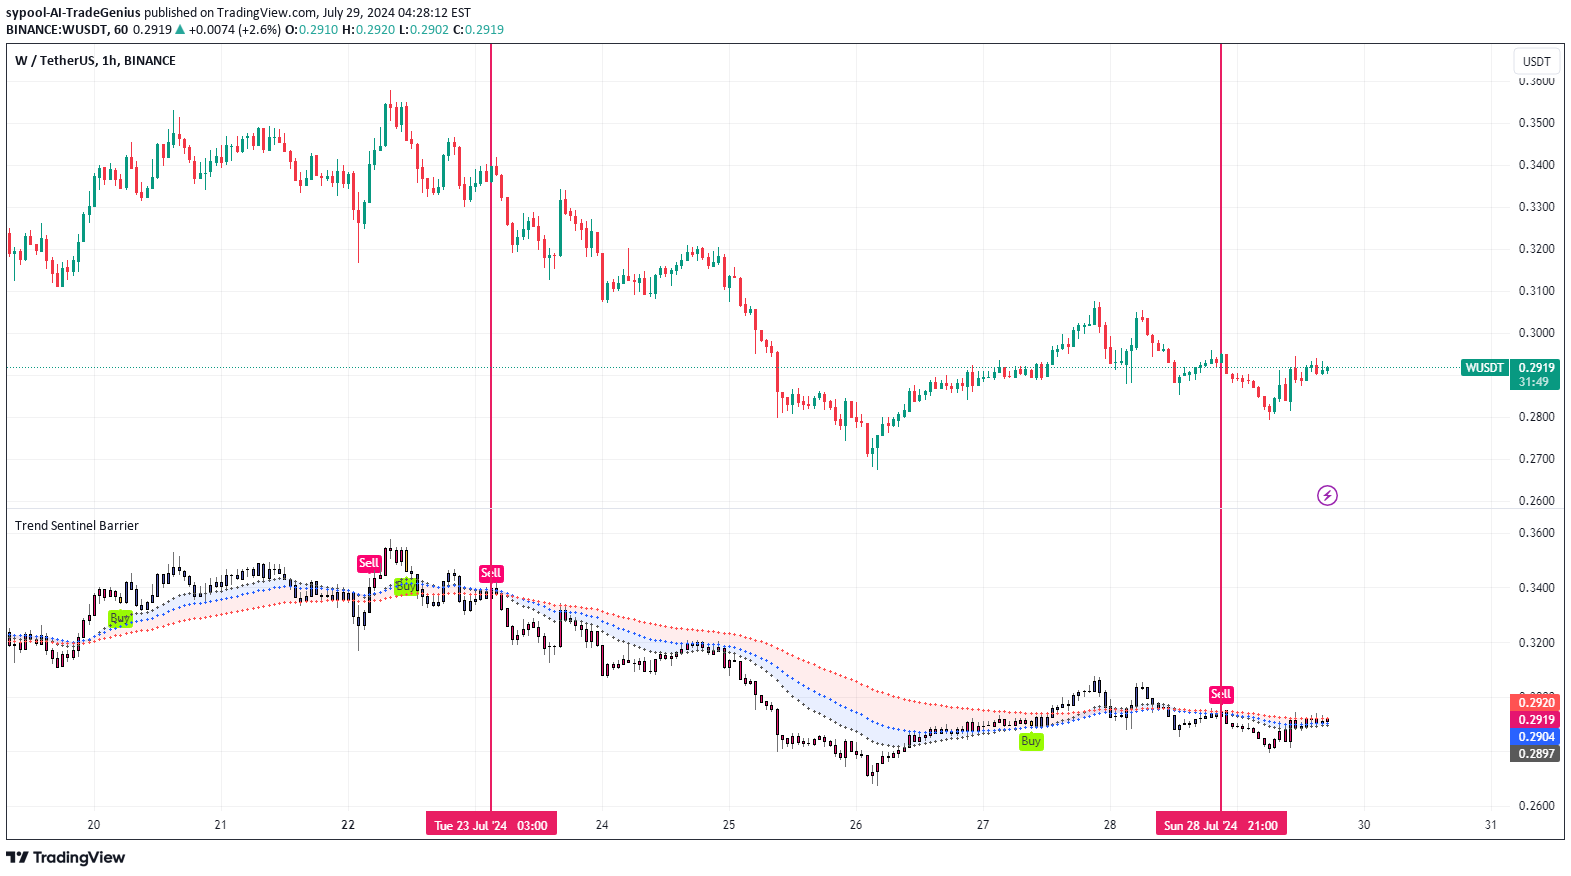
In the crypto market, there is an event-driven strategy based on token unlocking, which we mentioned in a previous analysis on WLD. This week Wormhole (W) will unlock tokens on August 3, releasing 600m W, worth approximately 180m US dollars. Equivalent to 33.33% of Cir.supply. The ingredients are Foundation Treasure, Ecosystem, and Community, and they may sell the tokens. W may fall as a result. Wormhole belongs to the Cross-Chain Communication track. Unlike cross-chain bridges that meet the needs of ordinary users, the purpose of Wormhole is to build a cross-chain layer to meet the protocols’ demand and improve interoperability. Layer0, Omni network and Axelar all belong to this track. It is the future development demand of the crypto market, but it is difficult to have a pump like the AI track in the short term. So there are trading opportunities combined with unlocking events. Since it will be unlocked this week, both 1h and 4h are good trading levels. If you are not good at trading, then you can use the TSB indicator. TSB has successfully predicted multiple entry of short positions and prompted the SELL signal again on July 28. This indicates that we are currently in a bearish trend. The price is currently rebounding to the wavy area, which, as we have been saying, will provide short strength and is a good position to add positions. Introduction to indicators: Trend Sentinel Barrier (TSB) is a trend indicator, using AI algorithm to calculate the cumulative trading volume of bulls and bears, identify trend direction and opportunities, and calculate short-term average cost in combination with changes of turnover ratio in multi-period trends, so as to grasp the profit from the trend more effectively without being cheated. KDMM (KD Momentum Matrix) is not only a momentum indicator, but also a short-term indicator. It divides the movement of the candle into long and short term trends, as well as bullish and bearish momentum. It identifies the points where the bullish and bearish momentum increases and weakens, and effectively capture profits. Disclaimer: Nothing in the script constitutes investment advice. The script objectively expounded the market situation and should not be construed as an offer to sell or an invitation to buy any cryptocurrencies. Any decisions made based on the information contained in the script are your sole responsibility. Any investments made or to be made shall be with your independent analyses based on your financial situation and objectives.

sypool-AI-TradeGenius
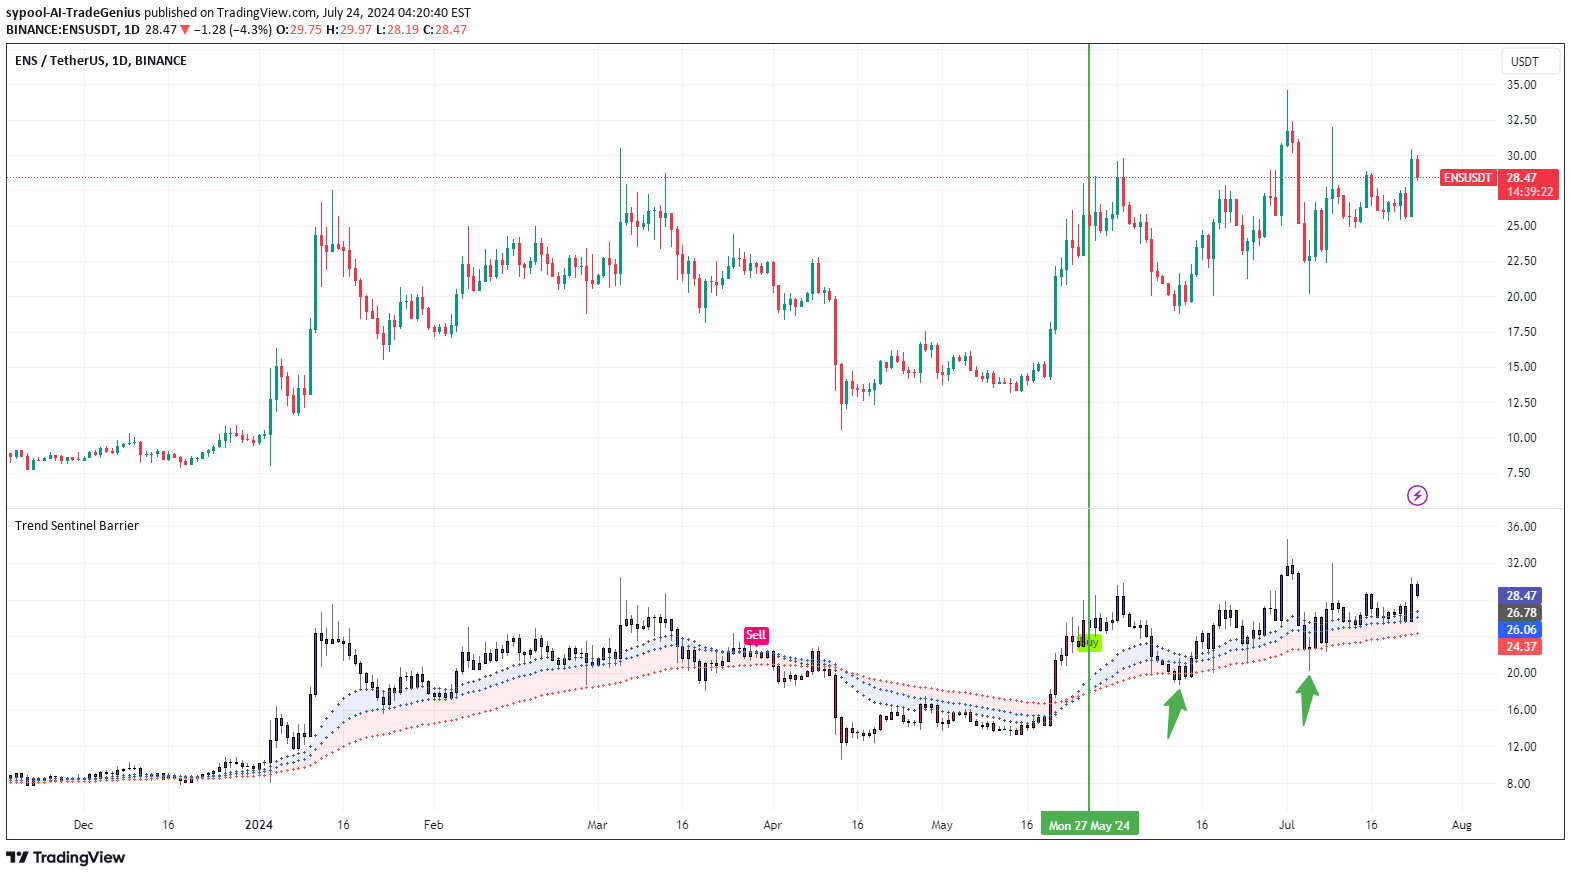
The ETH ETF began trading yesterday. In addition to direct benefits for ETH, which protocols will benefit from an ETH ETF. Almost all native protocols in the Ethereum ecosystem will benefit. Today, let’s talk about ENS, one of them. The main business of ENS is to provide name service on Ethereum. Anyone can personalize an account ID through ENS, converting it from 0x to .eth. The main reason why we chose ENS as one of the important tokens in the post-ETF period is that its trend will be very close to that of ETH in mid-2024, and it has been stronger than many tokens in the market. Tokens including other positive sectors, Uni and Ldo, all began to fall after a short pump. ENS maintains an upward trend with fluctuation. The lows are gradually rising. The TSB indicator gave a BUY signal on May 27, and ENS maintained an upward trend thereafter. And you can see that whenever the bar drops below the wavy zone, the bulls are always able to strengthen. The TSB indicator is very suitable for ENS. At present, the bull trend of ENS is healthy. Introduction to indicators: Trend Sentinel Barrier (TSB) is a trend indicator, using AI algorithm to calculate the cumulative trading volume of bulls and bears, identify trend direction and opportunities, and calculate short-term average cost in combination with changes of turnover ratio in multi-period trends, so as to grasp the profit from the trend more effectively without being cheated. KDMM (KD Momentum Matrix) is not only a momentum indicator, but also a short-term indicator. It divides the movement of the candle into long and short term trends, as well as bullish and bearish momentum. It identifies the points where the bullish and bearish momentum increases and weakens, and effectively capture profits. Disclaimer: Nothing in the script constitutes investment advice. The script objectively expounded the market situation and should not be construed as an offer to sell or an invitation to buy any cryptocurrencies. Any decisions made based on the information contained in the script are your sole responsibility. Any investments made or to be made shall be with your independent analyses based on your financial situation and objectives.

sypool-AI-TradeGenius
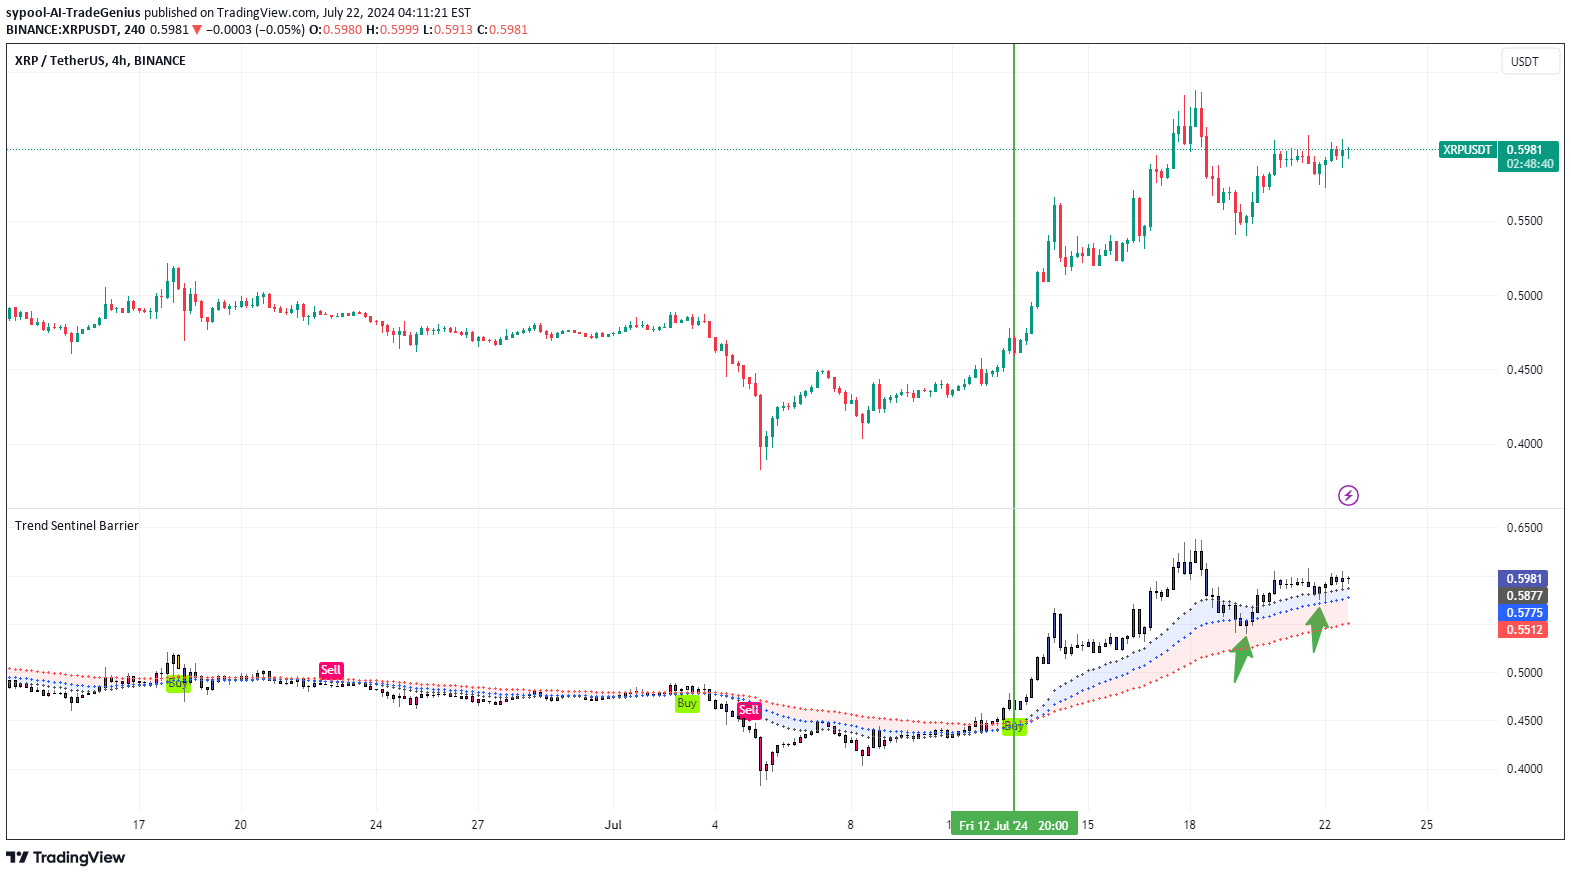
XRP again. In our report last week, we mentioned that XRP is in the bullish trend and pull back to the wavy area, and the bulls will increase. Unsurprisingly, XRP started to rebound just after we published the idea. Once again, XRP hit the upper rail of the wavy zone and bulls strengthened again. When you use the TSB indicator, it will give a BUY or SELL signal, which means that the token has entered a bullish or bearish trend. The three rails in the wavy area are important support or resistance levels, depending on the direction of your position. You can add positions at these prices and reduce costs. What’s more At the daily level, the TSB indicator also gives a BUY signal, which means that XRP has turned into a bullish trend at both the daily level and the 4h level. Use our indicators to earn profits at any level. Introduction to indicators: Trend Sentinel Barrier (TSB) is a trend indicator, using AI algorithm to calculate the cumulative trading volume of bulls and bears, identify trend direction and opportunities, and calculate short-term average cost in combination with changes of turnover ratio in multi-period trends, so as to grasp the profit from the trend more effectively without being cheated. KDMM (KD Momentum Matrix) is not only a momentum indicator, but also a short-term indicator. It divides the movement of the candle into long and short term trends, as well as bullish and bearish momentum. It identifies the points where the bullish and bearish momentum increases and weakens, and effectively capture profits. Disclaimer: Nothing in the script constitutes investment advice. The script objectively expounded the market situation and should not be construed as an offer to sell or an invitation to buy any cryptocurrencies. Any decisions made based on the information contained in the script are your sole responsibility. Any investments made or to be made shall be with your independent analyses based on your financial situation and objectives.

sypool-AI-TradeGenius
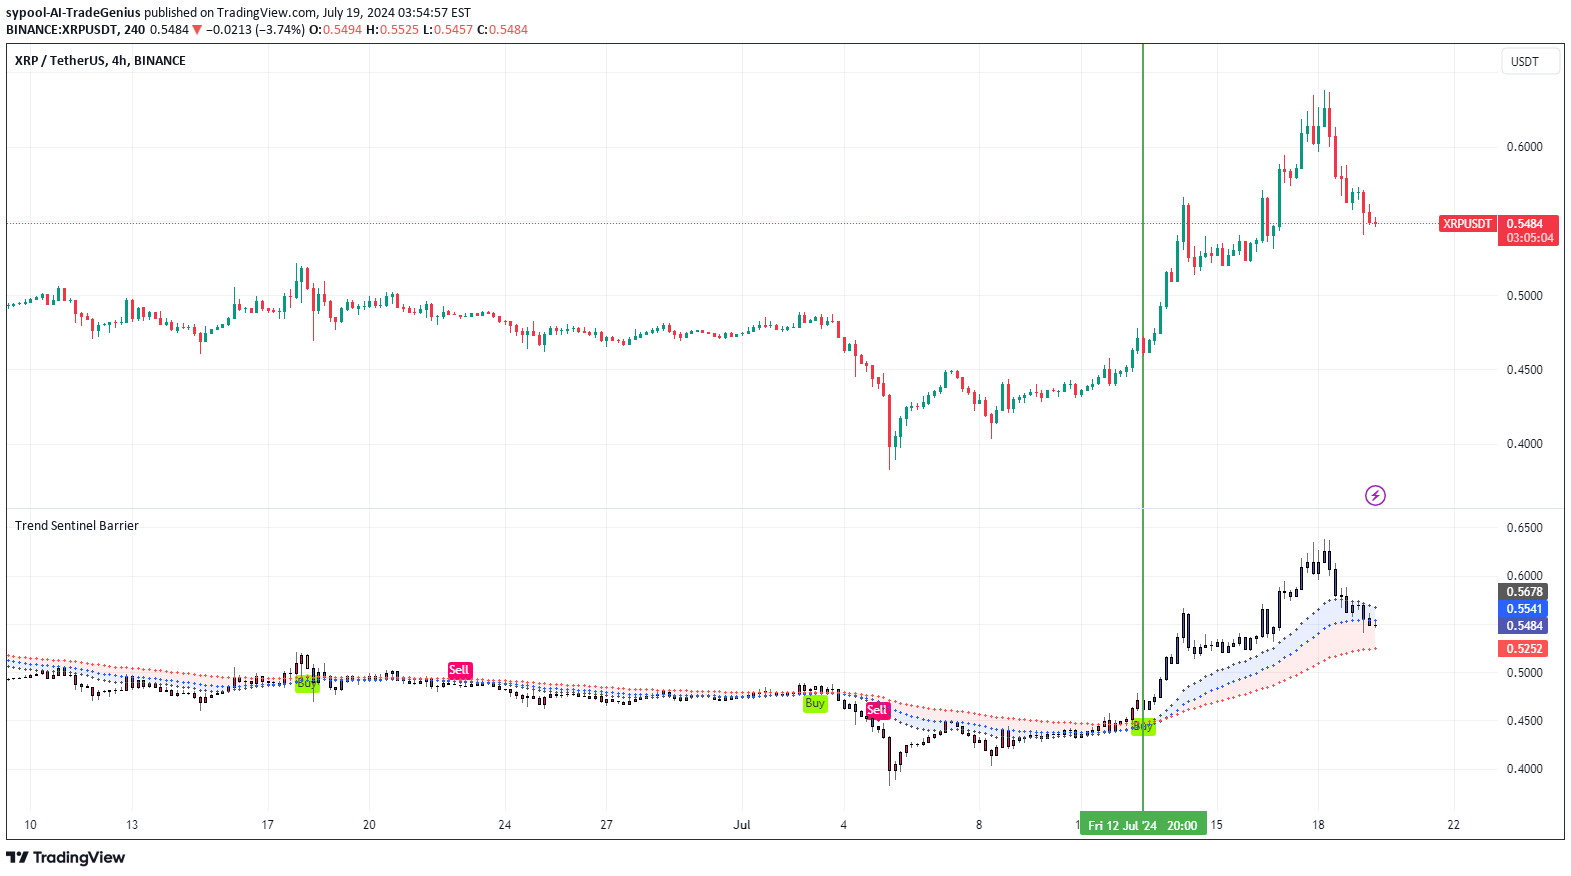
For cryptoers who are new to this bull market, Ripple is an unfamiliar project. More Rookie’s knowledge of Ripple is that Ripple and many regulatory agencies have lawsuits. But this project, which was born in 2012, has received favor from the traditional banking industry at the application layer. Among Grayscale’s trusts, apart from BTC and ETH, XRP has a seat. The recent Bank for international settlements recording XRP as secondary capital, like BTC, also showd Ripple's power. Ripple is an International remittance solution, which is the same as SWIFT. However, Ripple uses distributed ledgers to achieve secure and instant global financial transactions. Compared to projects growing in a complete ecosystem today, Ripple is more like an early blockchain innovation project relying on the real world. Even though Ripple is 12 years old, it is still functioning on an application level. The premature attention attracted regulators from the SEC. The protocols or CEXs of the same period were almost defeated by regulation or eliminated by the times. Ripple is a living fossil. Now, regulators are loosening the rope on the crypto market. The listing of the ETF and the dismissal of the lawsuit prove this. Ripple gets a chance to get off the ropes. At the same time, become a strong competitor for the next ETF. Next let’s look at the indicators. XRP is one of the few tokens with a BUY signal in the current environment. We can see that after the TSB indicator prompted a BUY signal on July 24, XRP had an obvious pump. It is now pulling back near the support line in the wavy zone. This will generate bullish power and is a suitable point to add to a position. Introduction to indicators: Trend Sentinel Barrier (TSB) is a trend indicator, using AI algorithm to calculate the cumulative trading volume of bulls and bears, identify trend direction and opportunities, and calculate short-term average cost in combination with changes of turnover ratio in multi-period trends, so as to grasp the profit from the trend more effectively without being cheated. KDMM (KD Momentum Matrix) is not only a momentum indicator, but also a short-term indicator. It divides the movement of the candle into long and short term trends, as well as bullish and bearish momentum. It identifies the points where the bullish and bearish momentum increases and weakens, and effectively capture profits. Disclaimer: Nothing in the script constitutes investment advice. The script objectively expounded the market situation and should not be construed as an offer to sell or an invitation to buy any cryptocurrencies. Any decisions made based on the information contained in the script are your sole responsibility. Any investments made or to be made shall be with your independent analyses based on your financial situation and objectives.

sypool-AI-TradeGenius
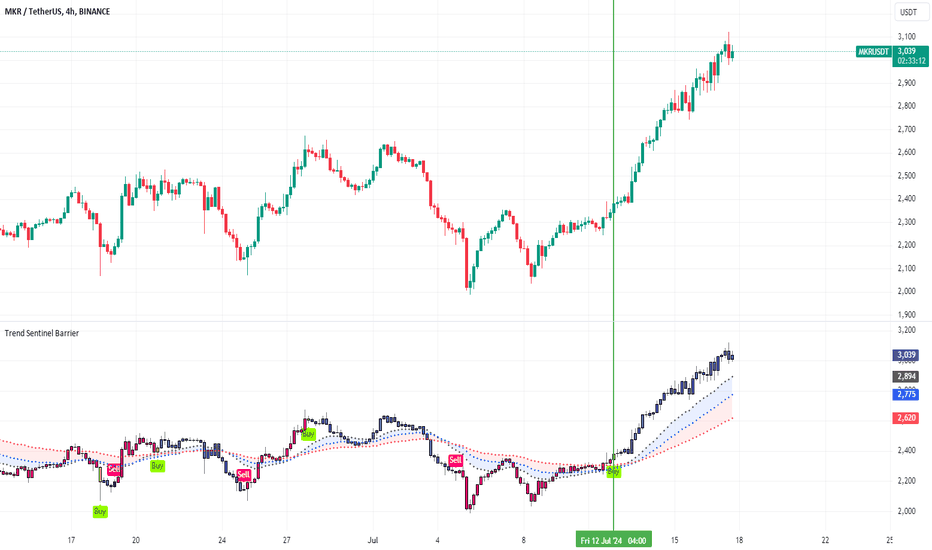
If you think we're still in a bull market and want to find a track for Alpha, then RWA must be the place with better soil and fertilizer. The near-listing of the ETH ETF and the impending easing of monetary policy will provide a large amount of funds for the crypto. These funds are mainly asset management companies and enterprises. They will look for compliance risk targets to increase their crypto positions. Apart from directly holding BTC and ETH, what I can think of is the RWA track. Probably in the last few weeks, you can see an increase in the number of news mentions about RWA on social media. Some asset management companies that issue BTC ETFs have begun to get involved with RWA. We mentioned the leading projects in the RWA track a few months ago, such as MKR and ONDO. But unlike at that time when they were fighting separately, today's RWA track is becoming more and more integrated as a whole. Today, let’s take another look at MKR. As one of the protocols with the highest revenue in the crypto market, MakerDAO received an impact from the challenger ONDO in 2024, and due to miscalculation and increased USDe positions, many DeFi protocols increased their vigilance towards DAI. This has also caused the price of MKR to enter a continuous decline since April. Aging and opposition do not lead to improvement. Recently, MakerDAO changed its original strategy and expressed its willingness to use US$1 billion in investment and US Treasury bond products from its treasury. The move attracted a number of RWA protocols, including BlackRock and original contender ONDO. The market interpreted this as MakerDAO’s strategy for ONDO changing from confrontation to complementarity. Benefiting from this, MKR prices have rebounded in recent days. After talking about the changes in fundamentals, let’s take a look at the reaction on the indicators. Earlier than MKR’s policy change, the TSB indicator prompted a BUY signal on July 11. After that, MKR started an upward trend and broke through the 4h-high of 2600. The current column is far away from the wavy area of the TSB indicator, and the bullish trend is healthy. Introduction to indicators: Trend Sentinel Barrier (TSB) is a trend indicator, using AI algorithm to calculate the cumulative trading volume of bulls and bears, identify trend direction and opportunities, and calculate short-term average cost in combination with changes of turnover ratio in multi-period trends, so as to grasp the profit from the trend more effectively without being cheated. KDMM (KD Momentum Matrix) is not only a momentum indicator, but also a short-term indicator. It divides the movement of the candle into long and short term trends, as well as bullish and bearish momentum. It identifies the points where the bullish and bearish momentum increases and weakens, and effectively capture profits. Disclaimer: Nothing in the script constitutes investment advice. The script objectively expounded the market situation and should not be construed as an offer to sell or an invitation to buy any cryptocurrencies. Any decisions made based on the information contained in the script are your sole responsibility. Any investments made or to be made shall be with your independent analyses based on your financial situation and objectives.

sypool-AI-TradeGenius
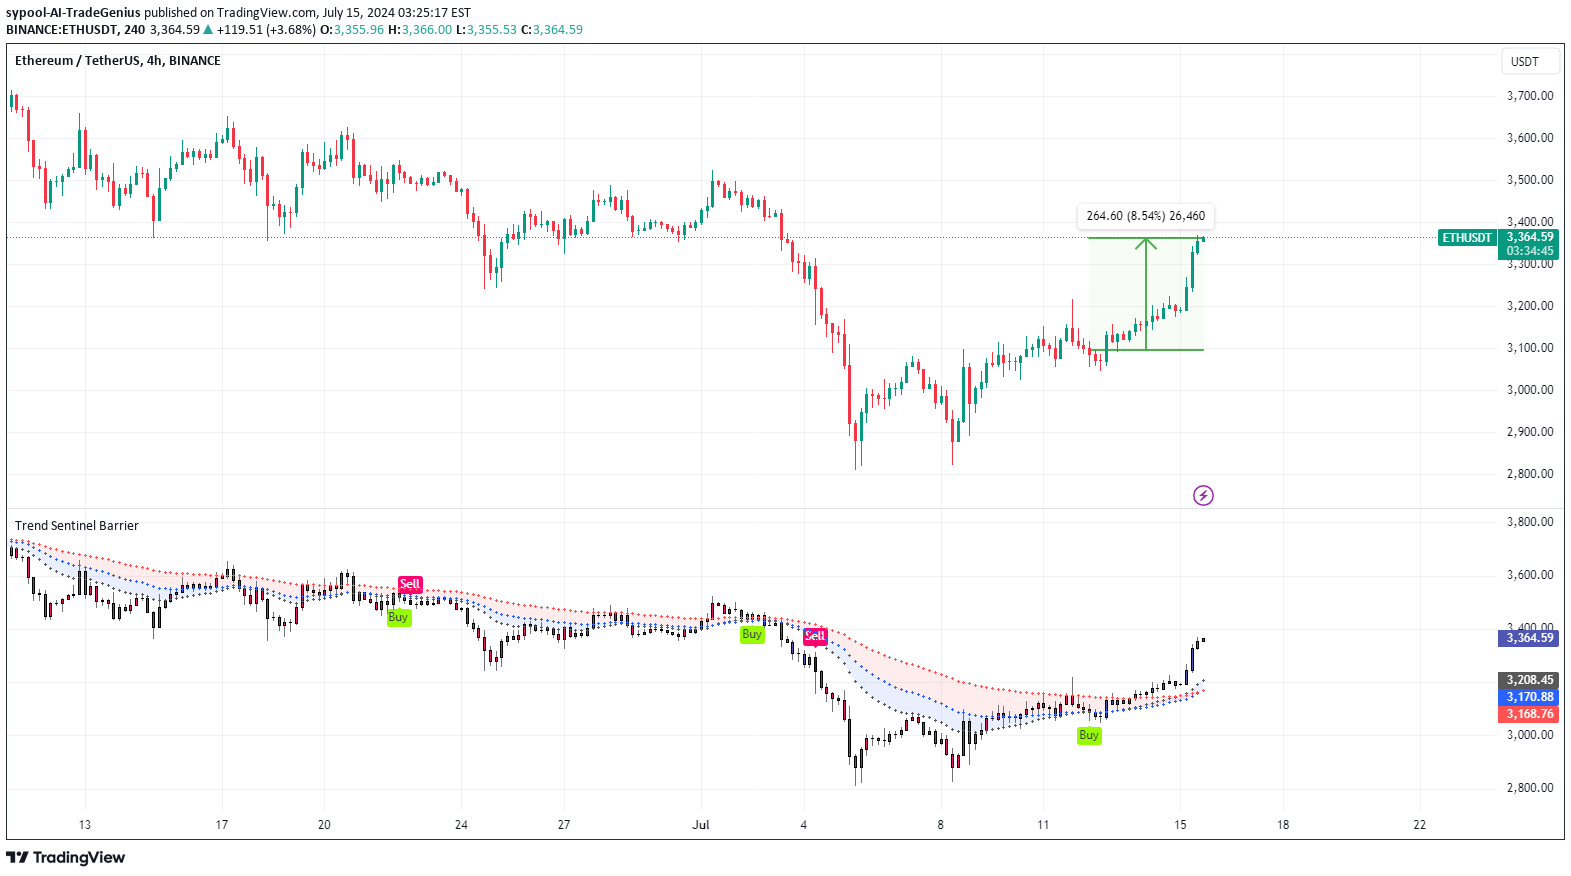
Same as we said last week. Although BTC and ETH did not react as strongly as gold when the CPI was announced. However, during the weekend when trading activity was relatively weak, both BTC and ETH rose and bulls have maintained so far. Excellent CPI has shown that the date for interest rate cuts is gradually approaching. Funds will gradually flow from the US dollar to risky assets. And the funds in the U.S. stock market may also face the risk of outflows because of its excellent performance in the past year. Traders will choose the riskier stock market. But cryptocurrencies will be one of its destination. If you are not a professional macro analyst, you may hesitate before the rise comes and miss the best trading opportunities. But it doesn’t matter, you can choose our TSB indicator. As mentioned in our report last Friday. The TSB indicator prompted a BUY signal on Friday and has risen by more than 8% without any leverage. Last but not least, we are on the way to a rate cut and the cryptocurrency has pulled back lower due to a series of FUD. Don't miss out any opportunities of open position because of indecision, hurry up and use our indicators. Introduction to indicators: Trend Sentinel Barrier (TSB) is a trend indicator, using AI algorithm to calculate the cumulative trading volume of bulls and bears, identify trend direction and opportunities, and calculate short-term average cost in combination with changes of turnover ratio in multi-period trends, so as to grasp the profit from the trend more effectively without being cheated. KDMM (KD Momentum Matrix) is not only a momentum indicator, but also a short-term indicator. It divides the movement of the candle into long and short term trends, as well as bullish and bearish momentum. It identifies the points where the bullish and bearish momentum increases and weakens, and effectively capture profits. Disclaimer: Nothing in the script constitutes investment advice. The script objectively expounded the market situation and should not be construed as an offer to sell or an invitation to buy any cryptocurrencies. Any decisions made based on the information contained in the script are your sole responsibility. Any investments made or to be made shall be with your independent analyses based on your financial situation and objectives.

sypool-AI-TradeGenius
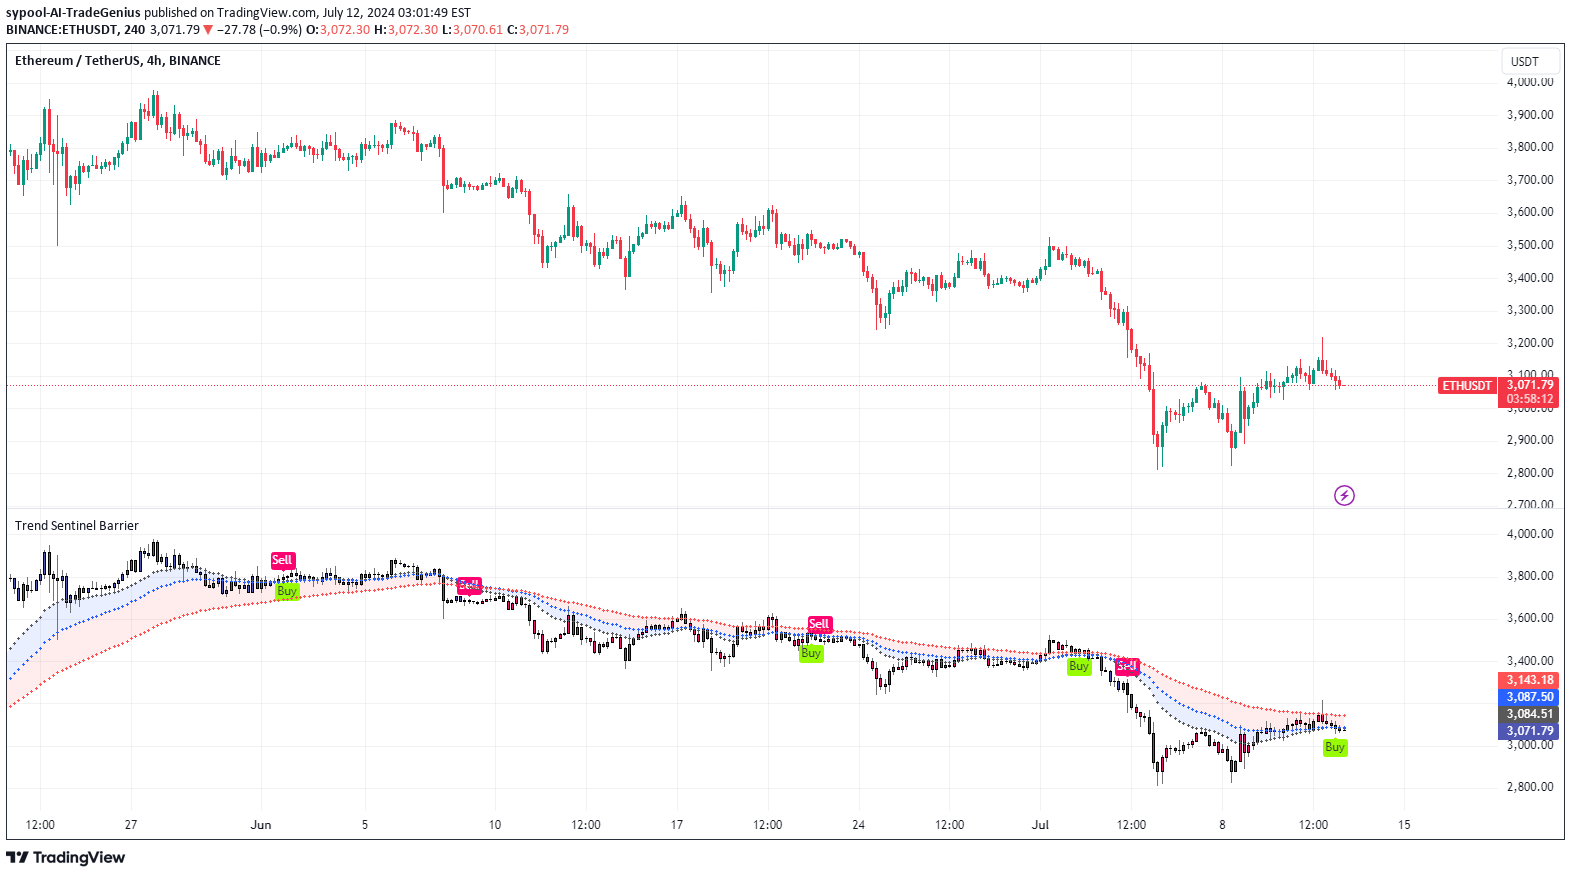
Yesterday, the U.S. CPI for June was released, showing that inflation has eased far beyond expectations. Gold rose, but US stocks and BTC fell. After Powell's dovish remarks, the improvement in CPI can be regarded as a turning point in macro policy. As we often say, we are on the way to a rate cut. We do not believe that the decline in US stocks and BTC demonstrates sell the news. We believe that funds flowing out of US stocks will flow to BTC and the stock markets of developing countries. BTC did not show strength at when the CPI was released because of the lack of funds. After funds flow into the market, BTC will have a pump, and the funds in the BTC ETF in the following days will prove this. Therefore, at current levels, it is a good opportunity to buy high-risk assets. Funds will flow out of U.S. stocks and try aggressive investments. Whether it’s BTC or developing country stocks. In terms of underlying selection, ETH is better than BTC. This is mainly because the ETH ETF approval date is getting closer. From the perspective of entry point, the current TSB indicator gives a BUY signal at the 4h level, which is a suitable position. The TSB indicator has successfully captured gains from declines and rallies many times over the past month. Introduction to indicators: Trend Sentinel Barrier (TSB) is a trend indicator, using AI algorithm to calculate the cumulative trading volume of bulls and bears, identify trend direction and opportunities, and calculate short-term average cost in combination with changes of turnover ratio in multi-period trends, so as to grasp the profit from the trend more effectively without being cheated. KDMM (KD Momentum Matrix) is not only a momentum indicator, but also a short-term indicator. It divides the movement of the candle into long and short term trends, as well as bullish and bearish momentum. It identifies the points where the bullish and bearish momentum increases and weakens, and effectively capture profits. Disclaimer: Nothing in the script constitutes investment advice. The script objectively expounded the market situation and should not be construed as an offer to sell or an invitation to buy any cryptocurrencies. Any decisions made based on the information contained in the script are your sole responsibility. Any investments made or to be made shall be with your independent analyses based on your financial situation and objectives.
Disclaimer
Any content and materials included in Sahmeto's website and official communication channels are a compilation of personal opinions and analyses and are not binding. They do not constitute any recommendation for buying, selling, entering or exiting the stock market and cryptocurrency market. Also, all news and analyses included in the website and channels are merely republished information from official and unofficial domestic and foreign sources, and it is obvious that users of the said content are responsible for following up and ensuring the authenticity and accuracy of the materials. Therefore, while disclaiming responsibility, it is declared that the responsibility for any decision-making, action, and potential profit and loss in the capital market and cryptocurrency market lies with the trader.