
srdrkrnfl
@t_srdrkrnfl

What symbols does the trader recommend buying?
Purchase History
پیام های تریدر
Filter
Signal Type

#FET It is seen that the sales pressure on the Bearish OB region is continuing on the daily graph. If this liquidation zone is broken, the price may want to test 0.75s again. Currently, the price is squeezed between the support in the 0.60 zone. The falling trend works as a support at this point in the middle channel band. But it gives the impression of a volumeless support. If the price is made below 0.60, it is likely to pull it between 0.50, 0.48 bands, or maybe a needle for 0.45s, so that it can withdraw to these areas. Reaction can be expected from these regions. If the price will make closes below 0.40, the trend is broken. (Dated 31.08.2025 X my comment at) Note: My comments are not a grade and are not an investment advice.
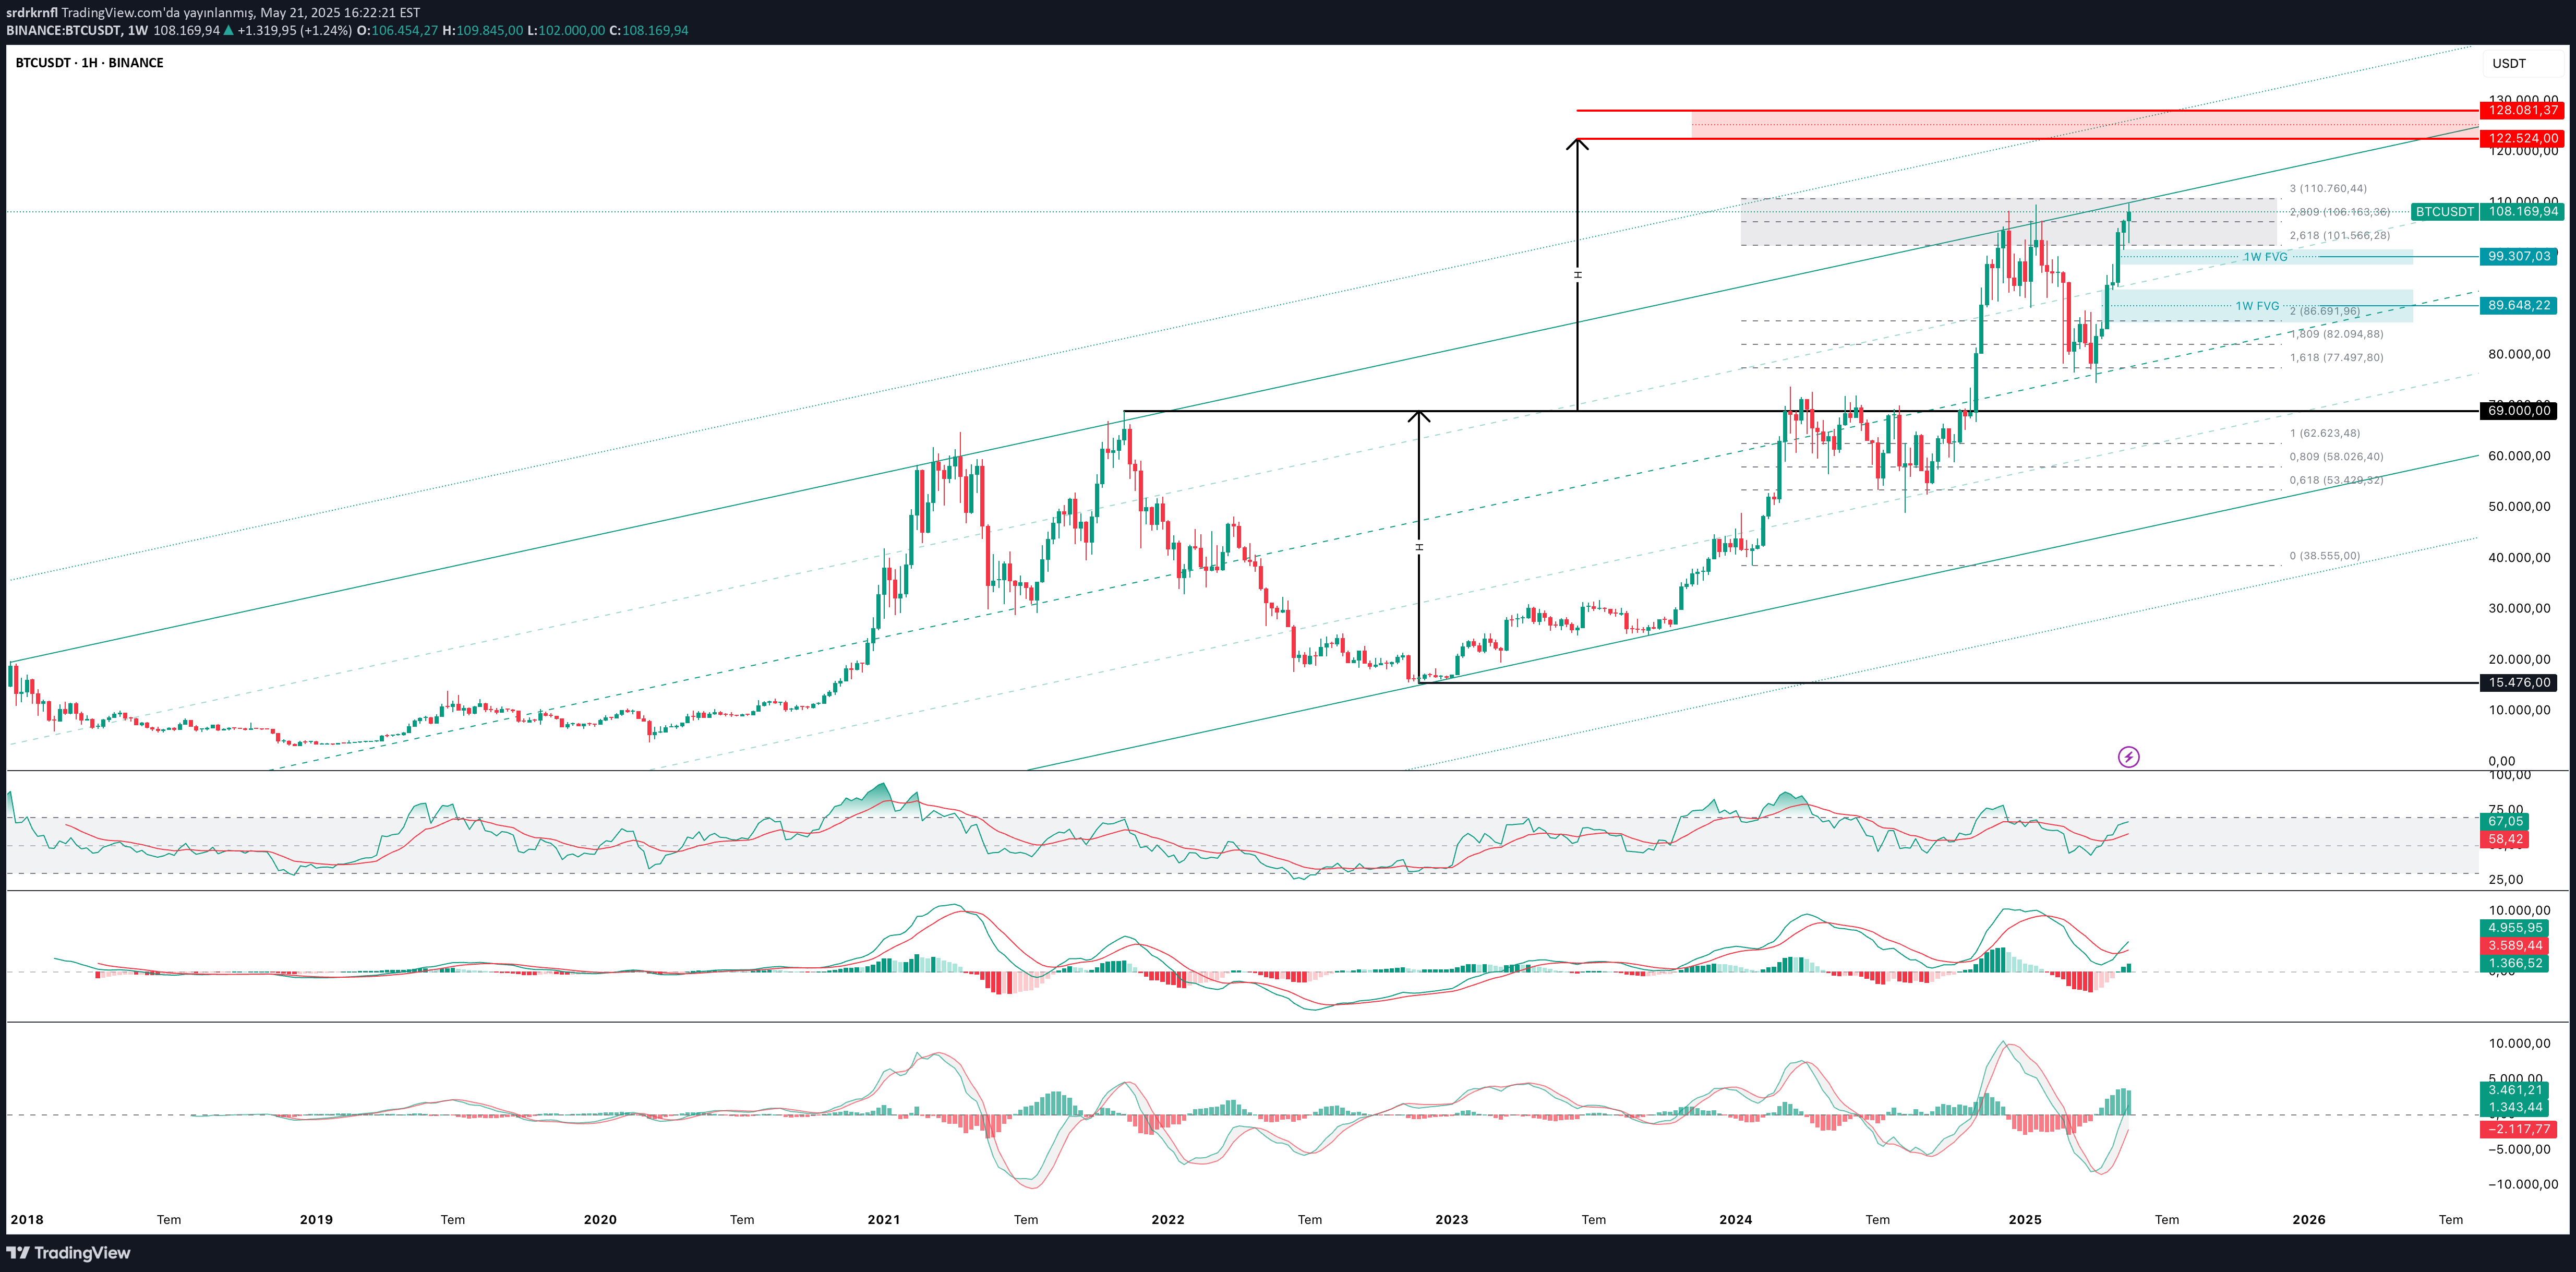
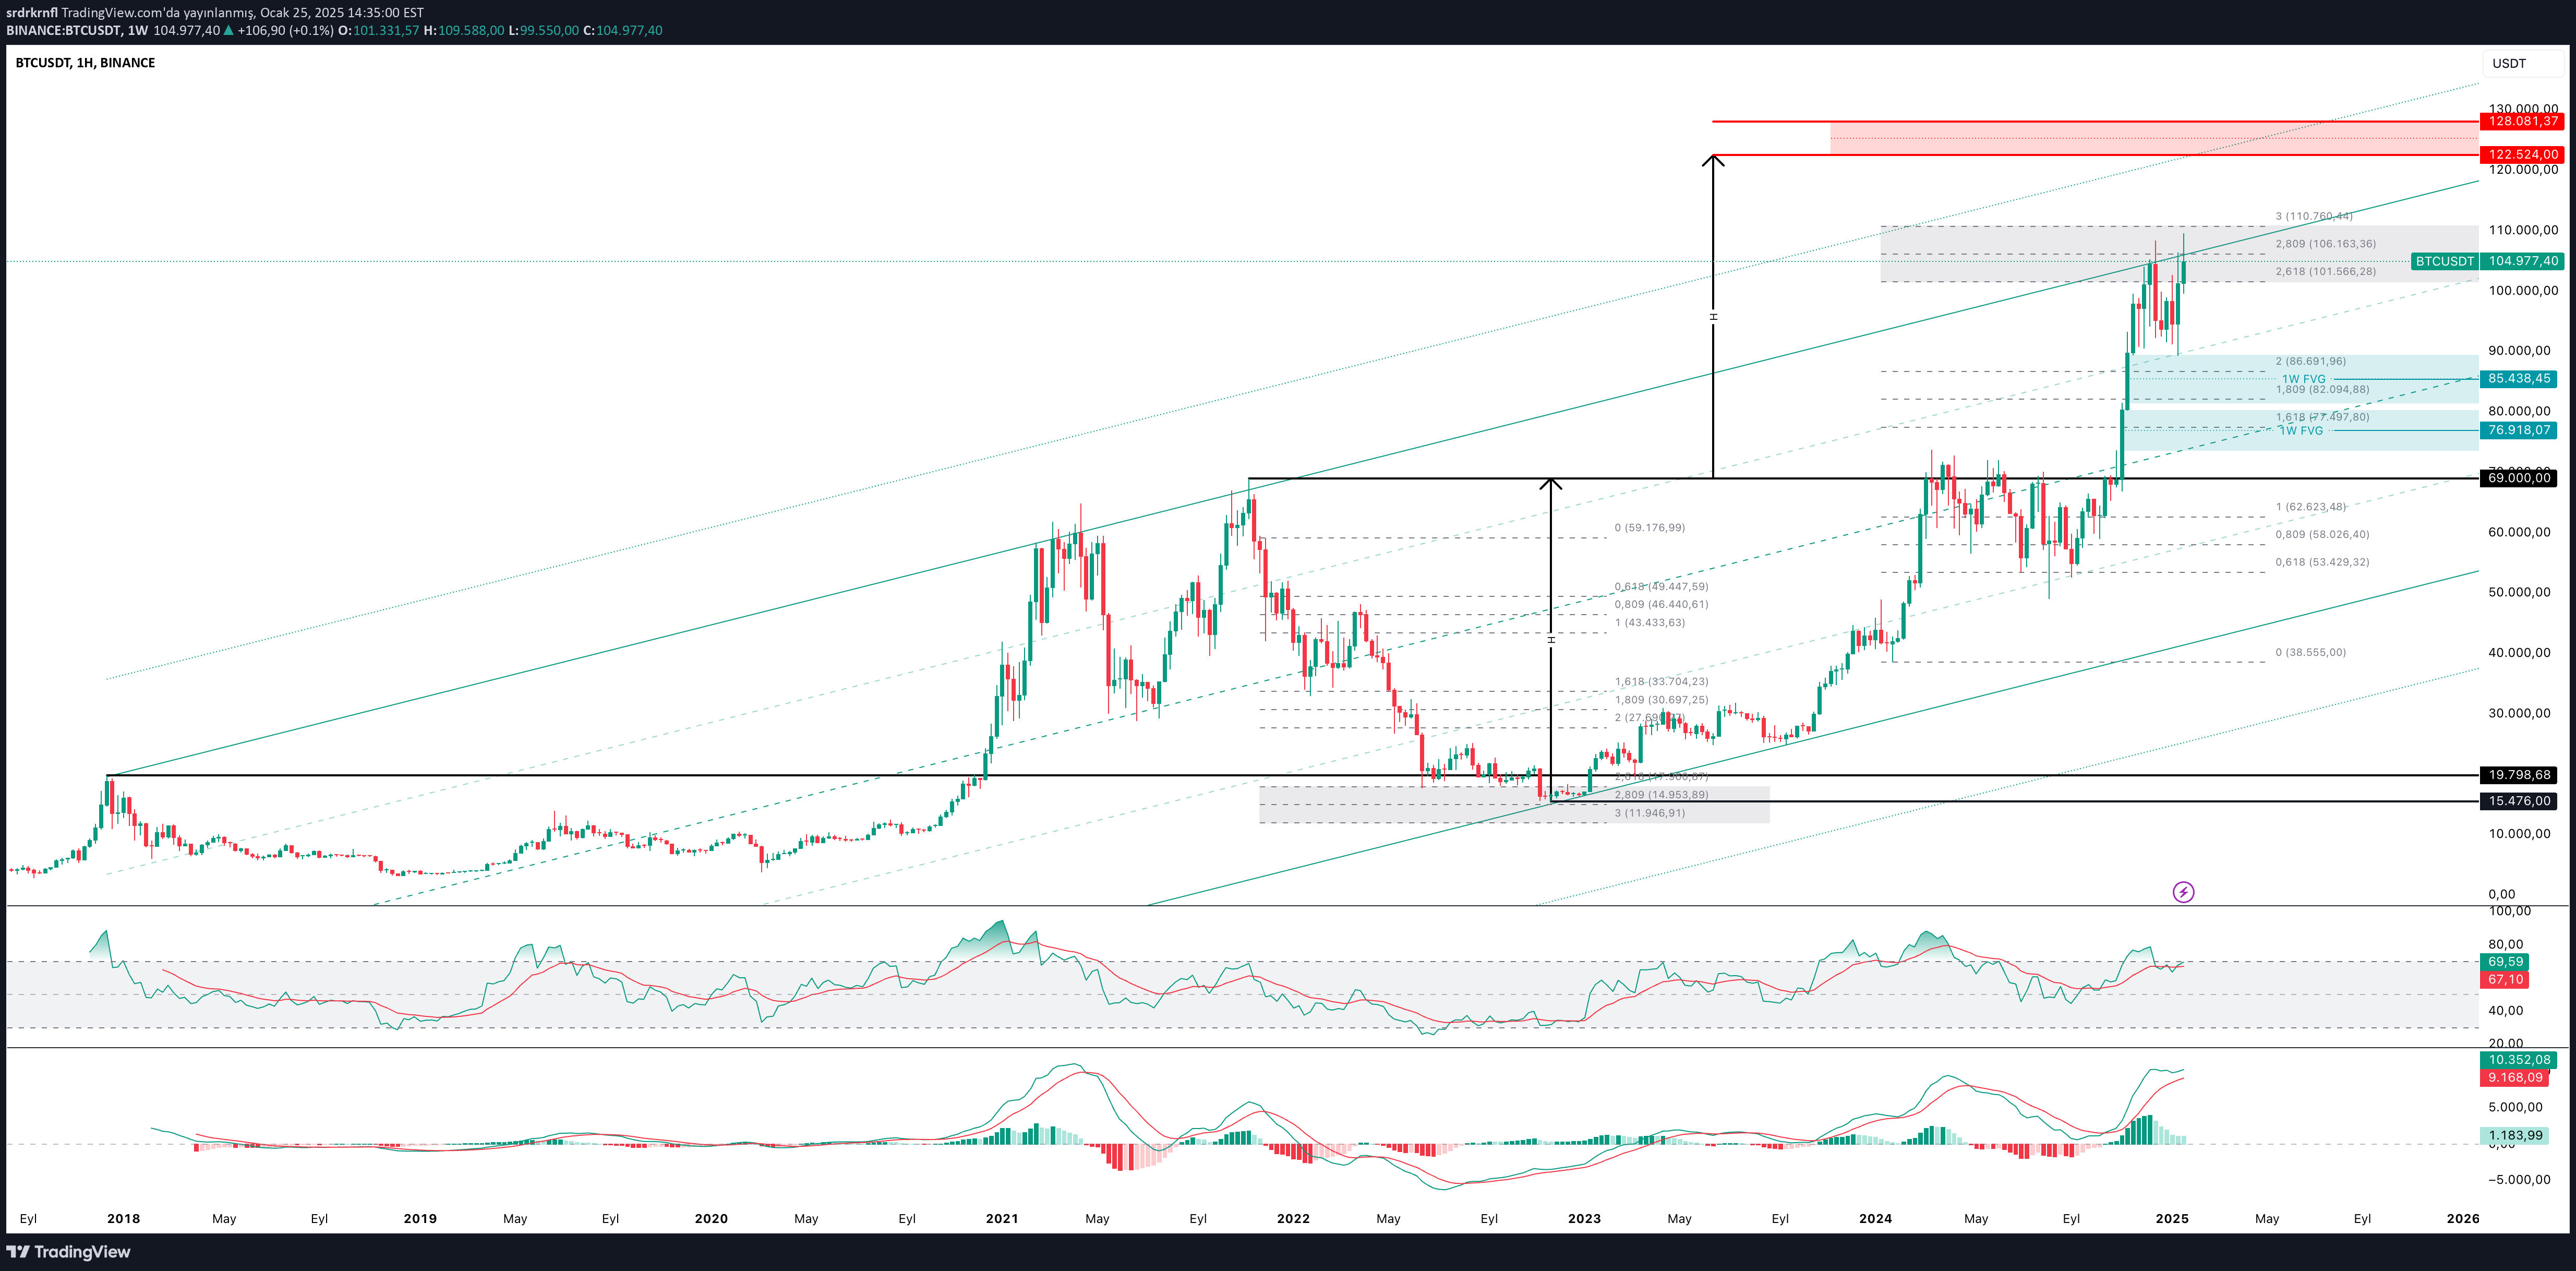
در تاریخ ۰۵/۱۱/۱۴۰۳ (معادل ۲۵.۰۱.۲۰۲۵) اشاره کردم که اگر #BTC نتواند در محدوده ۱۰۶ هزار (106k) بالای مقاومت تثبیت شود، احتمالاً به سمت مناطق صعودی FVG عقبنشینی کرد. در نهایت، شاهد عقبنشینی تا ۷۴.۵ هزار (74.5k) بودیم و پس از تماس با خط میانی کانال و دریافت حمایت، روند صعودی آغاز شد. برای دیدن متن کامل آن تحلیل، میتوانید آن را با عنوان "نمودار هفتگی بیتکوین در تاریخ ۰۵/۱۱/۱۴۰۳ (معادل 25.01.2025)" پیدا کنید. #بیتکوین در هفتههای اخیر با اخبار مثبت، شتاب گرفته و مجدداً در حال آزمایش مقاومت کانال است. اگر بتواند مقاومت کانال صعودی را شکسته و بالای ۱۱۰.۷ هزار (110.7k) تثبیت شود، ممکن است بخواهد ۱۲۲.۵ هزار (122.5k) را آزمایش کند. در غیر این صورت، مجدداً شاهد عقبنشینی به سمت مناطق صعودی FVG بود. اولین منطقه صعودی FVG در قیمت ۹۹.۳ هزار (99.3k) و دومین منطقه صعودی FVG در قیمت ۸۹.۶ هزار (89.6k) قرار دارد. در اینجا نباید این نکته را از قلم انداخت که اگر قیمت نتواند از دومین منطقه صعودی FVG واکنش مورد نظر را دریافت کند و خط میانی کانال را نیز بشکند، شرایط ممکن است تغییر کند و قیمت تا محدوده ۵۳ تا ۶۰ هزار (53k - 60k) عقبنشینی کند. این موضوع نیز در بازه زمانی میانگین هفتگی، با حمایت کانال مطابقت دارد. توجه: تحلیلهای من صرفاً یادداشتی برای خودم بوده و توصیه سرمایهگذاری نیست.
#Bitcoin has been testing the resistance of the ascending channel in recent weeks. If it can break the resistance of the ascending channel and hold above 110.7k, it may want to test 122.5k. If it cannot break and closes below 101.5k, this time a double top may work and a pullback towards FVG areas may be in question. On average, the 1st FVG bullish zone is between 86.7k - 85.4k, while the 2nd FVG bullish zone is between 77.4k - 76.9k. "Don't worry about what the market will do, but what you will do against what the market will do." - Michael CarrNote: My comments are notes to myself and are not Investment Advice.
Disclaimer
Any content and materials included in Sahmeto's website and official communication channels are a compilation of personal opinions and analyses and are not binding. They do not constitute any recommendation for buying, selling, entering or exiting the stock market and cryptocurrency market. Also, all news and analyses included in the website and channels are merely republished information from official and unofficial domestic and foreign sources, and it is obvious that users of the said content are responsible for following up and ensuring the authenticity and accuracy of the materials. Therefore, while disclaiming responsibility, it is declared that the responsibility for any decision-making, action, and potential profit and loss in the capital market and cryptocurrency market lies with the trader.