
sohaibfx
@t_sohaibfx

What symbols does the trader recommend buying?
Purchase History
پیام های تریدر
Filter
sohaibfx
Bitcoin will reach $180,000 this year

Bitcoin’s trajectory is unstoppable—analysts are calling for a climb to $180,000, fueled by institutional adoption, limited supply, and global economic uncertainty. With halving cycles tightening the squeeze and mainstream acceptance soaring, BTC isn’t just a store of value—it’s the financial revolution we’ve been waiting for. Buckle up, the bull run’s coming.Running at $83,500
sohaibfx
Cronos is on the move, Could we see it hit $1 soon?

The chart is a weekly candlestick chart of CRONOS (CRO) against USD on TradingView, showing price action from late 2023 to a projected point in 2025. Let’s break down the key elements:Price Movement and Trend:CRONOS experienced a notable peak around mid-2024, reaching approximately $0.24000, followed by a sharp decline.After the peak, the price entered a downtrend, forming a descending triangle pattern, which is typically bearish but can lead to a breakout in either direction.The price has since stabilized in an "Accumulation Zone" between $0.07197 and $0.08925, with the current price at $0.08925 as of April 1, 2025.Descending Triangle Pattern:The descending triangle is defined by a downward-sloping resistance line (yellow) and a horizontal support line around $0.08925.This pattern often signals a potential breakout. A break above the resistance could indicate a bullish reversal, while a break below support might lead to further downside.The resistance line is currently around $0.13000 to $0.15000, based on the slope.Accumulation Zone:The price is in an "Accumulation Zone" between $0.07197 and $0.08925, suggesting that buyers are holding this level and potentially accumulating positions.Multiple tests of this support level indicate strong buying interest, which could set the stage for a breakout if bullish momentum builds.Target Projection (TG 1S):The chart projects a target labeled "TG 1S" at $0.42000, a significant increase from the current price.This target is likely based on the height of the descending triangle pattern added to the breakout point, a common technical analysis method.However, reaching $1 (as requested) would require a much larger move, approximately an 11x increase from the current price of $0.08925.Support and Resistance Levels:Key support is at $0.07197, with the current price at $0.08925.Resistance from the descending triangle is around $0.13000 to $0.15000, with a previous high at $0.17018.A break above $0.17018 could open the door to higher levels, but reaching $1 would require sustained momentum and likely strong fundamental catalysts.Historical Context and Feasibility of $1:CRONOS reached an all-time high of around $0.96 in November 2021 during a crypto bull market, so $1 is within historical precedent.However, the current market environment (as of April 2025) would need to see significant bullish momentum, possibly driven by broader crypto market trends, adoption of the Cronos ecosystem, or major developments in the Crypto.com platform (which CRONOS is tied to).The $0.42000 target is a more immediate goal, but $1 would require an extraordinary rally, likely over a longer timeframe.Timeframe:The chart extends into mid-2025, and the $0.42000 target appears to be a medium-term projection.Reaching $1 might take longer, potentially into late 2025 or beyond, depending on market conditions.
sohaibfx
Bitcoin Breakout Confirmed, Aiming for $160K

Chart Analysis:Bitcoin has just confirmed a major breakout above a key resistance zone, signaling a strong bullish continuation. Let’s dive into the details:1.Ascending Triangle Breakout: BTCUSD had been consolidating within an ascending triangle pattern since late 2024, with the upper resistance around $80,000 and a rising support trendline (highlighted in yellow). The breakout above $80,000 on strong volume confirms the bullish pattern, which is typically a precursor to significant upward moves.2. Accumulation Zone: Before the breakout, Bitcoin spent several months in an accumulation zone between $53,837 and $80,000. This phase allowed buyers to build positions, setting the foundation for the current rally.3.Price Targets: The measured move of the ascending triangle (height of the pattern) projects a target around $160,000. The height of the triangle is approximately $26,163 (from the base at $53,837 to the resistance at $80,000). Adding this to the breakout point ($80,000 + $26,163) gives a target of ~$106,163. However, considering Bitcoin’s historical tendency to overshoot during bull runs and the psychological significance of $160,000 (as noted on the chart), this level seems like a realistic target.4. Support Levels: The previous resistance at $80,000 now acts as strong support. If BTC pulls back, this level should hold to maintain the bullish structure. Additional support lies around $70,000, aligning with the lower boundary of the recent consolidation range.5. Momentum Indicators: While the chart doesn’t display specific indicators like RSI or MACD, the sharp upward move suggests strong momentum. Traders should monitor for overbought conditions on RSI (above 70) as BTC approaches higher levels, which could indicate a potential pullback.Trade Idea:Entry: Current price around $84,599.61 (post-breakout confirmation). Stop Loss: Below $78,000 (to account for minor pullbacks while staying above the breakout zone). Take Profit: $160,000 (primary target based on the pattern projection and psychological level). Risk/Reward Ratio: Approximately 1:12, making this a high-probability setup.Key Levels to Watch:Resistance: $100,000 (psychological), $120,000, $160,000 (target). Support: $80,000 (new support), $70,000 (secondary support).Market Context:Bitcoin’s breakout aligns with a broader crypto market uptrend, potentially fueled by positive fundamentals such as institutional adoption, favorable regulatory developments, or macroeconomic factors like inflation concerns driving demand for BTC as a store of value. Ethereum’s recent breakout (as seen in similar charts) also supports the bullish sentiment across the crypto market.Conclusion:BTCUSD has broken out of a multi-month consolidation pattern, confirming a bullish trend with a target of $160,000. The $80,000 level should now act as strong support, and any pullbacks to this zone could offer additional buying opportunities. Stay cautious of overbought conditions as BTC approaches higher resistance levels. Let’s see how far this rally can go!
sohaibfx
Ethereum Major Breakout Confirmed, Targeting $7800

Ethereum has just confirmed a major breakout above a critical resistance zone, signaling a strong bullish continuation. Here's the detailed breakdown:1.Ascending Triangle Breakout: ETHUSD had been consolidating within an ascending triangle pattern since late 2024, with the upper resistance around $4000 and a rising support trendline (highlighted in yellow). The breakout above $4000 on high volume confirms the bullish pattern, often a precursor to significant upward moves.2. Accumulation Zone: Prior to the breakout, ETH spent several months in an accumulation zone between $2000 and $4000. This phase allowed buyers to build positions, setting the stage for the current rally.3. Price Targets: The measured move of the ascending triangle (height of the pattern) projects a target around $7800. This is calculated by taking the height of the triangle (from the base at $2000 to the resistance at $4000, which is $2000) and adding it to the breakout point ($4000 + $2000 = $6000). However, considering the momentum and historical price action, the next psychological level at $7800 seems achievable.4. Support Levels: The previous resistance at $4000 now acts as strong support. If ETH pulls back, this level should hold to maintain the bullish structure. Additional support lies around $3000, aligning with the 50-day moving average (not shown but inferred from typical setups).5. Momentum Indicators: While the chart doesn’t display specific indicators like RSI or MACD, the sharp upward move suggests strong momentum. Traders should watch for overbought conditions on RSI (above 70) as ETH approaches higher levels, which could signal a potential pullback.
sohaibfx
Ethereum will make a major Breakout

analysis the chartLet’s analyze the provided Ethereum (ETH/USD) chart on a daily timeframe from TradingView, focusing on the key technical elements and trends:1. Overall TrendThe chart displays a significant bullish trend for Ethereum, with the price rising from around $2,200 in early 2024 to approximately $4,000 as of the latest data point (March 18, 2025).The upward movement is marked by a sharp breakout, indicating a strong shift in momentum from consolidation to a rapid ascent.2. Price Levels and TargetsCurrent Price: Approximately $4,000, with a previous support/resistance zone around $2,200.The chart highlights a major breakout above the descending triangle pattern, suggesting potential for further upside, though no specific price target is explicitly labeled beyond the current level.3. Technical PatternsDescending Triangle: The chart features a descending triangle pattern, typically considered a bearish continuation pattern. However, the recent price action has broken out upward through the upper resistance line (around $2,200-$2,500), invalidating the bearish outlook and turning it into a bullish reversal signal.Accumulation Phase: A clear accumulation zone is marked near the lower boundary of the triangle (around $2,200), where the price consolidated before the breakout. This suggests strong buying interest built up at this level, supporting the subsequent rally.4. Support and ResistanceSupport: The $2,200 level, which acted as the lower boundary of the triangle, now serves as a potential support zone if the price pulls back. This level could be retested as new support following the breakout.Resistance: The next resistance is not explicitly marked, but the rapid upward move suggests the price may face selling pressure around previous highs (e.g., $4,500-$5,000) or psychological levels like $5,000, based on Ethereum’s historical behavior.5. Volume and MomentumVolume data isn’t shown, but the steep upward slope post-breakout indicates significant buying pressure and momentum. A breakout with high volume would further confirm the strength of this move.6. Timeframe and ProjectionThe chart spans from late 2023 to mid-2025, with the major breakout occurring around early 2025. The sharp rise suggests this bullish momentum could continue in the short to medium term, potentially pushing Ethereum toward new all-time highs (above $4,800, its previous peak).7. Key ObservationsThe upward breakout from the descending triangle is a powerful bullish signal, often indicating a reversal of prior bearish pressure and the start of a new uptrend.The accumulation phase near $2,200 reflects a period where buyers absorbed selling pressure, setting the stage for the breakout.Potential risks include a pullback to retest the broken resistance (now support) at $2,200-$2,500, or overextension if the rally lacks consolidation. Monitoring for overbought conditions (e.g., via RSI or other indicators) could be prudent.2000$
sohaibfx
Bitcoin's epic journey to $160K

1. Overall TrendThe chart shows a long-term bullish trend for Bitcoin, with the price rising significantly from around $50,000 in early 2023 to approximately $123,130 as of the latest data point (March 18, 2025).The upward movement is characterized by a series of higher highs and higher lows, indicating strong bullish momentum.2. Price Levels and TargetsThe chart highlights a projected target of $160,000, labeled as "Reaching at 160K." This suggests the analyst anticipates a potential breakout or continuation of the current uptrend to this level.Current price: Approximately $123,130, with previous support/resistance zones marked at $77,917 and $56,707. These levels likely represent significant historical support where accumulation occurred.3. Technical PatternsAscending Triangle: The chart features an ascending triangle pattern, a bullish continuation pattern. The upper resistance line slopes downward slightly, while the lower support line slopes upward, converging toward a breakout point. The recent price action appears to have broken above this triangle, supporting the bullish outlook.Accumulation Phases: Two distinct accumulation zones are marked:The first accumulation phase is around the $56,707 - $77,917 range, where the price consolidated before the initial breakout.The second accumulation phase is near the $100,000 - $120,000 range, followed by a sharp upward move toward the current price and the projected $160,000 target.4. Support and ResistanceSupport: The lower boundary of the ascending triangle and the accumulation zones (e.g., $77,917 and $56,707) act as potential support levels if the price pulls back.Resistance: The next major resistance is implied at $160,000, where the price may face selling pressure or consolidation before potentially moving higher.5. Volume and MomentumWhile volume data isn’t explicitly shown, the sharp upward move after the breakout from the triangle suggests increasing buying pressure and momentum, typical of a strong bullish trend.6. Timeframe and ProjectionThe chart spans from early 2023 to mid-2025, with the $160,000 target likely projected to be reached by mid-2025, aligning with the current trajectory and historical bullish cycles.
sohaibfx
Uniswap will reach 150$

Technical Analysis of Uniswap ChartOverall Trend and Structure:The chart shows a multi-phase trend: an initial upward move in mid-2024, a consolidation phase with lower highs and lower lows forming a descending pattern, and a sharp bullish breakout in early 2025 (around March 2025).The recent steep upward movement suggests strong buying pressure, potentially indicating a breakout from a corrective pattern (e.g., descending triangle or wedge).Key Trendlines and Levels:Descending Trendline: The orange descending trendline connects the lower highs during the consolidation phase, acting as resistance. The price breaking above this trendline in early 2025 is a bullish signal, suggesting the end of the corrective phase.Horizontal Support/Resistance: The orange horizontal line near the middle of the chart likely served as support during consolidation (possibly around $10–$12 on an adjusted scale). The breakout above this level reinforces bullish momentum.Recent Surge: The vertical orange line on the right indicates a rapid price increase, potentially pushing UNI from the $10–$12 range to $15–$20 (adjusted from the $16,000,000 mark on the y-axis, assuming a $0–$30 scale).Candlestick Patterns and Momentum:The candlesticks show volatility, with green candles dominating the recent surge, indicating strong bullish momentum. Red candles during consolidation suggest profit-taking or selling pressure that has now been overcome.The steepness of the rise suggests high volume or a catalyst (e.g., news, DeFi adoption, or Ethereum ecosystem developments), though volume data isn’t visible.Potential Technical Patterns:The chart resembles a descending triangle or wedge breakout. A descending triangle typically signals a bearish continuation, but an upward breakout (as seen here) can indicate a reversal to a bullish trend, especially if supported by volume.The breakout above the trendline suggests a potential target measured by the height of the triangle base (e.g., if the base is $5 wide, add $5 to the breakout point, targeting $20–$25).Support and Resistance Levels:Support: The broken trendline and horizontal line (now support) around $10–$12 are critical. A pullback to retest this level would be a common post-breakout behavior.Resistance: The next resistance might be at the recent high (e.g., $20) or a psychological level like $25, based on historical UNI peaks (e.g., its all-time high of $44.97 in May 2021).Overbought conditions could emerge if the rally continues unchecked, warranting caution.Market Context and Sentiment:Uniswap, as a leading DeFi protocol, benefits from Ethereum’s ecosystem growth, protocol upgrades (e.g., Uniswap v4 or Unichain), and increasing DeFi adoption. The recent surge might reflect such developments in early 2025.Web-based price predictions for March 2025 vary widely: averages range from $6.30 to $12.69, with highs up to $13.58–$25.75, suggesting the chart’s surge aligns with an optimistic scenario. Posts on X indicate mixed sentiment, with some noting bearish pressure earlier in March (-30% reported) but others highlighting bullish potential if demand zones hold.The chart’s bullish breakout contrasts with some bearish technical indicators (e.g., RSI oversold at 34.69 noted on X), suggesting a possible short-term correction after the rapid rise.Interpretation and OutlookBullish Case: The breakout above the descending trendline and horizontal support signals a strong bullish reversal. If momentum continues, UNI could target $20–$25 in the near term, supported by DeFi growth and market sentiment. A retest of $10–$12 as support would confirm the breakout’s validity.
sohaibfx
SEI will reach at 1.4$

Price Movement and Trend:The chart shows a significant upward movement starting around mid-2024, peaking at a high (likely around $1.14-$1.20 based on the vertical scale), followed by a sharp decline.After the peak, the price enters a consolidation phase with lower volatility, fluctuating around the "Accumulation zone" marked at approximately $0.196746.A recent upward trend is suggested, with the price appearing to approach or break above the $1.143922 level (labeled as "Target 1.4$"), indicating potential bullish momentum.Accumulation Zone:The "Accumulation zone" is identified around $0.196746, which seems to act as a support level where the price has stabilized after the decline. This zone likely represents a range where buyers have been accumulating the asset, potentially preparing for the next upward move.The prolonged consolidation in this range suggests a period of low selling pressure and possible buying interest.Target 1.4$:The chart highlights a target price of $1.4, with the current price nearing $1.143922. This suggests that the analyst or trader anticipates a potential rise to $1.4 if the current upward trend continues.The upward arrow and the proximity to this target indicate a bullish outlook, possibly driven by a breakout from the accumulation phase.Volume and Candlestick Patterns:While the chart doesn’t explicitly show volume bars, the candlestick patterns (green for bullish, red for bearish) indicate periods of buying and selling pressure. The recent green candles suggest increasing buying interest.The sharp drop after the peak and the subsequent consolidation could indicate profit-taking followed by a base-building phase.Timeframe and Context:The chart covers a period from mid-2024 to March 2025, with the current date being March 14, 2025. This long-term view suggests the analysis is focused on a medium-to-long-term trend rather than short-term fluctuations.The upward trajectory toward $1.4$ might be based on technical analysis (e.g., resistance levels, Fibonacci extensions, or historical price action), though specific indicators are not visible.Interpretation:The chart suggests that SEI/USDT has undergone a significant rally, followed by a correction and consolidation in the accumulation zone around $0.19-$0.20. The recent upward movement toward $1.14 indicates a potential breakout or continuation of an uptrend.The target of $1.4$ could represent a resistance level or a projected price based on the analyst’s strategy (e.g., a measured move from the accumulation range).Traders might interpret this as a buying opportunity if the price holds above the accumulation zone, with a stop-loss potentially set below $0.19, aiming for the $1.4 target.
sohaibfx
Bitcoin will reach $221,000

The chart explicitly labels a "Breakout" point around December 15, 2024, where the price moves above the $80,000 resistance level of the ascending triangle. This breakout is a significant technical event, suggesting strong buying pressure and a continuation of the uptrend. Following the breakout, the chart notes a "Retracement" phase, where the price pulls back to test the breakout level (now acting as support at approximately $80,000). This behavior is common in technical analysis, as prices often retest previous resistance levels after a breakout to confirm support.As of March 14, 2025, the current price of $80,228.30 is just above the $80,000 level, suggesting the price may be in the early stages of this retracement or has recently stabilized after testing the support. This positioning indicates potential buying opportunities for traders looking for entry points near this level, with expectations of further upward movement.Projected Price Target: $221,000One of the most notable annotations on the chart is the "TG $221,000" label, which stands for "Target Price" of $221,000. This target is projected based on the breakout from the ascending triangle, likely calculated by taking the height of the triangle (the difference between the resistance at $80,000 and the lowest support at $55,000, which is $25,000) and adding it to the breakout level ($80,000 + $25,000 = $105,000). However, the chart's projection to $221,000 suggests a more aggressive target, possibly involving a multiple of the height (e.g., 3x the height, $80,000 + $75,000 = $155,000, still not reaching $221,000) or a Fibonacci extension beyond standard calculations.Given the significant gap between the current price ($80,228.30) and the target ($221,000), this projection is an unexpected detail, implying a potential multi-fold increase in Bitcoin's value. It aligns with the chart's bullish patterns but involves considerable uncertainty, as market conditions, macroeconomic factors, and adoption rates could influence actual price movements.Additional Technical ObservationsBeyond the ascending channel and triangle, the chart includes several other technical elements:Support and Resistance Levels: The $80,000 level, initially a resistance during the triangle, becomes a key support level post-breakout. The lower trendline of the ascending channel also acts as dynamic support throughout the uptrend, providing a floor for price corrections.Volume Indicator (Implied): While not explicitly shown, breakouts like the one labeled are often accompanied by increased volume, which would confirm the strength of the move. Without a visible volume histogram, this remains an inference.Fibonacci Retracement (Potential): The retracement after the breakout could be analyzed using Fibonacci levels (e.g., 38.2%, 50%, 61.8%) to identify key support zones, though these are not drawn on the chart.Momentum and Moving Averages (Implied): Although not visible, momentum indicators like RSI or MACD could provide additional insights. For instance, a strong breakout might correlate with overbought RSI, while the retracement could indicate a return to neutral levels. Moving averages (e.g., 50-day, 200-day) might have supported the uptrend earlier, with the price potentially approaching these for support during retracements.Implications for TradersThe analysis suggests Bitcoin is in a robust bullish trend, supported by the ascending channel, triangle breakout, and projected target. Traders may consider the following strategies:Buy on Pullbacks: Look for buying opportunities near the $80,000 support level, especially if volume and other indicators confirm buying pressure.Target Setting: Use the projected target of $221,000 as a long-term goal, but be mindful of market volatility and external factors that could affect price.Risk Management: Given the significant gap to the target, set stop-loss levels below key support (e.g., below $80,000) to manage risk.
sohaibfx
XRP will explode in value
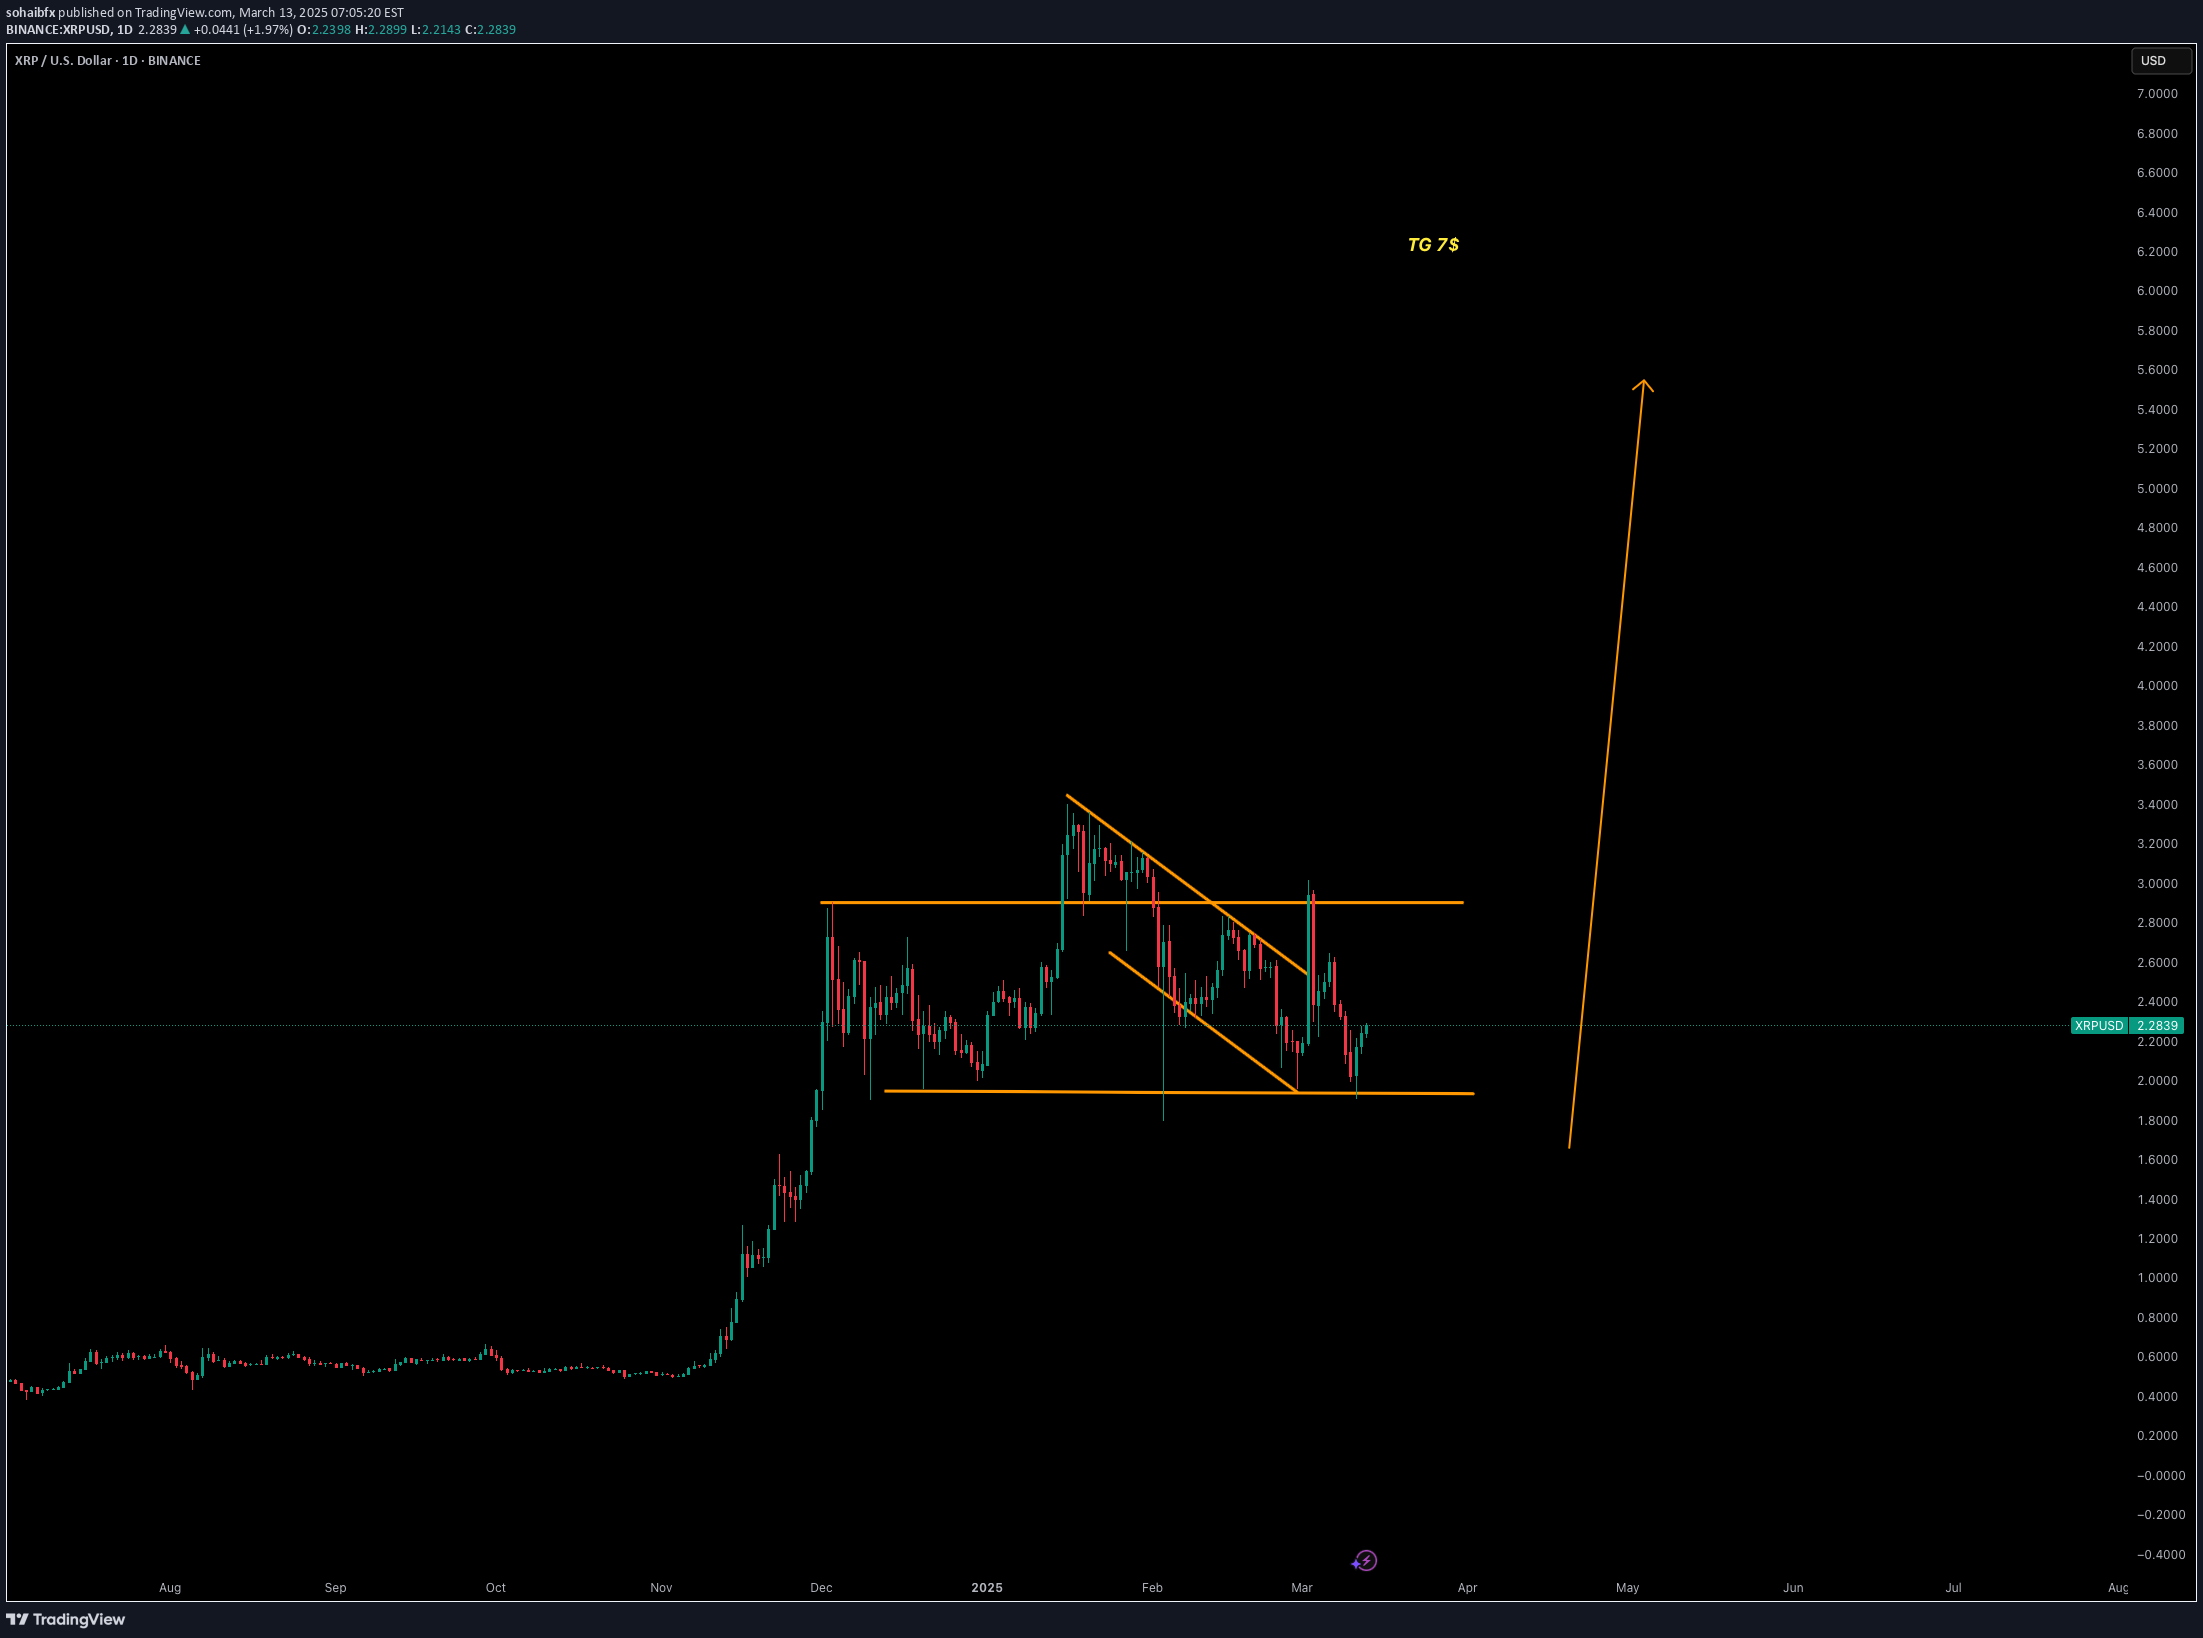
Price Movement and TrendsInitial Consolidation (August 2024 - November 2024):XRP starts the chart trading sideways around $0.50 to $0.60. This period shows low volatility with small candlesticks, indicating a lack of strong directional momentum. It suggests a consolidation phase where buyers and sellers were in balance.Breakout and Uptrend (Late November 2024 - January 2025):Around late November 2024, XRP breaks out of its consolidation with a sharp upward move. The price surges from $0.60 to a peak of around $4.00 by early January 2025, a massive increase of over 500% in a short period.This rally is characterized by large green candlesticks, indicating strong buying pressure. The consistent higher highs and higher lows confirm a strong bullish trend.Volume likely increased during this period (though volume bars aren’t visible), as such a significant price move typically requires high participation.Peak and Correction (January 2025 - February 2025):XRP reaches a high of approximately $4.00 in early January 2025, followed by a sharp correction. The price drops to around $2.50 by mid-February 2025, a decline of about 37.5% from the peak.This correction is marked by large red candlesticks, showing strong selling pressure. The drop suggests profit-taking by traders who entered during the earlier rally, possibly triggered by overbought conditions (though no RSI or similar indicators are visible to confirm this).Stabilization and Recovery Attempt (February 2025 - March 2025):After the correction, XRP stabilizes between $2.50 and $3.00. The price shows smaller candlesticks and some consolidation, indicating a pause in the downtrend.Toward early March 2025, XRP attempts a recovery, climbing back to $2.837 by March 13, 2025. The smaller green candlesticks in this phase suggest cautious buying, but the momentum isn’t as strong as the earlier rally.Key Levels and Support/ResistanceSupport: The $2.50 level acted as a support during the correction in February 2025. This level held multiple times, indicating buyers stepping in to defend it.Resistance: The $4.00 level was a significant resistance, as it marked the peak of the rally before the correction. If XRP attempts another upward move, this level may act as a barrier.Current Price: At $2.837, XRP is trading above the recent support but far below its January peak, suggesting it’s in a consolidation phase with potential for either direction.Technical ObservationsVolatility: The chart shows periods of both high and low volatility. The rally in November-December 2024 was highly volatile, while the consolidation phases (August-November 2024 and February-March 2025) show lower volatility.Trend: The overall trend from November 2024 to March 2025 is bullish, despite the correction. The price is still significantly higher than its starting point in August 2024.Candlestick Patterns: The large green candles during the rally and large red candles during the correction indicate strong momentum in both directions. The smaller candles in March 2025 suggest indecision in the market.Potential ScenariosBullish Case:If XRP breaks above $3.00 with strong volume, it could signal the start of another uptrend, potentially retesting the $4.00 resistance.A move above $4.00 could open the door for new all-time highs, especially if market sentiment for cryptocurrencies remains positive.
Disclaimer
Any content and materials included in Sahmeto's website and official communication channels are a compilation of personal opinions and analyses and are not binding. They do not constitute any recommendation for buying, selling, entering or exiting the stock market and cryptocurrency market. Also, all news and analyses included in the website and channels are merely republished information from official and unofficial domestic and foreign sources, and it is obvious that users of the said content are responsible for following up and ensuring the authenticity and accuracy of the materials. Therefore, while disclaiming responsibility, it is declared that the responsibility for any decision-making, action, and potential profit and loss in the capital market and cryptocurrency market lies with the trader.