
shoonya0000
@t_shoonya0000

What symbols does the trader recommend buying?
Purchase History
پیام های تریدر
Filter
Signal Type
shoonya0000
Current Price: $3,350.095 (Close: Friday, July 18th, 2025) UTC+4 Analysis Period : Next 24 Hours (July 21-22, 2025) UTC+4 Market Status: Weekend - Preparing for Monday Open 02:00AM 21st July 2025 EXECUTIVE SUMMARY - 24H OUTLOOK Primary Bias: Neutral to Bearish (Short-term) Key Resistance: $3,375 - $3,390 Critical Support: $3,285 - $3,300 Expected Range: $3,300 - $3,380 Volatility Level: Moderate to High CANDLESTICK PATTERN ANALYSIS Friday's Close Formation Pattern: Doji-like formation at resistance zone Significance: Indecision after testing $3,350+ levels Volume: Moderate - no strong conviction breakout Context: Failed to close decisively above $3,375 resistance Expected 24H Patterns Monday Gap: Potential gap down to $3,320-3,330 area Reversal Patterns: Watch for hammer/doji at support levels Continuation Signals: Break below $3,300 could trigger bearish continuation HARMONIC PATTERN ANALYSIS Current Harmonic Setup Primary Pattern: Potential Bearish Bat completing X: $3,285 (previous low) A: $3,390 (recent high) B: $3,320 (61.8% retracement) C: $3,375 (78.6% projection - current area) D (Target): $3,300-3,285 (88.6% completion zone) Fibonacci Levels (24H Focus) Golden Ratio Resistance: $3,375 (current test area) 61.8% Support: $3,320 78.6% Support: $3,300 88.6% Critical Support: $3,285 Pattern Completion Probabilities Bearish Bat Completion: 70% probability targeting $3,285-3,300 Bullish Cypher Setup: 30% if break above $3,390 ELLIOTT WAVE THEORY - 24H COUNT Primary Wave Count Macro Structure: Wave 5 of larger impulse possibly topping Current Sub-wave: Wave (c) of corrective structure Mini Count: 5-wave decline from $3,390 high in progress 24-Hour Wave Projection Wave 1: $3,390 → $3,320 (Completed) Wave 2: $3,320 → $3,360 (Completed - 50% retrace) Wave 3: $3,360 → $3,285 (In Progress - Target Area) Wave 4: $3,285 → $3,310 (Projected) Wave 5: $3,310 → $3,260 (Extended target) Critical Levels Wave 3 = 1.618 × Wave 1: $3,285 (Primary target) Invalidation: Above $3,390 (Wave 2 high) WYCKOFF THEORY - 24H PHASE Current Market Phase Phase Assessment: Distribution Phase C (Testing Supply) Composite Operator Action: Testing demand at $3,350 area Volume Analysis: Declining volume on recent rallies (bearish) Expected 24H Wyckoff Action Phase Transition: Moving toward Phase D (Markdown begins) Supply Test: Failed test at $3,375 confirms distribution Target: Initial markdown to $3,285-3,300 area Key Wyckoff Signals (24H) No Demand: Expected at current levels Selling Climax: Possible if break below $3,285 with high volume Automatic Rally: Dead cat bounce to $3,320-3,330 W.D. GANN THEORY - 24H ANALYSIS Square of Nine Analysis Current Position: 3350° on Gann wheel Next Cardinal Point: 3375° (90° angle - strong resistance) Support Angles: 3300° (natural support), 3285° (critical angle) Geometric Progression: $3,285 = perfect square root relationship Time Theory - 24H Cycle Natural Time Window: 24-hour cycle from Friday's high Critical Time: 14:00-16:00 UTC Monday (historical turning point) Lunar Influence: New moon phase approaching (bearish for commodities) Angle Theory 45° Line: Currently at $3,320 (rising support) 63.75° Line: $3,285 (steep support angle) 26.25° Line: $3,375 (resistance angle) Price Forecasting (Gann Methods) Primary Target: $3,285 (Square root of 81²) Secondary Target: $3,240 (Square root of 80²) Resistance: $3,375 (Square root of 82.5²) Time Forecasting Turn Time 1: 06:00 UTC Monday (18 hours from Friday close) Turn Time 2: 14:00 UTC Monday (26 hours from Friday close) Major Turn: 22:00 UTC Monday (34 hours - Fibonacci time) MULTI-TIMEFRAME INTRADAY ANALYSIS 5-Minute Chart Analysis Trend: Bearish momentum building Pattern: Lower highs, lower lows since Friday high Key Levels: Resistance: $3,360-3,365 Support: $3,330-3,335 RSI: Approaching oversold (35-40 range) Volume: Increasing on down moves 15-Minute Chart Analysis Structure: Bearish flag formation Breakdown Level: Below $3,340 Target: $3,300-3,310 (flag pole projection) Moving Averages: Price below EMA 20 ($3,358) MACD: Bearish crossover confirmed 30-Minute Chart Analysis Primary Trend: Corrective phase active Chart Pattern: Descending triangle Apex: Around $3,335-3,340 Breakout Direction: 65% probability downward Volume Profile: Heavy selling at $3,350-3,375 1-Hour Chart Analysis Major Structure: ABC correction in progress Current Position: C-wave development Fibonacci Target: $3,285 (127.2% extension) Bollinger Bands: Price touching lower band Stochastic: Oversold but no divergence yet 4-Hour Chart Analysis Macro Trend: Still bullish above $3,200 Correction Depth: 23.6% retracement maximum expected Support Zone: $3,280-3,300 (confluences) Resistance Zone: $3,375-3,390 (proven strong) Ichimoku: Price approaching cloud support TECHNICAL INDICATORS MATRIX Momentum Indicators RSI (4H): 42 (Neutral-Bearish) RSI (1H): 35 (Oversold approaching) Stochastic: %K: 28, %D: 35 (Oversold) Williams %R: -75 (Strong oversold) Trend Indicators MACD (4H): Bearish crossover pending ADX: 28 (Moderate trend strength) Parabolic SAR: $3,365 (Sell signal if broken) Volume Indicators OBV: Declining (distribution pattern) Volume Rate of Change: Negative Accumulation/Distribution: Slight distribution KEY SUPPORT & RESISTANCE LEVELS (24H) Immediate Resistance Levels R1: $3,365 (Previous support turned resistance) R2: $3,375 (Major psychological & Gann resistance) R3: $3,390 (Recent swing high) R4: $3,410 (Extended resistance) Critical Support Levels S1: $3,330 (Immediate support) S2: $3,300 (Psychological & Fibonacci) S3: $3,285 (Major harmonic & Gann target) S4: $3,260 (Extended support) 24-HOUR TRADING SCENARIOS Scenario 1: Bearish Breakdown (60% Probability) Trigger: Break below $3,330 with volume Target 1: $3,300-3,310 Target 2: $3,285-3,290 Extended Target: $3,260-3,270 Stop Loss (Shorts): Above $3,370 Scenario 2: Range-Bound Consolidation (25% Probability) Range: $3,320-3,375 Strategy: Fade extremes Buy Zone: $3,320-3,330 Sell Zone: $3,365-3,375 Breakout Confirmation: Volume spike Scenario 3: Bullish Reversal (15% Probability) Trigger: Break above $3,375 with volume Target 1: $3,390-3,400 Target 2: $3,410-3,420 Invalidation: Below $3,285 RISK FACTORS & CATALYSTS (24H) Bearish Catalysts US Dollar strength continuation Risk-off sentiment from geopolitical tensions Profit-taking ahead of weekend Technical breakdown confirmation Bullish Catalysts Safe-haven demand surge US Dollar weakness Central bank buying speculation Technical oversold bounce High-Impact Events (Next 24H) Asian market opening sentiment US Dollar Index movement Cryptocurrency correlation effects Weekend gap analysis TRADING RECOMMENDATIONS (24H) For Scalpers (5M-15M) Strategy: Fade bounces to resistance Entry: $3,355-3,365 area Target: $3,335-3,340 Stop: $3,375 Risk/Reward: 1:2 For Swing Traders (1H-4H) Primary Setup: Short on retracement Entry Zone: $3,350-3,360 Target 1: $3,300 Target 2: $3,285 Stop Loss: $3,385 Conservative Approach Wait for: Clear breakdown below $3,330 Entry: $3,325 (confirmation) Target: $3,285-3,290 Stop: $3,345 CONFLUENCE FACTORS Bearish Confluence at $3,285 Harmonic Bat pattern completion (88.6% level) Gann Square of Nine critical angle Elliott Wave 3 = 1.618 × Wave 1 target Fibonacci 78.6% retracement level Previous significant support area Wyckoff markdown initial target Resistance Confluence at $3,375 Gann 90-degree angle resistance Harmonic pattern resistance Elliott Wave corrective high Previous breakout level Psychological round number FINAL 24H FORECAST SUMMARY Expected Price Action: Controlled decline toward $3,285-3,300 support zone with potential for brief consolidation before further weakness. Primary Targets (Downside): First: $3,300-3,310 Second: $3,285-3,290 Extended: $3,260-3,270 Key Invalidation: Sustained break above $3,375 would shift bias bullish toward $3,390-3,410. Risk Management: Position sizing should be conservative due to high volatility expectations and weekend gap risks. Probability Assessment: 60% - Bearish scenario 25% - Sideways consolidation 15% - Bullish reversal Disclaimer: This analysis is for educational purposes only. Gold trading involves substantial risk. Always use proper risk management and never risk more than you can afford to lose. Volume profile resistance
shoonya0000
Based on the latest available information for July 15, 2025, the overall sentiment for XAUUSD (Gold) in the next 24 hours leans towards a bullish outlook, though with potential for short-term fluctuations and pullbacks. Key Drivers for Bullish Outlook: Escalating Trade Tensions: US President Donald Trump's ongoing tariff and trade policies are a significant factor. New tariffs and threats against various countries (EU, Mexico, Japan, South Korea, Brazil, Canada) are creating global economic uncertainty, which typically boosts gold's appeal as a safe-haven asset. Geopolitical Uncertainty: Broader geopolitical risks, including those related to Russia and Ukraine, also contribute to safe-haven demand for gold. Inflation Concerns: Tariffs are linked to inflation concerns. Gold performs strongly in a high-inflation environment, and market expectations are shifting towards a more gradual easing of interest rates by the Fed, allowing for inflation to be a potential driver. Central Bank Demand: Central banks globally, particularly the US and China, continue to be strong buyers of gold, indicating a sustained structural trend of higher gold purchases. Technical Support: Several analyses point to gold finding support at key levels (e.g., around $3340-3345, 200 EMA), suggesting potential for bounces and continuation of an upward trend. "Buy on Dip" Strategy: Many analysts are recommending a "buy on dip" strategy, indicating an underlying bullish bias and viewing any short-term declines as buying opportunities. Factors to Watch (Potential for Pullbacks/Volatility): Short-Term Weakness/Consolidation: Some technical indicators suggest short-term weakness or consolidation, with gold testing resistance levels (e.g., $3375-3380, $3400). US Dollar Strength: While trade tensions can weaken the dollar, there are mixed signals. A stronger US dollar can put downward pressure on gold prices as it makes gold more expensive for holders of other currencies. Inflation Data and Fed Signals: Investors are closely watching US inflation data (CPI) and signals from Federal Reserve officials regarding interest rate cuts. While some expect cuts later in the year, any hawkish surprises could temper gold's rise. Trade Deal Hopes: Any signs of de-escalation in trade tensions or progress towards agreements could temporarily reduce safe-haven demand for gold. Specific Price Levels Mentioned: Resistance: $3375-3380, $3400, $3432, $3450-3470, $3500 (all-time high). Support: $3340-3345, $3325-3330, $3289-3303, $3240-3246. In summary, the prevailing sentiment for XAUUSD over the next 24 hours appears to be bullish, driven by ongoing global trade tensions and safe-haven demand. However, be prepared for potential short-term pullbacks or consolidation as the market digests new information and tests key resistance levels. For those interested in further developing their trading skills based on these types of analyses, consider exploring the mentoring program offered by Shunya Trade. I welcome your feedback on this analysis, as it will inform and enhance my future work. Regards, Shunya Trade ⚠️ Disclaimer: This post is educational content and does not constitute investment advice, financial advice, or trading recommendations. The views expressed here are based on technical analysis and are shared solely for informational purposes. The stock market is subject to risks, including capital loss, and readers should exercise due diligence before investing. We do not take responsibility for decisions made based on this content. Consult a certified financial advisor for personalized guidance.
shoonya0000
In continuation :- The future outlook for Gold (XAUUSD) is a complex interplay of various macroeconomic factors, geopolitical developments, and market sentiment. As of mid-July 2025, several key themes are likely to shape its trajectory: Monetary Policy and Interest Rate Expectations (Central Bank Actions): Impact: Gold is a non-yielding asset. Therefore, its attractiveness is highly sensitive to interest rate movements. Higher interest rates (or expectations of them) tend to increase the opportunity cost of holding gold, as investors can earn more from interest-bearing assets like bonds. Conversely, lower rates or a more dovish stance from central banks (like the U.S. Federal Reserve, ECB, BoJ) reduce this opportunity cost, making gold more appealing. Current Context: As of mid-2025, markets are closely watching central bank rhetoric regarding potential rate cuts. If inflation continues to moderate, leading to clearer signals or actual rate cuts, this would likely be a positive catalyst for gold prices. However, if inflation proves stickier or central banks maintain a "higher for longer" policy, gold could face headwinds. Inflation Outlook: Impact: Gold has historically been considered a hedge against inflation and a store of value during periods of rising prices. Current Context: If inflation remains elevated or shows signs of re-accelerating, demand for gold as an inflation hedge could increase, providing support to prices. If inflation falls back significantly to central bank targets, this traditional appeal might lessen somewhat, unless other safe-haven drivers emerge. U.S. Dollar Strength: Impact: Gold is primarily priced in U.S. dollars. A stronger U.S. dollar makes gold more expensive for international buyers holding other currencies, potentially dampening demand. A weaker dollar has the opposite effect, making gold cheaper and generally supportive of higher gold prices. Current Context: The dollar's strength is heavily influenced by U.S. interest rate differentials and the relative economic performance of the U.S. versus other major economies. A "risk-off" environment can also lead to dollar strength (as a safe-haven itself), which can create a counteracting force for gold. Geopolitical Risks and Economic Uncertainty: Impact: Gold is a classic "safe-haven" asset. In times of increased geopolitical tension, economic instability, financial market turmoil, or escalating conflicts, investor demand for gold typically surges as a store of value. Current Context: Global geopolitical landscape remains complex, with ongoing regional conflicts, trade disputes, and political uncertainties. Any escalation in these areas would likely contribute to increased safe-haven demand for gold. Similarly, if there are growing concerns about a global economic slowdown or recession, gold's appeal as a safe haven could strengthen. Central Bank Gold Demand: Impact: Central banks globally have been significant buyers of gold in recent years, diversifying their reserves away from the U.S. dollar. Their sustained buying provides a structural floor to gold demand. Current Context: Continued strong buying by central banks, particularly from emerging economies, is expected to remain a supportive factor for gold prices in the medium to long term. Overall Future Outlook (Mid-July 2025 Perspective): The outlook for Gold (XAUUSD) appears cautiously bullish in the medium term, with potential for continued appreciation. Positive Drivers: The primary drivers are the increasing likelihood of future interest rate cuts (even if gradual), potentially persistent underlying inflation concerns, and the ongoing elevated geopolitical risks and global economic uncertainties. Continued strong central bank demand further underpins this outlook. Potential Headwinds: A significantly stronger-than-expected U.S. dollar (e.g., due to a major global "risk-off" event that drives dollar demand, or robust U.S. economic outperformance leading to delayed rate cuts) could provide a counteracting force. Rapid disinflation could also temper some of gold's appeal. In summary, Gold is likely to remain an important asset in investor portfolios, acting as both an inflation hedge and a safe haven. Its price action will be particularly sensitive to central bank policy shifts and global stability. ⚠️ Disclaimer: This post is educational content and does not constitute investment advice, financial advice, or trading recommendations. The views expressed here are based on technical analysis and are shared solely for informational purposes. The stock market is subject to risks, including capital loss, and readers should exercise due diligence before investing. We do not take responsibility for decisions made based on this content. Consult a certified financial advisor for personalized guidance
shoonya0000
High-Level Strategy (Monthly/Weekly/Daily Recap) Overall Market Condition: The primary trend has shifted from Bullish to Bearish/Corrective due to the Monthly Bearish Engulfing and Weekly Three Black Crows patterns. Immediate Tactical Bias: The Daily Bullish Harami pattern strongly indicates a pause in the downtrend and the high probability of a short-term corrective rally (a "bounce"). Our Goal: To map out the entry, targets, and invalidation levels for this anticipated bounce. Deep Dive: The Lower Timeframes (4H, 1H, 30M, 15M, 5M) Consolidation After the Low (4H & 1H): Candlestick Reading : As observed, after the low was made (~2318), the price action on the 1H and 4H charts has stopped making new lows. Instead, it is building a base, characterized by a series of Dojis and Spinning Tops. This is a classic sign of indecision and absorption, where selling pressure is drying up and buyers are beginning to tentatively step in. This is the "coiling spring" phase before the bounce. The Trigger (15M & 5M): Candlestick Reading: On the 15M and 5M charts, we are looking for the very first sign that buyers are taking control. The ideal trigger would be a clear, small-scale Bullish Engulfing or Tweezer Bottom pattern forming at the bottom of this consolidation range. As of the last candle on the 5M chart, we see a small green candle attempting to move up, but the trigger is not yet confirmed. The Full Storyboard: From Entry to Exit with Price Levels For those interested in further developing their trading skills based on these types of analyses, consider exploring the mentoring program offered by Shunya Trade. I welcome your feedback on this analysis, as it will inform and enhance my future work. Regards, Shunya Trade ⚠️ Disclaimer: This post is educational content and does not constitute investment advice, financial advice, or trading recommendations. The views expressed here are based on technical analysis and are shared solely for informational purposes. The stock market is subject to risks, including capital loss, and readers should exercise due diligence before investing. We do not take responsibility for decisions made based on this content. Consult a certified financial advisor for personalized guidance.
shoonya0000
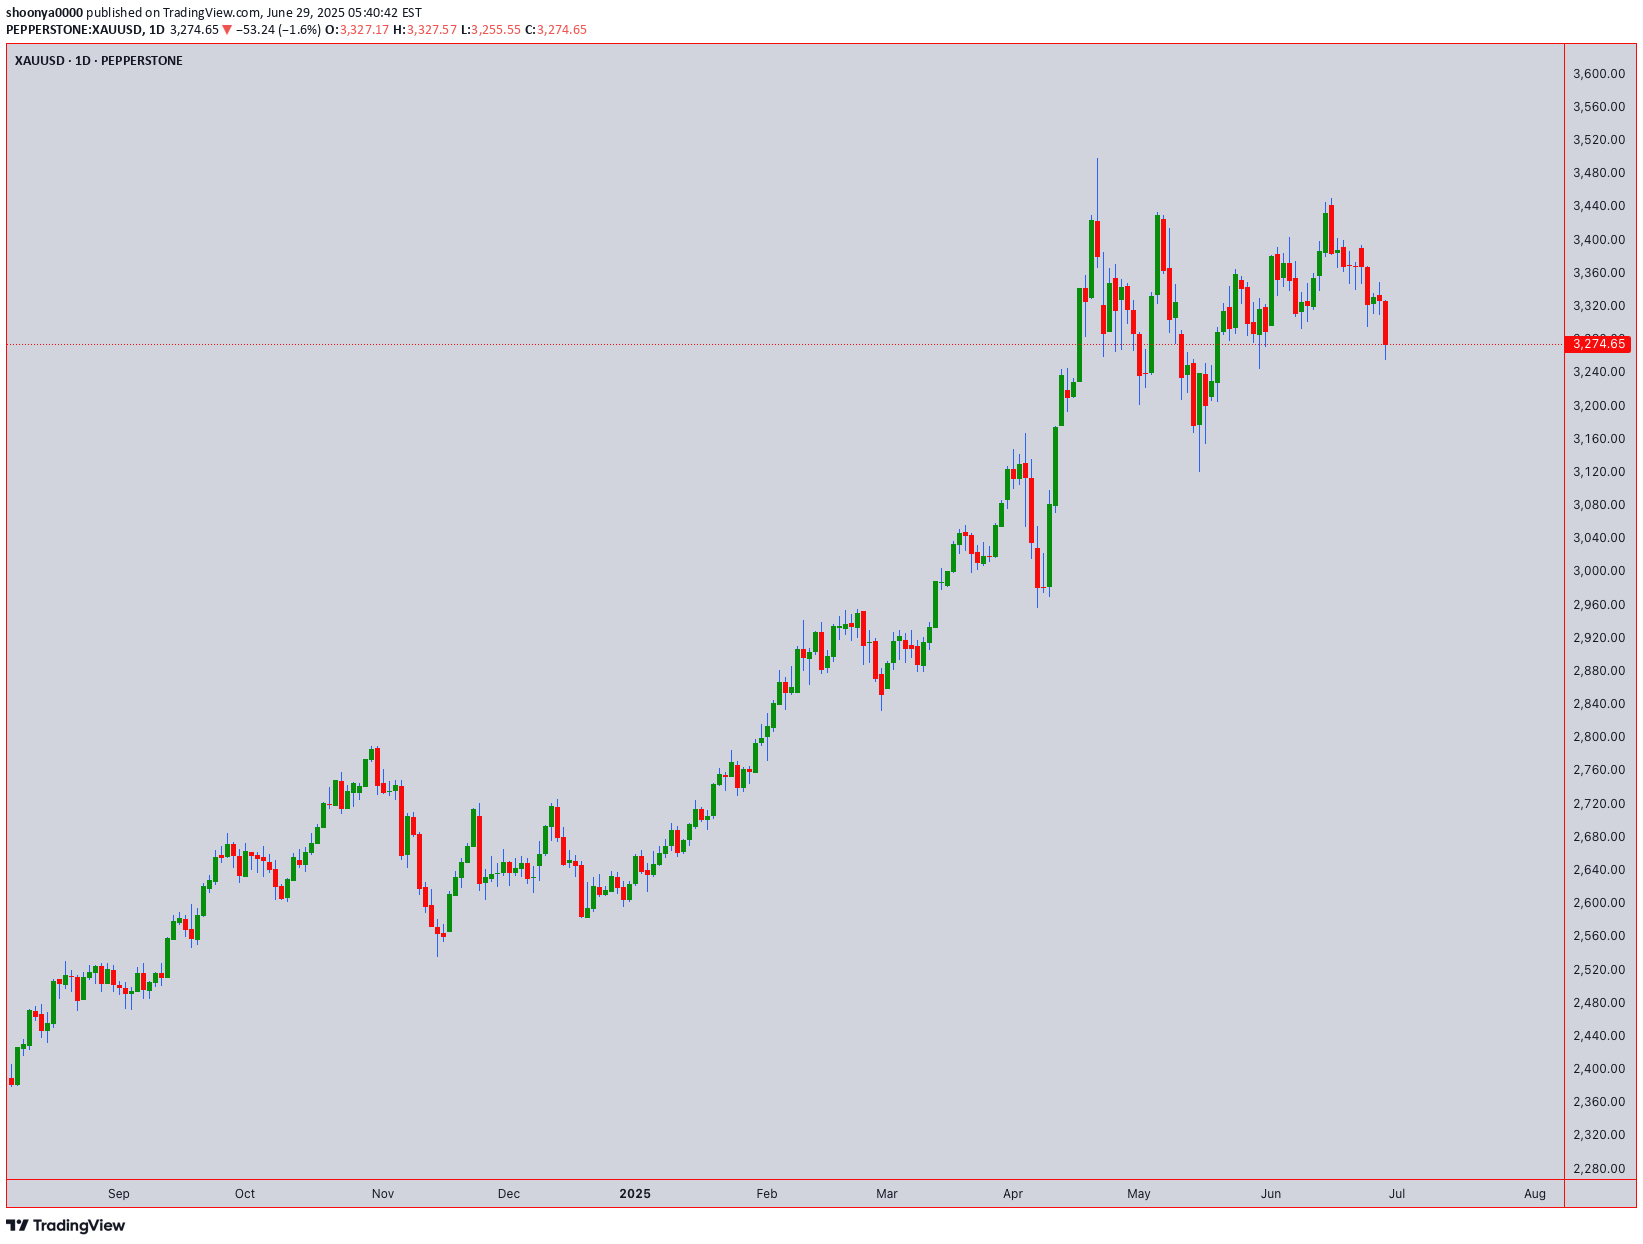
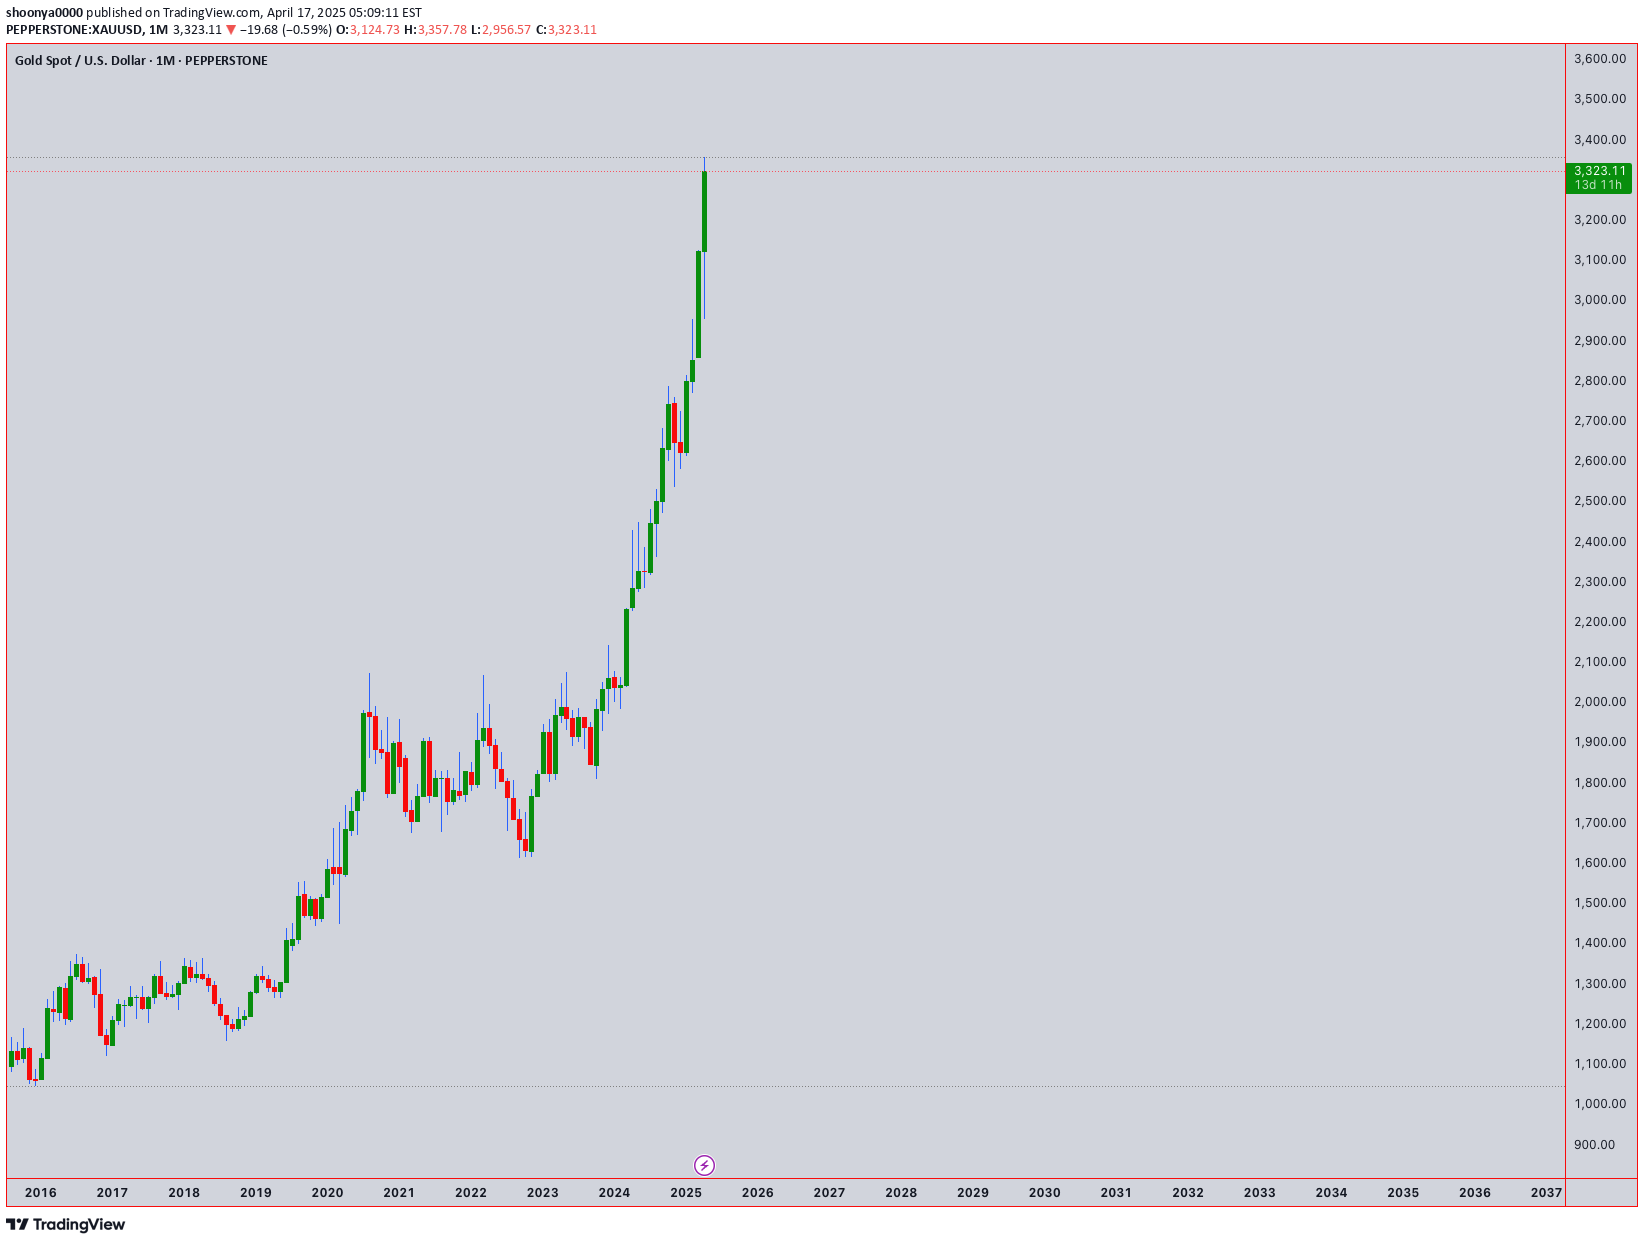
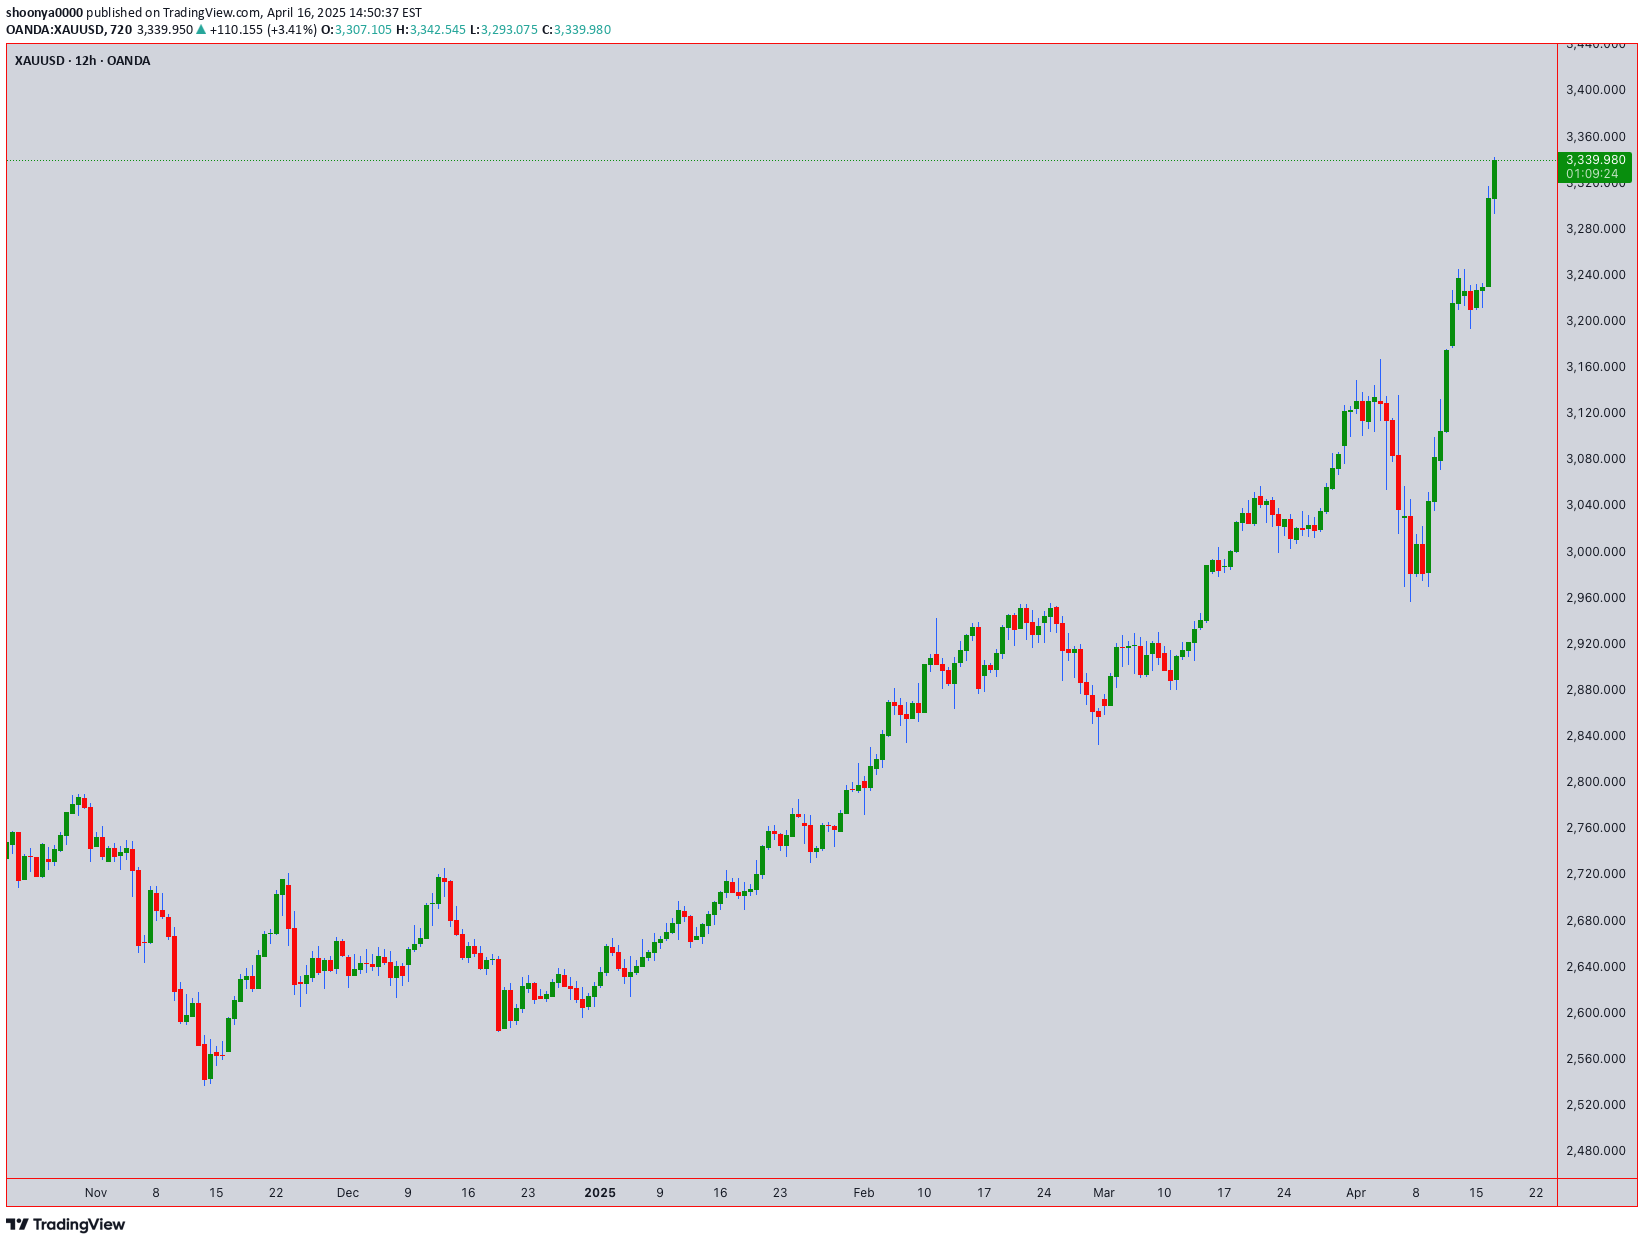
Here is my comprehensive, multi-timeframe analysis for XAUUSD. Master Analysis Report: XAUUSD This report synthesizes Candlestick patterns, Ichimoku, Heikin Ashi, Fibonacci ratios, and the outputs of our custom application to build a coherent outlook for Gold. 1. Monthly Timeframe (The Secular Trend) Observation: The monthly chart shows a powerful and established uptrend. The price action is characterized by long, healthy bullish candles, indicating consistent, long-term buying pressure. Candlestick Analysis: There are no major bearish reversal patterns at the top. The structure is one of higher highs and higher lows, the definition of a bull market. The last visible candle is strong and green. Ichimoku Analysis: The price is trading significantly above a thick, supportive Kumo (Cloud). The Tenkan-sen is above the Kijun-sen, and the Chikou Span is unencumbered high above the price action of 26 months ago. This is a textbook example of a strong, secular bull market. Conclusion (Monthly): The long-term bias is unequivocally Bullish. The fundamental trend is up. 2. Weekly Timeframe (The Dominant Trend) Observation: The weekly chart confirms the strength seen on the monthly. The uptrend is clear and well-defined. Heikin Ashi Interpretation: Applying Heikin Ashi principles here would show a long series of green candles with no, or very small, lower wicks. According to the rules you taught me, this signifies a strong, healthy, and trending market with buyers in firm control. Conclusion (Weekly): The dominant, multi-week trend is Strongly Bullish. 3. Daily Timeframe (The Current Trading Environment) Observation: This is where we see the most recent price action from your chart. The price made a strong push to a new high (around $3,375) and has now entered a corrective pullback phase. Candlestick Analysis: The candle at the peak of the move shows a Long Upper Shadow, indicating that sellers stepped in at that level to take profits, initiating this pullback. The subsequent red candles confirm a short-term loss of bullish momentum. This is not yet a reversal of the major trend, but a necessary correction. Ichimoku Analysis: The price is pulling back towards its first line of dynamic support, the Tenkan-sen. The Kijun-sen (currently much lower) represents the key medium-term support level. As long as the price remains above the Kijun-sen and ultimately the Kumo cloud, the bullish structure is considered fully intact. Conclusion (Daily): The primary trend is Bullish, but the immediate short-term sentiment is Corrective / Bearish. 4. Price & Time Target Analysis (The Storyboard) This is where we combine everything to map out the next potential move. We will analyze the primary swing on the Daily chart. Swing Low (Point A): ~ $3,150 Swing High (Point B): ~ $3,375 Phase 1: The Pullback - Finding Support (Potential Buy Zones) Master Storyboard and Final Conclusion The Big Picture: Gold (XAUUSD) is in a powerful, long-term bull market. We should only be looking for buying opportunities. The Current Chapter: The market is in a healthy and necessary pullback. This pullback is a gift, offering a chance to enter the main trend at a better price. The Climax: The key battleground will be the Fibonacci support zone between 3,262∗∗and∗∗ 3,235. We will be watching for a classic bullish reversal pattern to form in this area. The Predictive Trigger: The ultimate confirmation would be if this reversal happens on or near a date identified by our application's "Coming Week" or "Coming Month" predictive summary. An event like "Venus Trine Price Angle (Supportive)" occurring as the price tests the Golden Pocket would be a Grade-A signal. Final Outlook: The strategy is to wait patiently for the current correction to find support and then look for a clear bullish signal to enter in alignment with the dominant uptrend. The next major upward move targets 3,435∗∗and potentially∗∗3,514. The overall bias is Bullish, pending the completion of the current short-term correction. For those interested in further developing their trading skills based on these types of analyses, consider exploring the mentoring program offered by Shunya Trade. I welcome your feedback on this analysis, as it will inform and enhance my future work. Regards, Shunya Trade ⚠️ Disclaimer: This post is educational content and does not constitute investment advice, financial advice, or trading recommendations. The views expressed here are based on technical analysis and are shared solely for informational purposes. The stock market is subject to risks, including capital loss, and readers should exercise due diligence before investing. We do not take responsibility for decisions made based on this content. Consult a certified financial advisor for personalized guidance.
shoonya0000
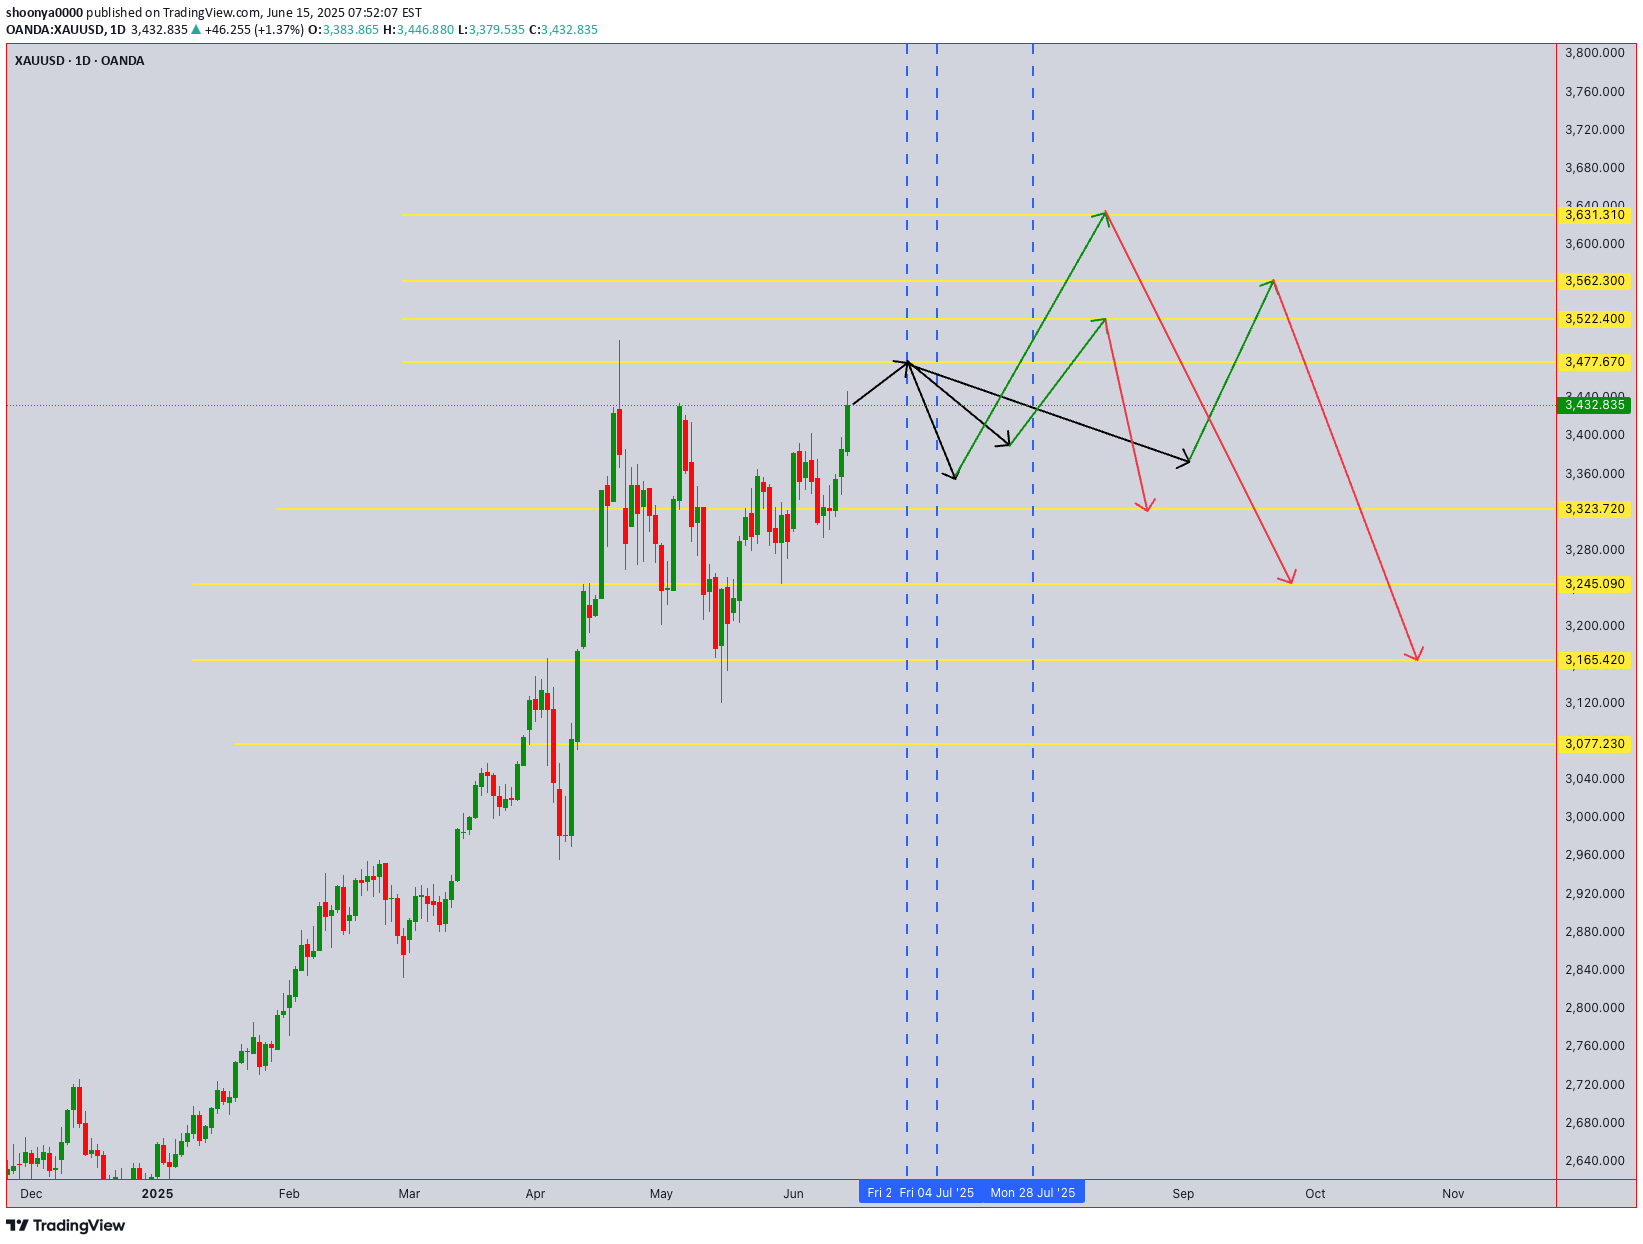
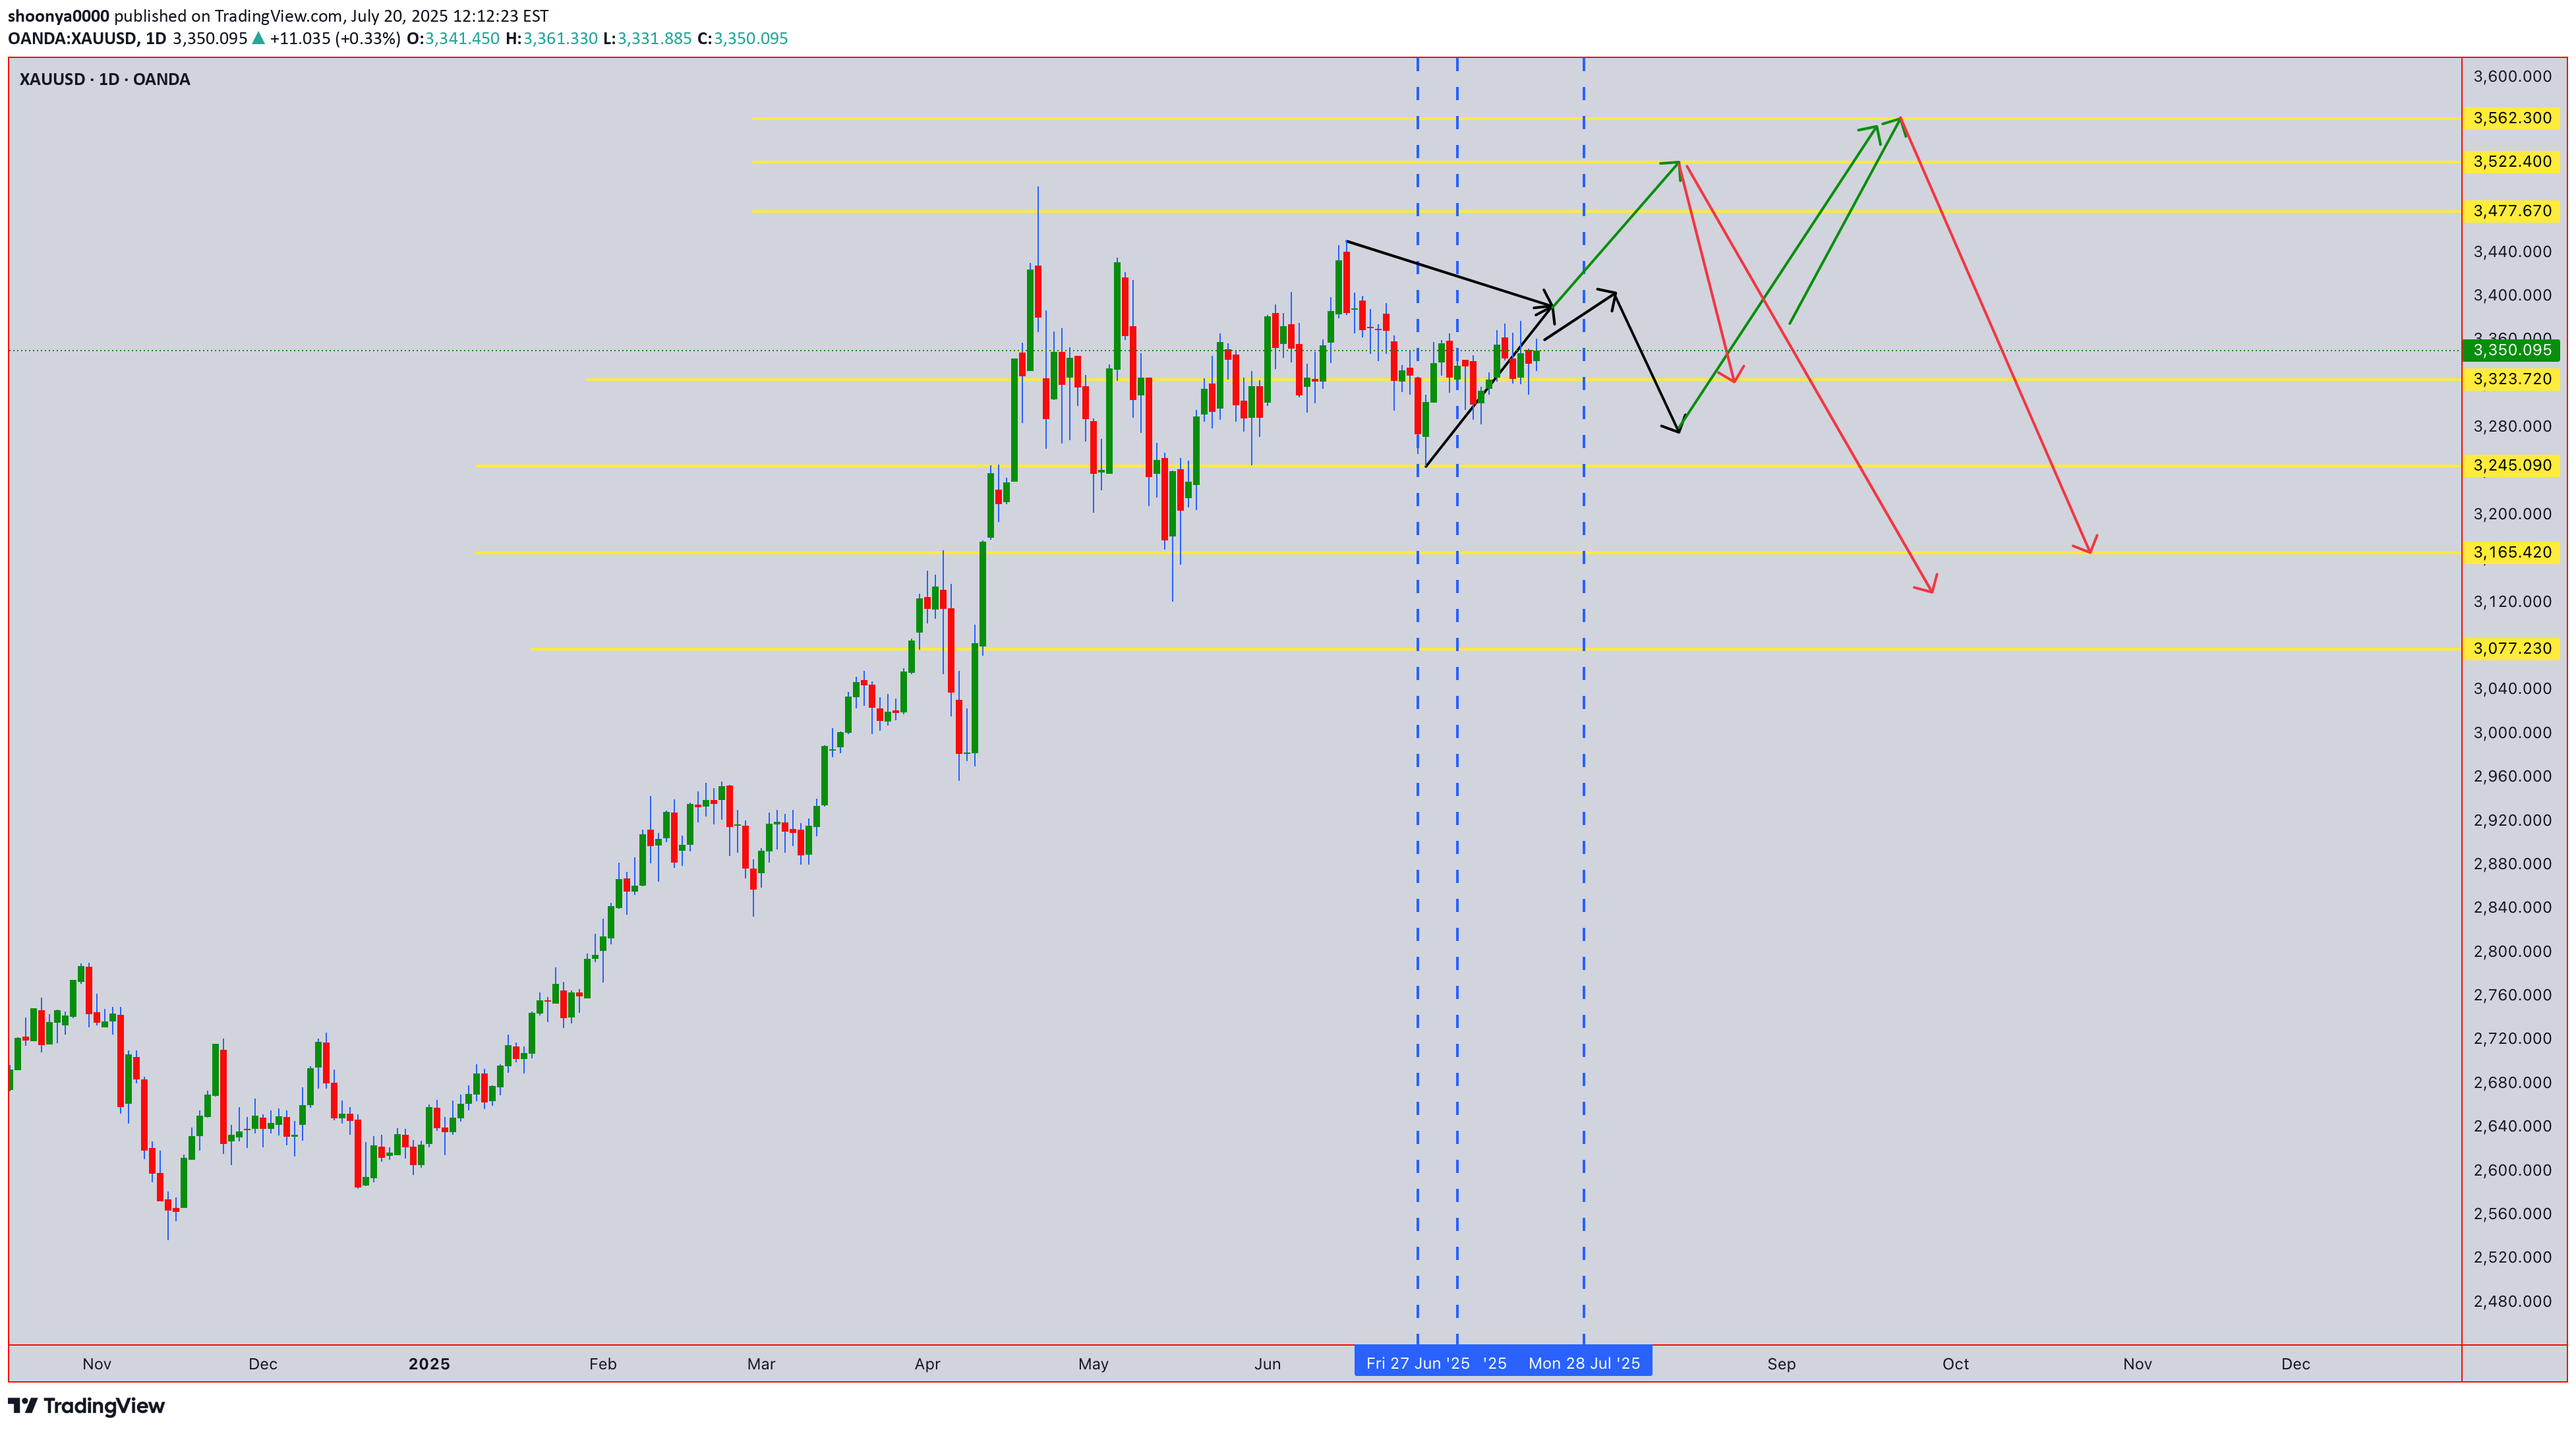
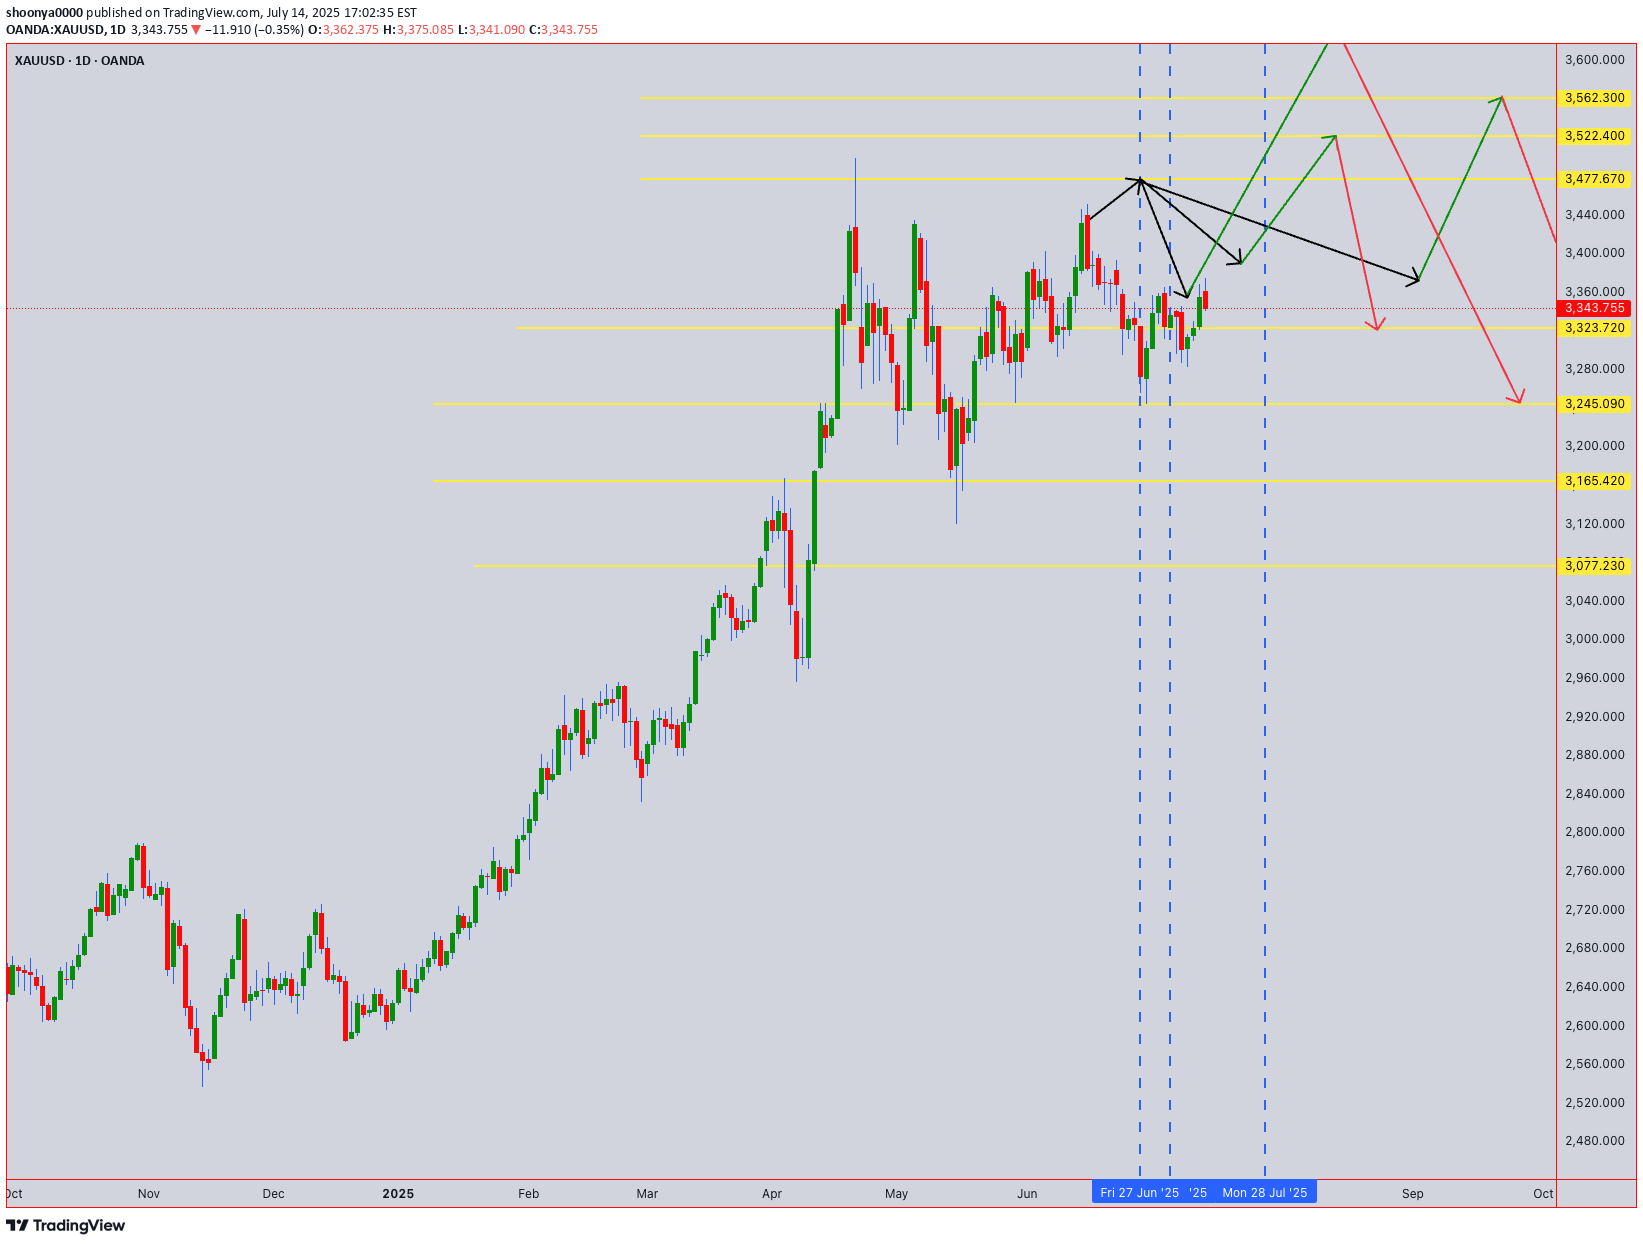
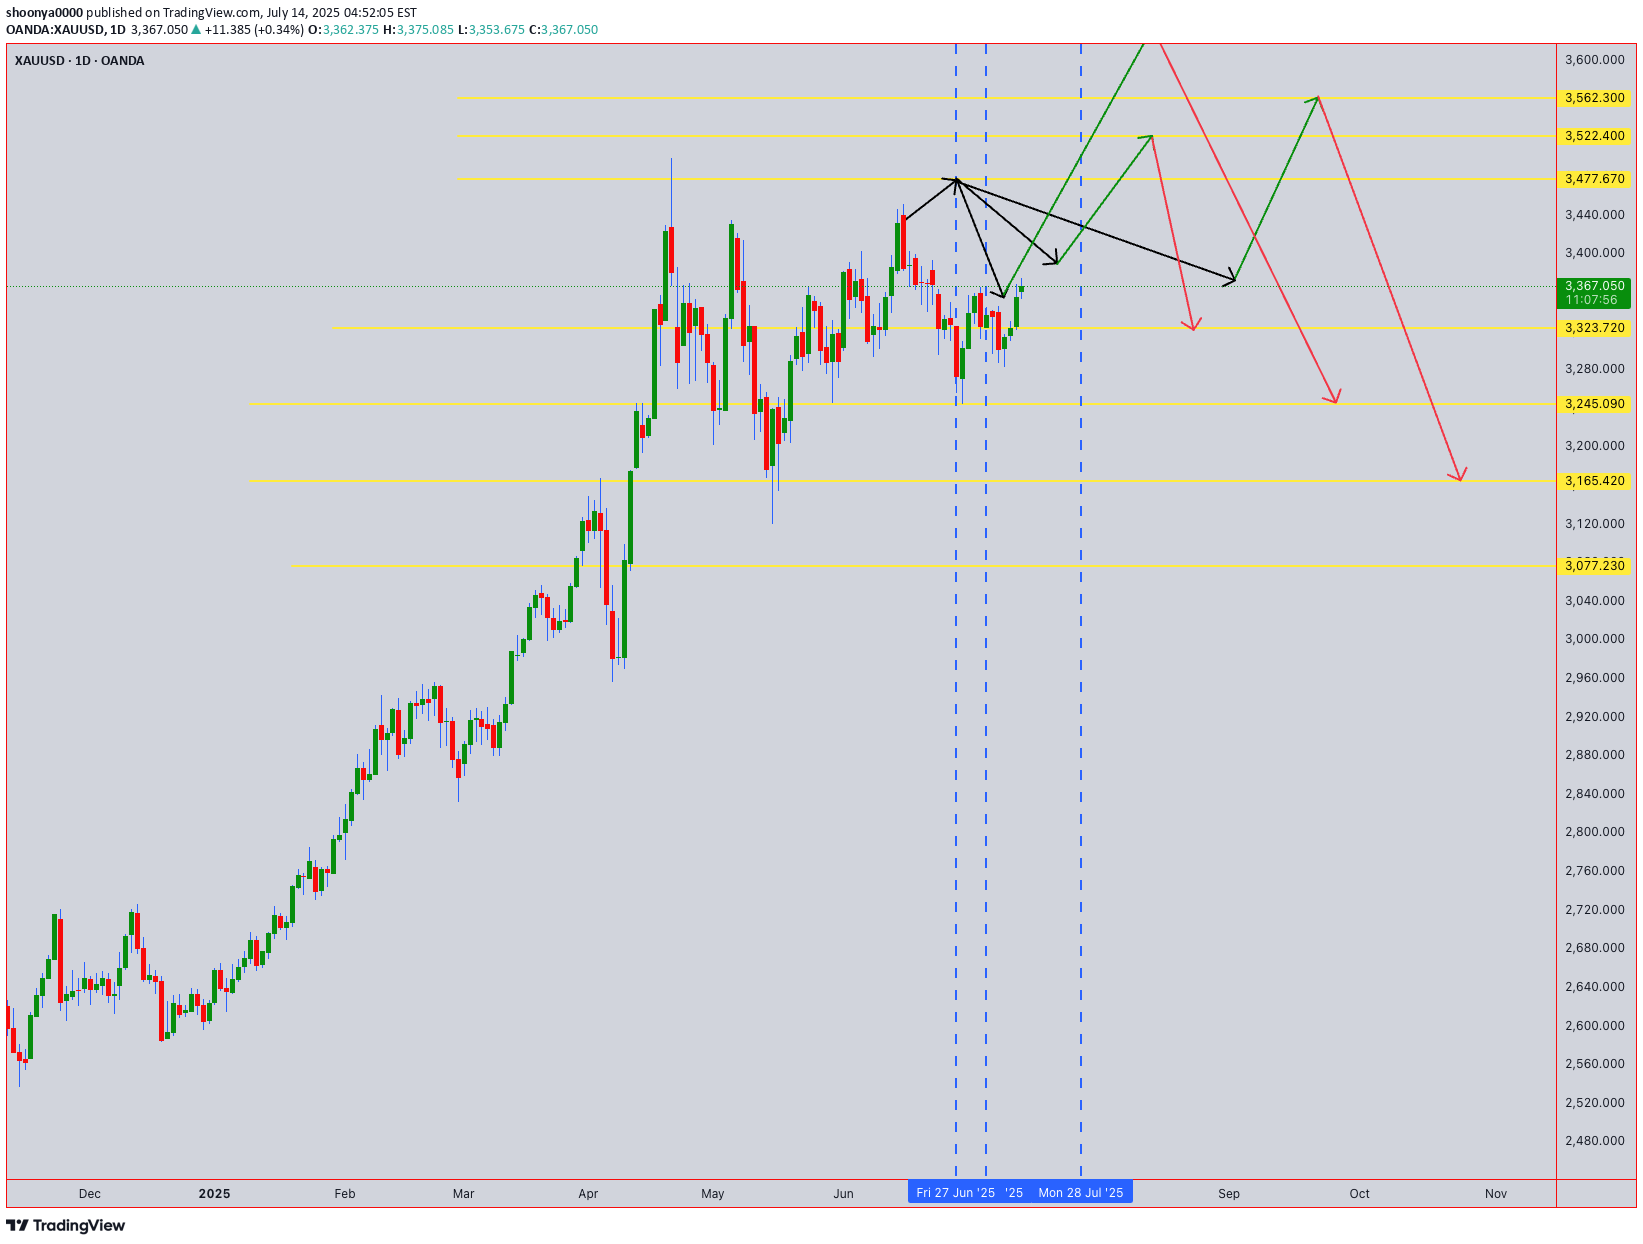
Hey everyone! Today, we're diving deep into XAUUSD (Gold) using a daily candle tape reading approach that aims to uncover critical turning points and price levels. If you're looking for an edge in understanding Gold's movements, this analysis could be a game-changer. On the accompanying chart, you'll see yellow horizontal lines that highlight key bullish and bearish price levels. These aren't just arbitrary lines; they represent significant battlegrounds where buyers and sellers have historically shown their hand. In addition, the vertical lines on the chart pinpoint specific days where we've observed a change in trade direction or a potential reversal. It's important to note that these shifts can sometimes occur within one or two candles before or after the marked day, so keep an eye on the immediate vicinity. We're interpreting these price levels with a 3% to 5% tolerance, allowing for the natural ebb and flow of the market around these crucial points. Key Price Levels to Watch: Bullish Price Levels: 3477.67: A critical zone where bullish momentum has historically taken hold. 3522.40: Another strong support level that could propel Gold higher. 3562.30: Watch this level for signs of continued upward pressure. 3631.31: A significant resistance-turned-support level that could signal a strong bullish continuation. Bearish Price Levels: 3323.72: A key level where bearish pressure has often intensified. 3245.09: If this level breaks, it could indicate further downside for Gold. 3165.42: A crucial support level; a breach here could accelerate a downtrend. 3077.23: The ultimate test for the bears; a break below could signal a more substantial correction. __________________________________________________________________________________ What are your thoughts on these levels? Have you noticed similar patterns in your own XAUUSD analysis? Share your insights in the comments below! ⚠️ Disclaimer: This post is educational content and does not constitute investment advice, financial advice, or trading recommendations. The views expressed here are based on technical analysis and are shared solely for informational purposes. The stock market is subject to risks, including capital loss, and readers should exercise due diligence before investing. We do not take responsibility for decisions made based on this content. Consult a certified financial advisor for personalized guidance
shoonya0000
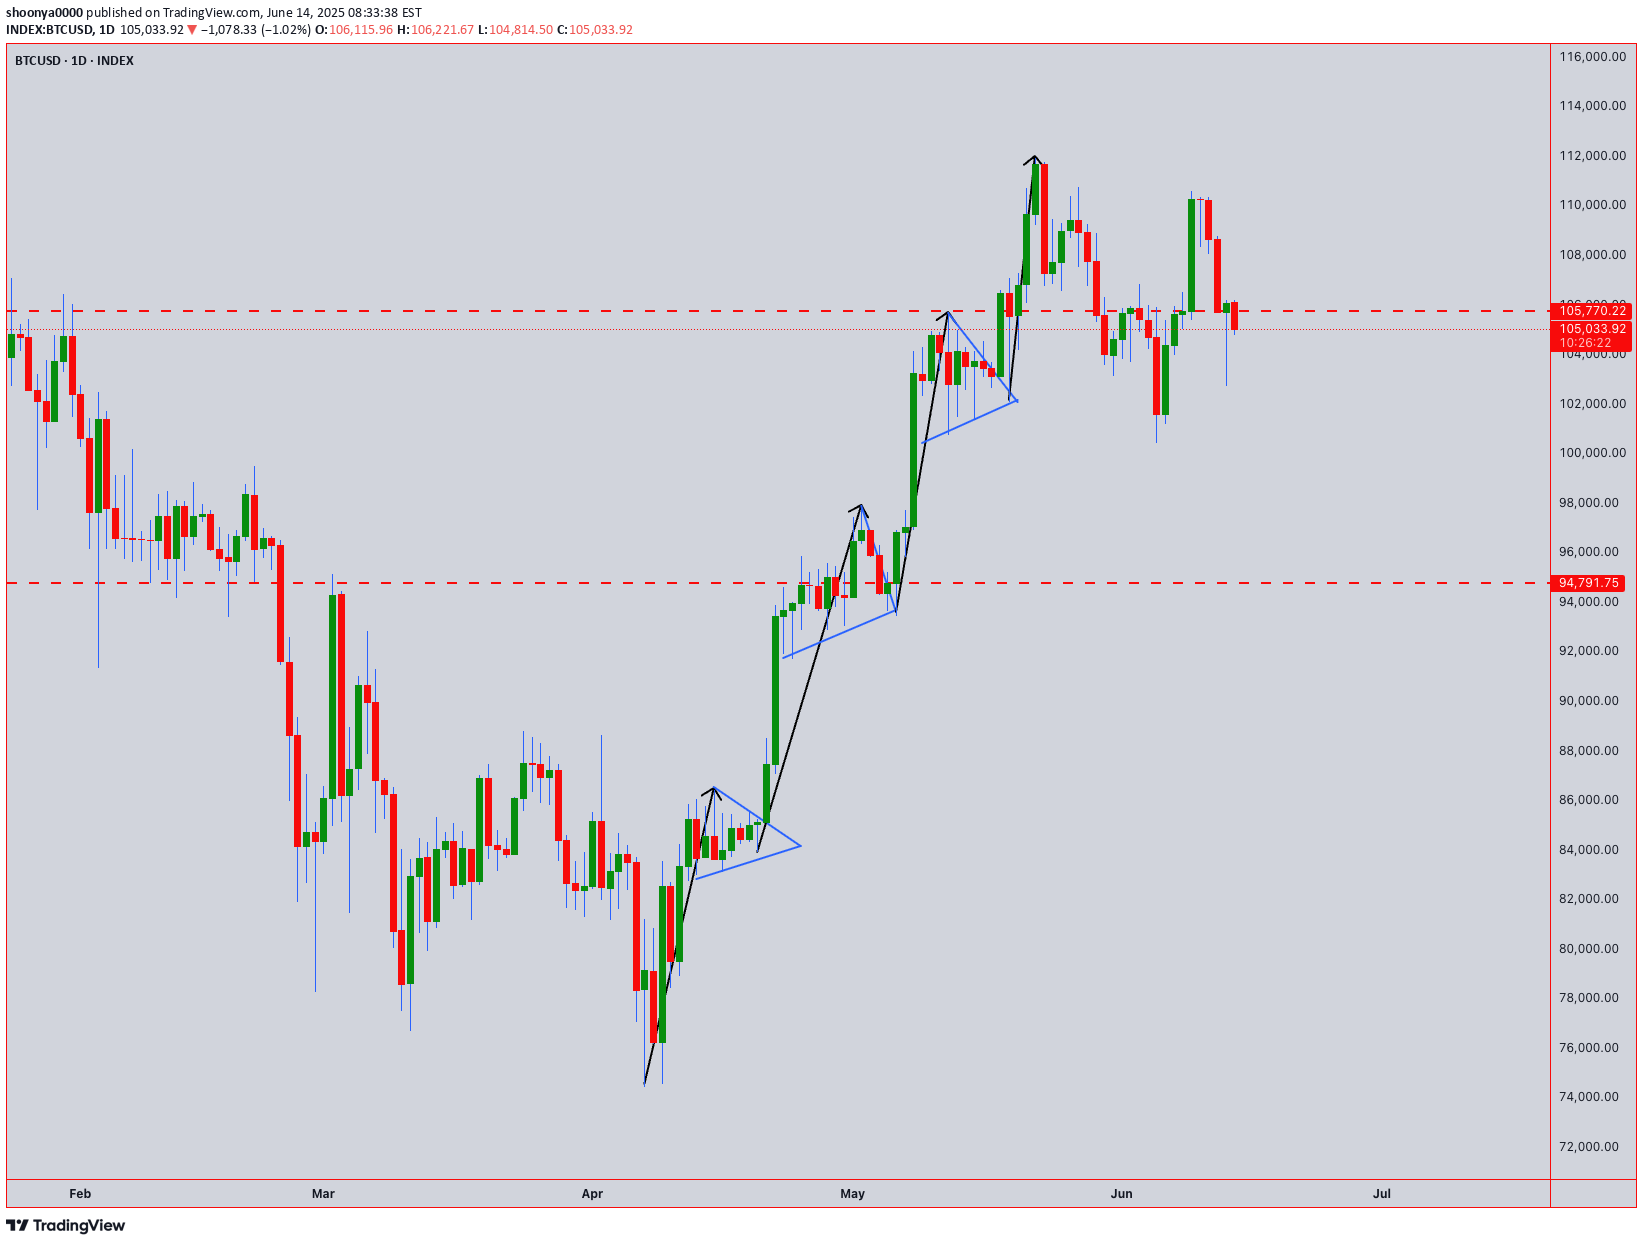
🚀 BTCUSD: Decoding the Price Action Through "Tape Reading" 🚀 Hey Traders, Let's dive into a "tape reading" analysis of BTCUSD, breaking down the recent price movements and looking ahead. We've seen some fascinating patterns emerge, and understanding them could be key to our next moves. 🔍 A Look Back: The Bullish Flag Formations 🔍 Our journey begins on April 7th, 2025, with the establishment of a strong "Flag Pole" at $74,489.00. This was supported by a robust double bottom, setting the stage for what was to come. First "Flag" Confirmation: We saw the first "Flag" form, confirmed by a powerful "Hammer" candle on April 20th, 2025. This Hammer, with its unique "bottom-less Marubozu" body, signaled significant underlying strength. Second "Flag" Confirmation: Another "Flag" emerged, solidified by strong multi-day bottom support around $94,791.00. This resilience suggested continued upward momentum. The Breakout: On May 8th, 2025, BTCUSD surged, breaking out of its previous patterns and entering a new "flag pole" formation. Third "Flag" & All-Time High: May 15th, 2025, brought the third "Flag" formation, again supported by a "Hammer" and a bullish Marubozu. This momentum culminated in a breach of the $105,770.00 multi-month price level on May 20th, 2025, breaking the previous all-time high from December 17th, 2024! We then rocketed to a new all-time high of $112,000. 📉 Recent Developments: The Downtrend and Key Levels 📉 Since the all-time high, we've started to experience a shift: Downtrend Begins: A downtrend initiated around May 22nd, 2025. High-Low Formations: We observed a second high-low formation on May 27th, 2025, followed by another on June 9th, 2025. Double Top & Hanging Man: A clear double top formation emerged, further supported by a "Hanging Man" candle on June 10th, 2025. 🔮 What's Next? The Critical Close 🔮 Today's candle close is absolutely paramount! As of now, the candle is still forming, but my current read suggests a potential move to fill the wick of the June 13th, 2025, "Hammer" candle. The direction BTCUSD takes – North or South – will largely be dictated by how today's candle closes. This will be our prime dominant signal. Monthly Candle Perspective: Interestingly, the Monthly candle is showing similar "Flag" patterns. Check out the chart here for a broader perspective: Let me know your thoughts in the comments below! Are you seeing the same patterns? Trade safe! _________________________________________________________________________________ ⚠️ Disclaimer: This post is educational content and does not constitute investment advice, financial advice, or trading recommendations. The views expressed here are based on technical analysis and are shared solely for informational purposes. The stock market is subject to risks, including capital loss, and readers should exercise due diligence before investing. We do not take responsibility for decisions made based on this content. Consult a certified financial advisor for personalized guidance.
shoonya0000
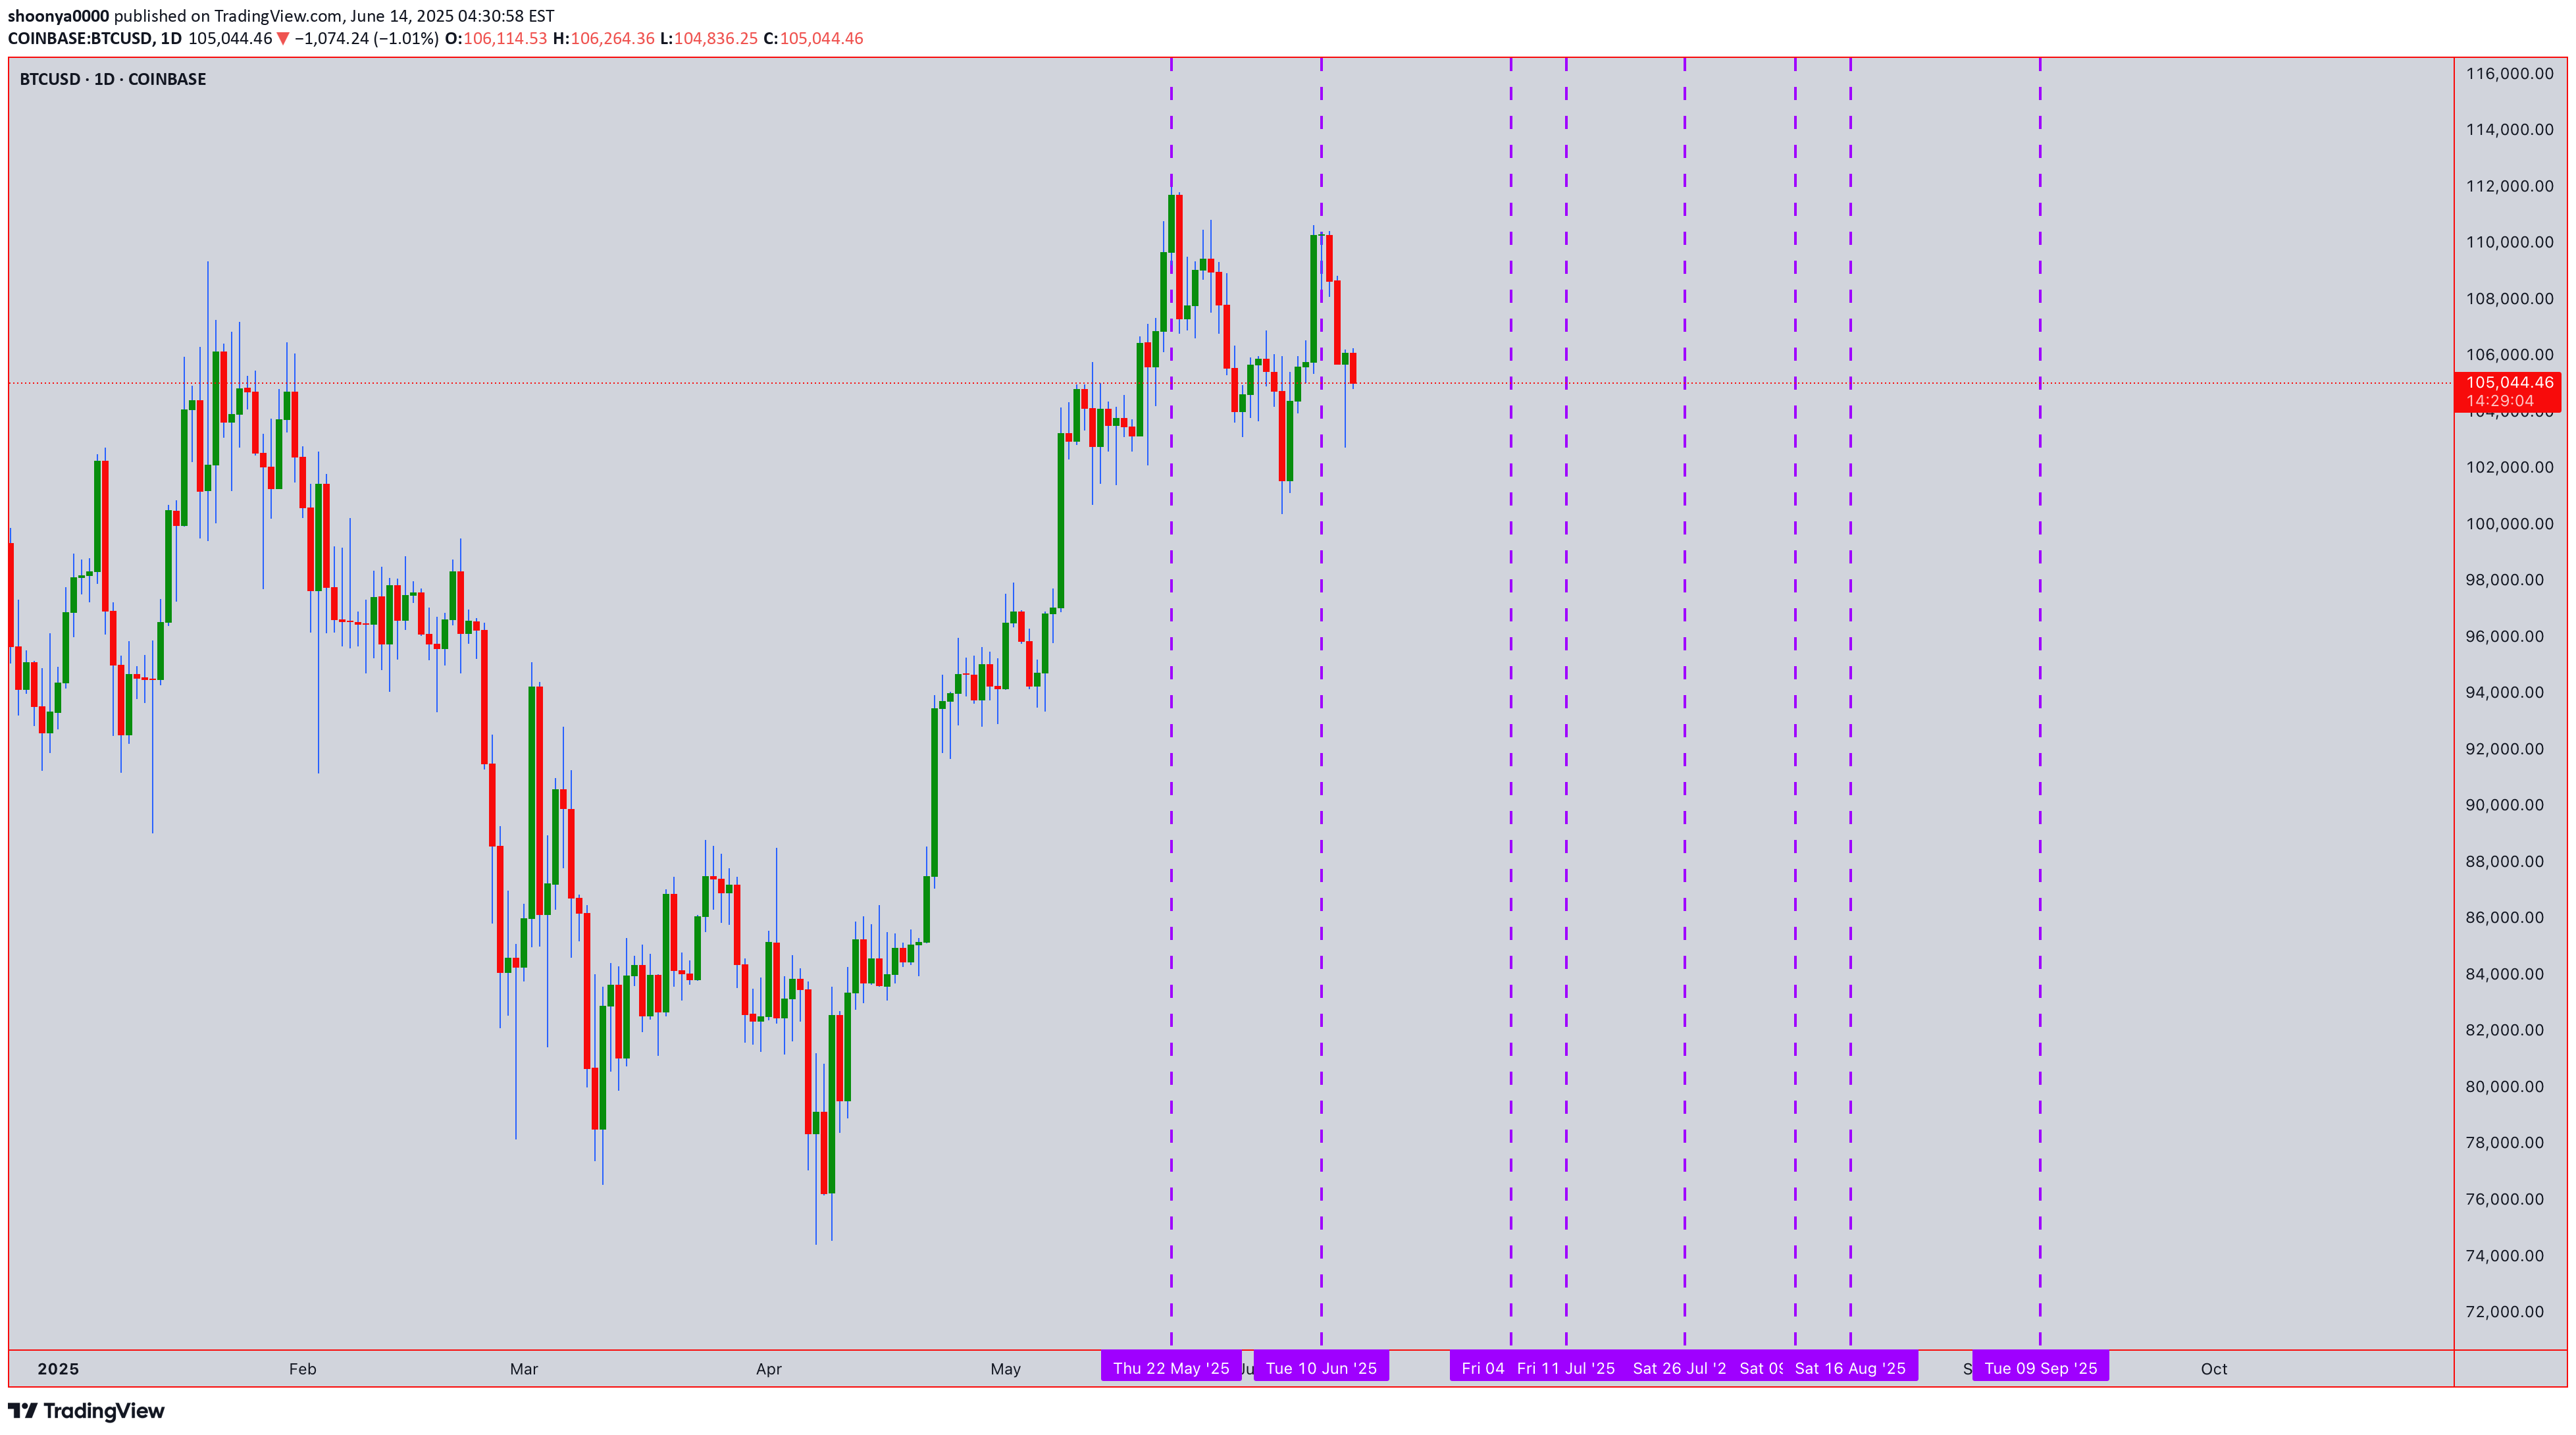
Hey everyone, Taking a closer look at the BTCUSD chart, I've plotted some interesting price levels that could act as significant support and resistance in the coming weeks. This analysis aligns with what appears to be a trend-based Fibonacci time analysis, and I've also marked some crucial dates where we might see major market changes. Based on our observations, we're seeing a range of important price action. For instance, notice the cluster of highs around the 112,048 to 113,343 area. These levels, particularly those marked with an asterisk such as 112,167, 112,503, and 113,006, have previously shown strong upward movements, suggesting they could serve as notable resistance if price attempts to push higher. Conversely, on the downside, the levels from 111,952 down to 110,665, with points like 111,833, 111,499, and 110,832 highlighted, have historically seen bounces or significant slowing of downward momentum. These could very well act as crucial support areas, preventing further declines. As we move forward, it will be crucial to observe how price interacts with these levels, especially around the following dates where we might see major market shifts: July 4th, 2025 July 11th, 2025 July 26th, 2025 August 9th, 2025 August 16th, 2025 September 9th, 2025 The higher resistance points reaching up to 118,793 and lower support extending to 105,407 define a broader range we'll be watching closely. Keep an eye on these zones for potential reversals or breakthroughs, particularly around the dates mentioned, which could signal the next significant move for Bitcoin. As always, manage your risk accordingly. What are your thoughts on these levels and potential turning points? Share in the comments below! Want to Level Up? Join Shunya Trade’s Mentoring Program to master these strategies and sharpen your technical analysis skills. Your Feedback Matters! Let me know how this analysis works for you—your insights will shape future reports! Let’s navigate the markets together—wisely and proactively. Trade safely! ⚠️ Disclaimer: This post is educational content and does not constitute investment advice, financial advice, or trading recommendations. The views expressed here are based on technical analysis and are shared solely for informational purposes. The stock market is subject to risks, including capital loss, and readers should exercise due diligence before investing. We do not take responsibility for decisions made based on this content. Consult a certified financial advisor for personalized guidance. Price HighPrice Low 112048 111952 112084 111916 *112167 *111833 *112335 *111666 *112503 *111499 *112670 *111332 *112838 *111165 *113006 *110998 *113174 *110832 *113343 *110665 114017 110001 *114693 *109339 115372 108678 116052 108020 116734 107364 *117419 *106709 118105 106057 118793 105407
shoonya0000
1. Market Overview: Bullish Momentum Current Trend: Gold is in a bullish phase, supported by price action above key moving averages (e.g., 50-day SMA/EMA). Immediate Targets: Target 1: 3571 (near-term resistance from Fibonacci extension). Target 2: 3747 (alignment with historical highs and harmonic patterns). Key Support: 3330 (round number + confluence of trendline support). 2. Time & Price Analysis Vertical Reversal Line: A short-term reversal is expected at ▲ [Mark Date/Time Here] (use TradingView’s vertical line tool). Rationale: Cycle analysis suggests profit-taking at this juncture, followed by trend continuation. Bullish Continuation: After the reversal, expect a rally toward 3571 and 3747. 3. Critical Pattern: Cup and Handle Pattern Progress: The cup is forming, with the handle consolidation phase projected to complete by September 2022 (adjust date if typo intended). Breakout Confirmation: A close above the cup’s rim (e.g., 3450) validates the pattern. Target: Measured move suggests ~15-20% upside post-breakout. 4. Cyclical Analysis (48-Day Cycle) Current Phase: We are in the ascending phase of the 48-day cycle. Next Cycle Shift: Monitor for trend acceleration or reversal around ▲ [Date +48 Days] (use cycle tools for visual clarity). Key Action: Adjust positions if price diverges from cycle expectations (e.g., failure to hold 3330). 5. Long-Term Outlook 2025 Low Reference: The $2536 level (November 2024) is flagged as a structural low, reinforcing the multi-year bullish bias. Risk Management: Stop-Loss: A sustained break below 3330 invalidates the short-term bullish thesis. Position Sizing: Hedge exposure if volatility spikes (e.g., Fed policy shifts). 6. Visual Tools (TradingView) Horizontal Lines: Mark 3330 (support), 3571, and 3747 (targets). Fibonacci Retracement: Draw from recent swing low to high for extension levels. Cup and Handle: Use the “shapes” tool to outline the pattern. Cycle Annotation: Label the 48-day cycle with text/arrows. Call to Action: “Like, follow, and comment to unlock updates! Set alerts at 3330 for pit-stop entry opportunities.” ⚠️ Disclaimer: This post is educational content and does not constitute investment advice, financial advice, or trading recommendations. The views expressed here are based on technical analysis and are shared solely for informational purposes. The stock market is subject to risks, including capital loss, and readers should exercise due diligence before investing. We do not take responsibility for decisions made based on this content. Consult a certified financial advisor for personalized guidance. Want to Level Up? Join Shunya Trade’s Mentoring Program to master these strategies and sharpen your technical analysis skills. Your Feedback Matters! Let me know how this analysis works for you—your insights will shape future reports! Let’s navigate the markets together—wisely and proactively. Trade safely! Cycle-1--->Cycle-2--->Cycle-3--->Cycle-4--->Cycle-5 A--->2983.25--->3205.72--->3436.20--->3674.68--->3921.15 B--->3010.62--->3234.10--->3465.57--->3705.05--->3952.52 C--->3038.12--->3262.59--->3495.07--->3735.55--->3984.02 D--->3065.74---> 3291.21--->3524.69--->3766.17--->4015.64 E--->3093.49--->3319.96--->3554.44--->3796.91--->4047.39 F--->3121.36--->3348.83--->3584.31--->3827.79--->4079.26 G--->3149.35--->3377.83--->3614.31--->3858.78--->4111.26 H--->3177.48--->3406.95--->3644.43--->3889.91--->4143.38
shoonya0000
Understanding Our Approach: High-Probability Reversals with Price & Time Analysis Hello Fellow Traders! We often get asked about the core principles behind our analysis here on TradingView. Today, we want to share a key part of our methodology: how we combine Price Analysis and Time Analysis to pinpoint potentially high-probability reversal signals in the market. Our goal isn't just about finding any setup, but finding setups where the odds seem stacked more favorably for a potential trend change. We do this by looking for confluence – where different factors align. 1. Price Analysis: Finding Where the Market Might Turn What it is: This is about identifying significant price levels on the chart. Think of these as important zones, not just single lines. How we use it: Support & Resistance: We look for historical areas where price has repeatedly bounced off (support) or struggled to break through (resistance). The stronger and more tested the level, the more significant it becomes. Price Action Clues: We watch how price behaves when it reaches these key levels. Are there strong rejection candles (like pin bars or engulfing patterns)? Is momentum slowing down? These clues tell us if buyers or sellers are stepping in or losing control. 2. Time Analysis: Finding When the Market Might Turn What it is: This adds the dimension of time to our price analysis. Markets often move in cycles or react around specific time points. How we use it: Timing Cycles: We look for potential cycles or rhythmic patterns in price swings. Sometimes, trends tend to exhaust themselves after a certain duration. Time Convergence: We pay close attention when price approaches a key Price Level (from step 1) around a potentially significant Time point (e.g., end of a known cycle, specific session timing, alignment with time-based indicators if used). The Synergy: Combining Price & Time for High-Probability Signals The real power in our approach comes when Price and Time align. Imagine price reaching a major historical resistance level (Price Analysis). Now, imagine this happens exactly when a known time cycle is expected to complete (Time Analysis). This convergence signals a potentially higher probability reversal point than if only one factor was present. It tells us that where the market is and when it got there are both significant. How You Can Apply This Concept: Identify Key Levels: Mark major support and resistance zones on your charts. Observe Time: Become aware of market timing – session opens/closes, news events, or potential cyclical patterns you observe. Look for Confluence: Wait for price to test a strong level around a potentially significant time point. Seek Confirmation: Always look for confirmation signals (like candlestick patterns or divergence) at these points of confluence before considering any action. Important Note: Trading involves significant risk. This methodology aims to identify higher probability setups, but no method guarantees success. Always use proper risk management and conduct your own analysis before making any trading decisions. This is shared for educational purposes. We hope this gives you a clearer insight into our analysis process! Follow us here on TradingView to see how we apply these concepts in our regular updates. Feel free to ask questions in the comments – we're all here to learn together. Want to Level Up? Join Shunya Trade’s Mentoring Program to master these strategies and sharpen your technical analysis skills. Trade safely! ----------------------------------------------------------------------------------------------- Here few Historical chart study's ----------------------------------------------------------------------------------------------- PriceAnalysis, TimeAnalysis, PriceAction, TechnicalAnalysis, SupportResistance, CandlestickPatterns, ChartPatterns, MarketStructure, TimeCycles, MarketTiming, TradingSignals, ReversalTrading, TradingStrategy, MarketAnalysis, TradingView, Forex, Stocks, Crypto, Trading, Investing, DayTrading, SwingTrading, MarketCycles, FibonacciTime, Gann, TradingLevels, PricePatterns
Disclaimer
Any content and materials included in Sahmeto's website and official communication channels are a compilation of personal opinions and analyses and are not binding. They do not constitute any recommendation for buying, selling, entering or exiting the stock market and cryptocurrency market. Also, all news and analyses included in the website and channels are merely republished information from official and unofficial domestic and foreign sources, and it is obvious that users of the said content are responsible for following up and ensuring the authenticity and accuracy of the materials. Therefore, while disclaiming responsibility, it is declared that the responsibility for any decision-making, action, and potential profit and loss in the capital market and cryptocurrency market lies with the trader.