Technical analysis by shoonya0000 about Symbol PAXG on 7/20/2025

shoonya0000
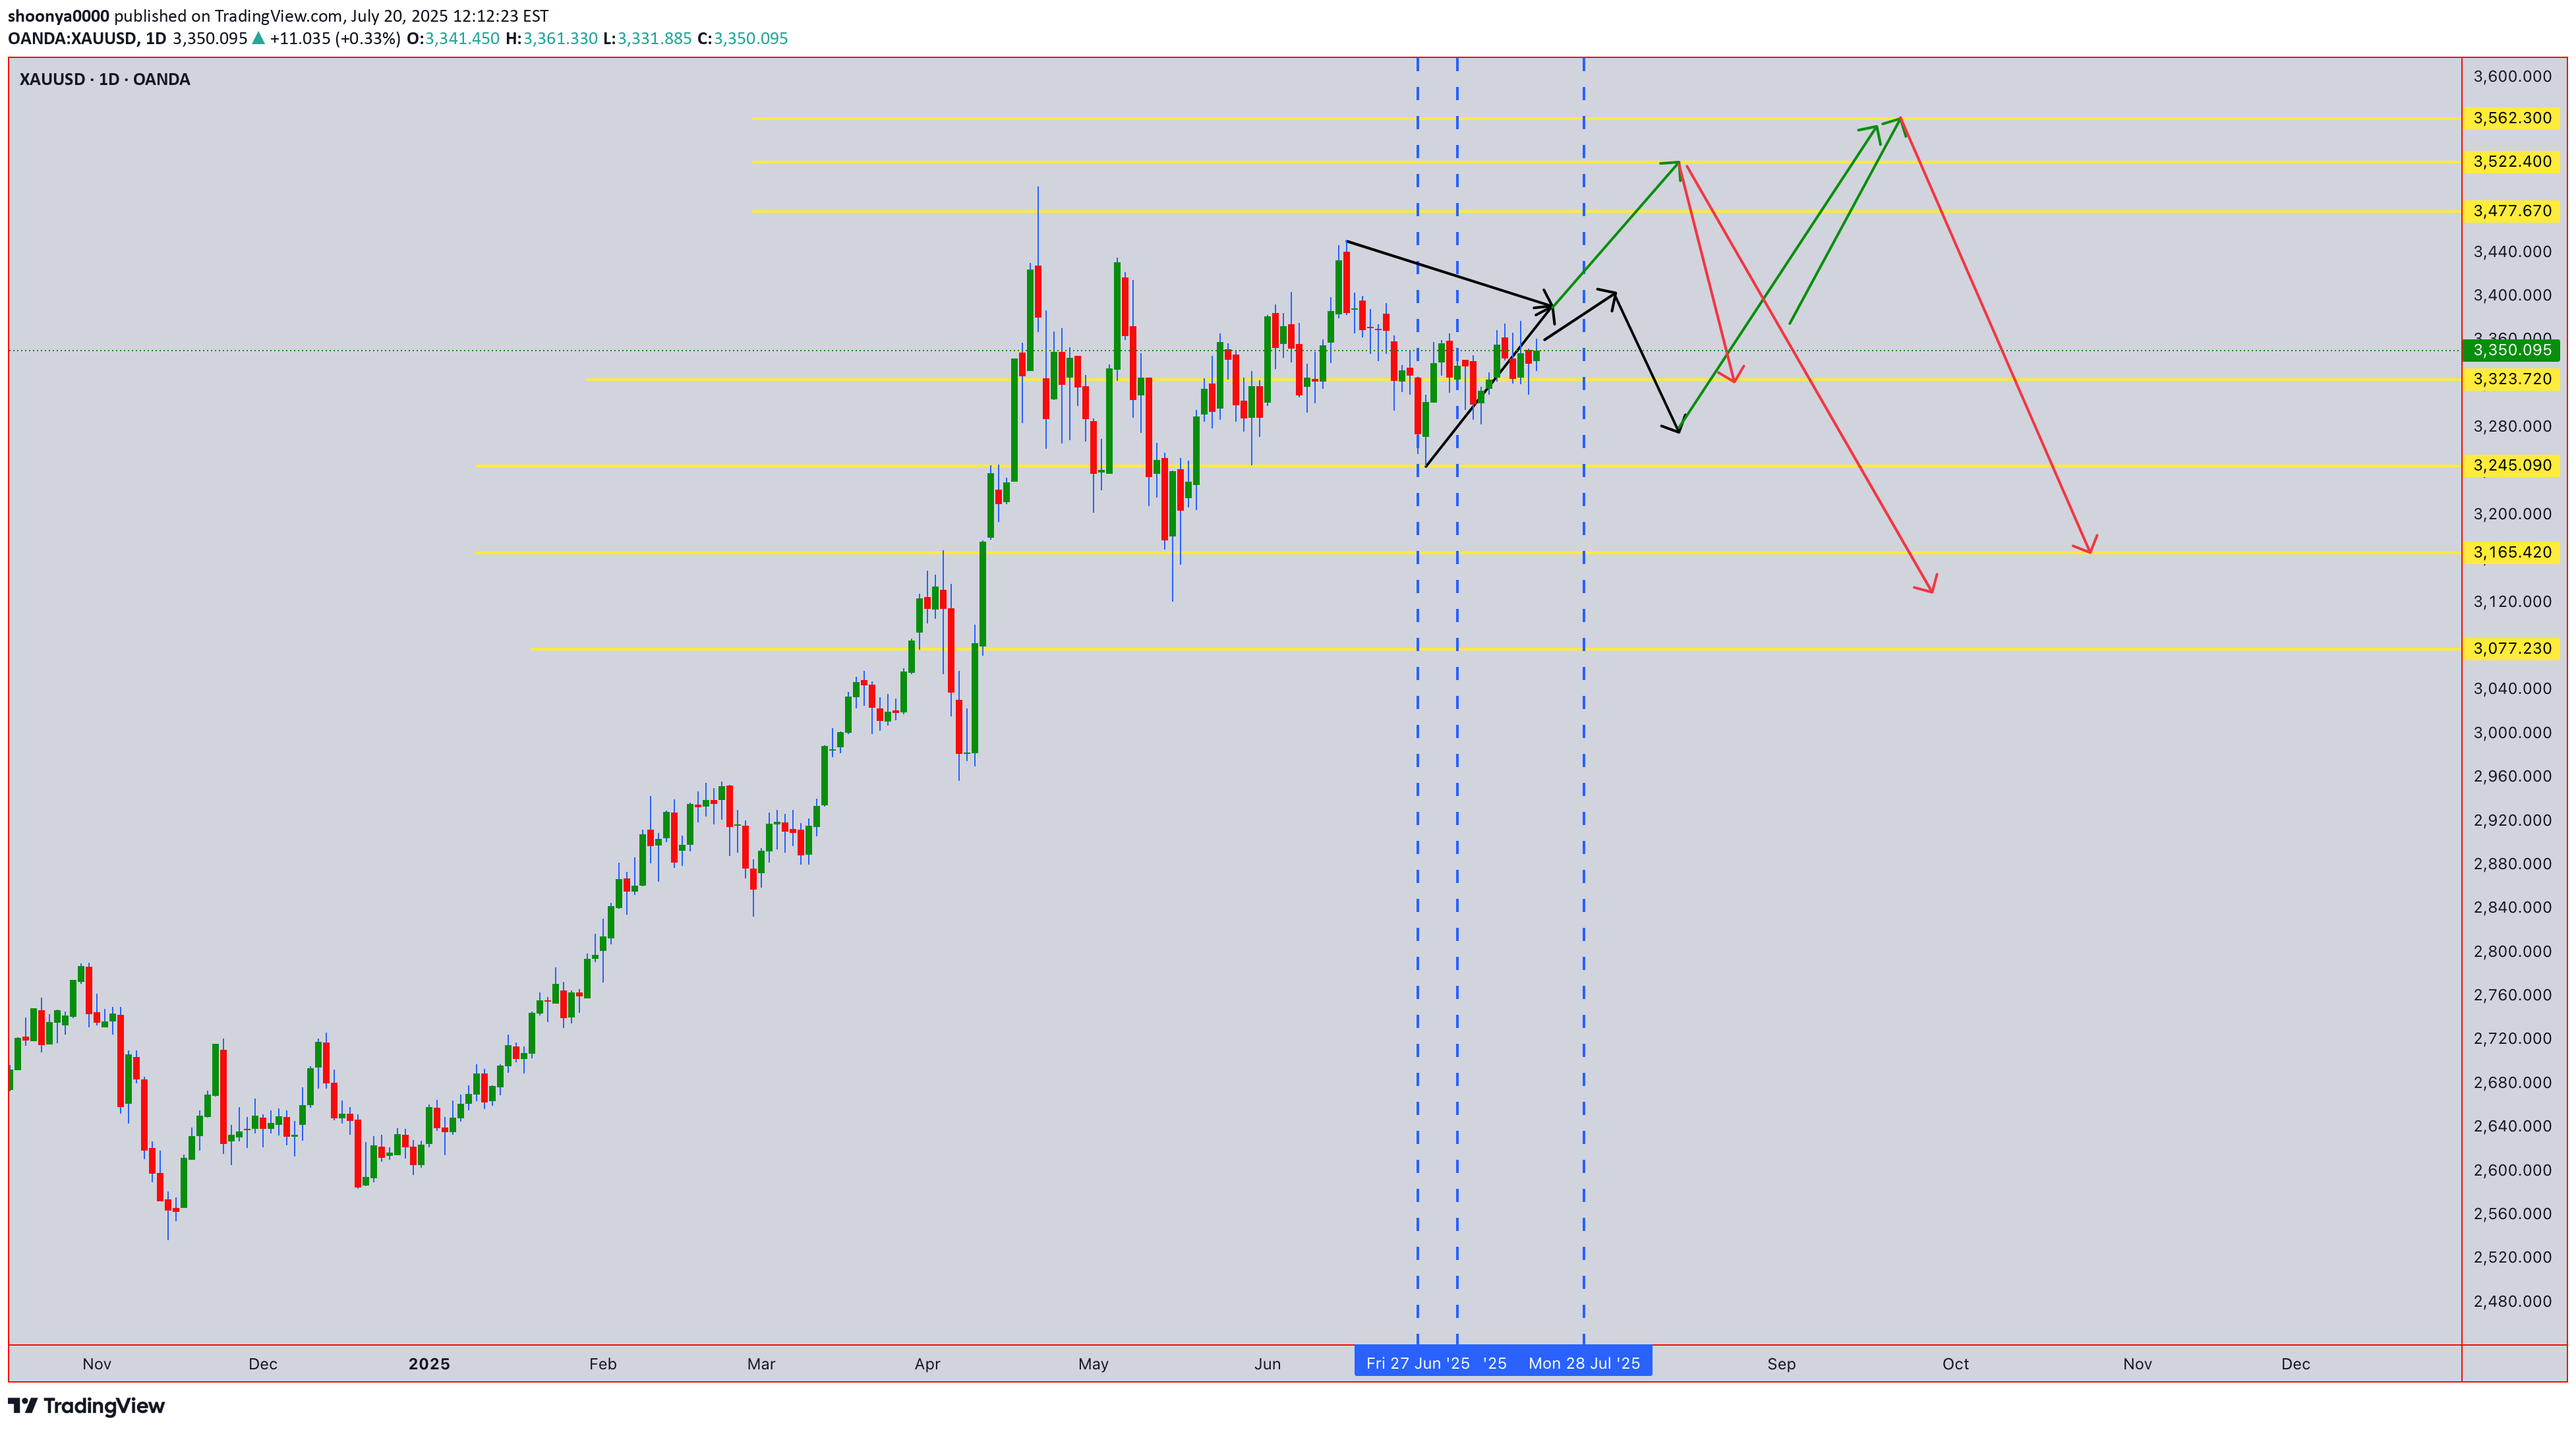
Current Price: $3,350.095 (Close: Friday, July 18th, 2025) UTC+4 Analysis Period : Next 24 Hours (July 21-22, 2025) UTC+4 Market Status: Weekend - Preparing for Monday Open 02:00AM 21st July 2025 EXECUTIVE SUMMARY - 24H OUTLOOK Primary Bias: Neutral to Bearish (Short-term) Key Resistance: $3,375 - $3,390 Critical Support: $3,285 - $3,300 Expected Range: $3,300 - $3,380 Volatility Level: Moderate to High CANDLESTICK PATTERN ANALYSIS Friday's Close Formation Pattern: Doji-like formation at resistance zone Significance: Indecision after testing $3,350+ levels Volume: Moderate - no strong conviction breakout Context: Failed to close decisively above $3,375 resistance Expected 24H Patterns Monday Gap: Potential gap down to $3,320-3,330 area Reversal Patterns: Watch for hammer/doji at support levels Continuation Signals: Break below $3,300 could trigger bearish continuation HARMONIC PATTERN ANALYSIS Current Harmonic Setup Primary Pattern: Potential Bearish Bat completing X: $3,285 (previous low) A: $3,390 (recent high) B: $3,320 (61.8% retracement) C: $3,375 (78.6% projection - current area) D (Target): $3,300-3,285 (88.6% completion zone) Fibonacci Levels (24H Focus) Golden Ratio Resistance: $3,375 (current test area) 61.8% Support: $3,320 78.6% Support: $3,300 88.6% Critical Support: $3,285 Pattern Completion Probabilities Bearish Bat Completion: 70% probability targeting $3,285-3,300 Bullish Cypher Setup: 30% if break above $3,390 ELLIOTT WAVE THEORY - 24H COUNT Primary Wave Count Macro Structure: Wave 5 of larger impulse possibly topping Current Sub-wave: Wave (c) of corrective structure Mini Count: 5-wave decline from $3,390 high in progress 24-Hour Wave Projection Wave 1: $3,390 → $3,320 (Completed) Wave 2: $3,320 → $3,360 (Completed - 50% retrace) Wave 3: $3,360 → $3,285 (In Progress - Target Area) Wave 4: $3,285 → $3,310 (Projected) Wave 5: $3,310 → $3,260 (Extended target) Critical Levels Wave 3 = 1.618 × Wave 1: $3,285 (Primary target) Invalidation: Above $3,390 (Wave 2 high) WYCKOFF THEORY - 24H PHASE Current Market Phase Phase Assessment: Distribution Phase C (Testing Supply) Composite Operator Action: Testing demand at $3,350 area Volume Analysis: Declining volume on recent rallies (bearish) Expected 24H Wyckoff Action Phase Transition: Moving toward Phase D (Markdown begins) Supply Test: Failed test at $3,375 confirms distribution Target: Initial markdown to $3,285-3,300 area Key Wyckoff Signals (24H) No Demand: Expected at current levels Selling Climax: Possible if break below $3,285 with high volume Automatic Rally: Dead cat bounce to $3,320-3,330 W.D. GANN THEORY - 24H ANALYSIS Square of Nine Analysis Current Position: 3350° on Gann wheel Next Cardinal Point: 3375° (90° angle - strong resistance) Support Angles: 3300° (natural support), 3285° (critical angle) Geometric Progression: $3,285 = perfect square root relationship Time Theory - 24H Cycle Natural Time Window: 24-hour cycle from Friday's high Critical Time: 14:00-16:00 UTC Monday (historical turning point) Lunar Influence: New moon phase approaching (bearish for commodities) Angle Theory 45° Line: Currently at $3,320 (rising support) 63.75° Line: $3,285 (steep support angle) 26.25° Line: $3,375 (resistance angle) Price Forecasting (Gann Methods) Primary Target: $3,285 (Square root of 81²) Secondary Target: $3,240 (Square root of 80²) Resistance: $3,375 (Square root of 82.5²) Time Forecasting Turn Time 1: 06:00 UTC Monday (18 hours from Friday close) Turn Time 2: 14:00 UTC Monday (26 hours from Friday close) Major Turn: 22:00 UTC Monday (34 hours - Fibonacci time) MULTI-TIMEFRAME INTRADAY ANALYSIS 5-Minute Chart Analysis Trend: Bearish momentum building Pattern: Lower highs, lower lows since Friday high Key Levels: Resistance: $3,360-3,365 Support: $3,330-3,335 RSI: Approaching oversold (35-40 range) Volume: Increasing on down moves 15-Minute Chart Analysis Structure: Bearish flag formation Breakdown Level: Below $3,340 Target: $3,300-3,310 (flag pole projection) Moving Averages: Price below EMA 20 ($3,358) MACD: Bearish crossover confirmed 30-Minute Chart Analysis Primary Trend: Corrective phase active Chart Pattern: Descending triangle Apex: Around $3,335-3,340 Breakout Direction: 65% probability downward Volume Profile: Heavy selling at $3,350-3,375 1-Hour Chart Analysis Major Structure: ABC correction in progress Current Position: C-wave development Fibonacci Target: $3,285 (127.2% extension) Bollinger Bands: Price touching lower band Stochastic: Oversold but no divergence yet 4-Hour Chart Analysis Macro Trend: Still bullish above $3,200 Correction Depth: 23.6% retracement maximum expected Support Zone: $3,280-3,300 (confluences) Resistance Zone: $3,375-3,390 (proven strong) Ichimoku: Price approaching cloud support TECHNICAL INDICATORS MATRIX Momentum Indicators RSI (4H): 42 (Neutral-Bearish) RSI (1H): 35 (Oversold approaching) Stochastic: %K: 28, %D: 35 (Oversold) Williams %R: -75 (Strong oversold) Trend Indicators MACD (4H): Bearish crossover pending ADX: 28 (Moderate trend strength) Parabolic SAR: $3,365 (Sell signal if broken) Volume Indicators OBV: Declining (distribution pattern) Volume Rate of Change: Negative Accumulation/Distribution: Slight distribution KEY SUPPORT & RESISTANCE LEVELS (24H) Immediate Resistance Levels R1: $3,365 (Previous support turned resistance) R2: $3,375 (Major psychological & Gann resistance) R3: $3,390 (Recent swing high) R4: $3,410 (Extended resistance) Critical Support Levels S1: $3,330 (Immediate support) S2: $3,300 (Psychological & Fibonacci) S3: $3,285 (Major harmonic & Gann target) S4: $3,260 (Extended support) 24-HOUR TRADING SCENARIOS Scenario 1: Bearish Breakdown (60% Probability) Trigger: Break below $3,330 with volume Target 1: $3,300-3,310 Target 2: $3,285-3,290 Extended Target: $3,260-3,270 Stop Loss (Shorts): Above $3,370 Scenario 2: Range-Bound Consolidation (25% Probability) Range: $3,320-3,375 Strategy: Fade extremes Buy Zone: $3,320-3,330 Sell Zone: $3,365-3,375 Breakout Confirmation: Volume spike Scenario 3: Bullish Reversal (15% Probability) Trigger: Break above $3,375 with volume Target 1: $3,390-3,400 Target 2: $3,410-3,420 Invalidation: Below $3,285 RISK FACTORS & CATALYSTS (24H) Bearish Catalysts US Dollar strength continuation Risk-off sentiment from geopolitical tensions Profit-taking ahead of weekend Technical breakdown confirmation Bullish Catalysts Safe-haven demand surge US Dollar weakness Central bank buying speculation Technical oversold bounce High-Impact Events (Next 24H) Asian market opening sentiment US Dollar Index movement Cryptocurrency correlation effects Weekend gap analysis TRADING RECOMMENDATIONS (24H) For Scalpers (5M-15M) Strategy: Fade bounces to resistance Entry: $3,355-3,365 area Target: $3,335-3,340 Stop: $3,375 Risk/Reward: 1:2 For Swing Traders (1H-4H) Primary Setup: Short on retracement Entry Zone: $3,350-3,360 Target 1: $3,300 Target 2: $3,285 Stop Loss: $3,385 Conservative Approach Wait for: Clear breakdown below $3,330 Entry: $3,325 (confirmation) Target: $3,285-3,290 Stop: $3,345 CONFLUENCE FACTORS Bearish Confluence at $3,285 Harmonic Bat pattern completion (88.6% level) Gann Square of Nine critical angle Elliott Wave 3 = 1.618 × Wave 1 target Fibonacci 78.6% retracement level Previous significant support area Wyckoff markdown initial target Resistance Confluence at $3,375 Gann 90-degree angle resistance Harmonic pattern resistance Elliott Wave corrective high Previous breakout level Psychological round number FINAL 24H FORECAST SUMMARY Expected Price Action: Controlled decline toward $3,285-3,300 support zone with potential for brief consolidation before further weakness. Primary Targets (Downside): First: $3,300-3,310 Second: $3,285-3,290 Extended: $3,260-3,270 Key Invalidation: Sustained break above $3,375 would shift bias bullish toward $3,390-3,410. Risk Management: Position sizing should be conservative due to high volatility expectations and weekend gap risks. Probability Assessment: 60% - Bearish scenario 25% - Sideways consolidation 15% - Bullish reversal Disclaimer: This analysis is for educational purposes only. Gold trading involves substantial risk. Always use proper risk management and never risk more than you can afford to lose. Volume profile resistance
