saminsalehi85
@t_saminsalehi85
What symbols does the trader recommend buying?
Purchase History
پیام های تریدر
Filter
Signal Type
saminsalehi85
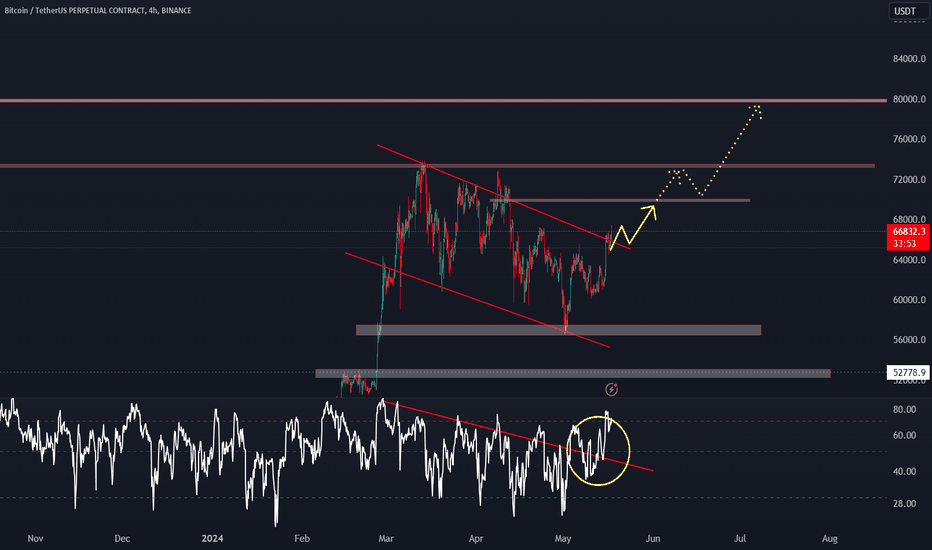
Bitcoin Daily Breakout Analysis Bitcoin has successfully broken out of the daily range of $66,000, indicating a strong upward momentum. This breakout is also confirmed by the RSI indicator, which has broken out of its downtrend line on the daily chart. Considering the timeframe after the halving and the current market movements, it appears that Bitcoin's price is poised to rise further. Key resistance levels to watch: First resistance: $69,500 Next resistance: $71,600 Major resistance: $80,000 Keep an eye on these levels as Bitcoin continues its upward trajectory.
saminsalehi85
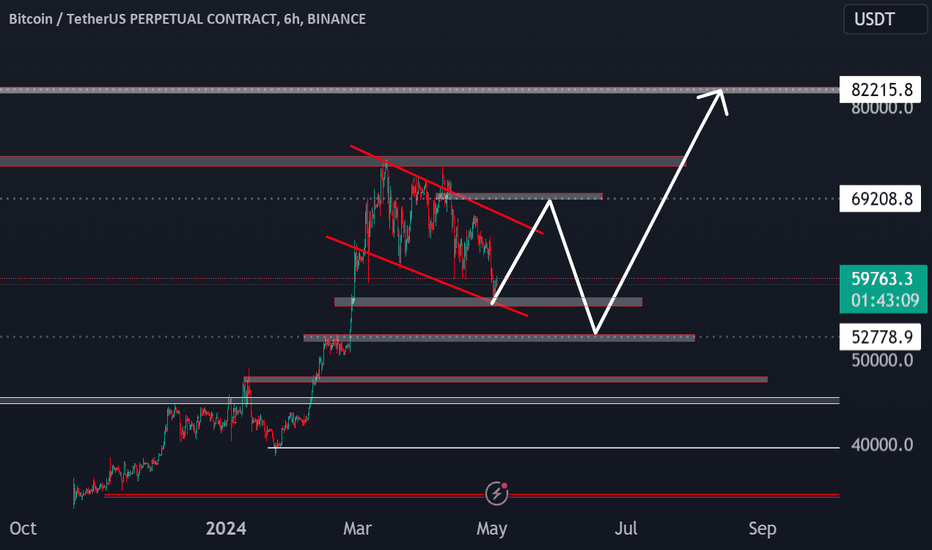
The Bitcoin chart is currently exhibiting a bullish flag pattern, indicating a potential continuation of the uptrend. Although the price briefly broke below the support level, it has since recovered and returned to the support zone. This price action suggests that the earlier breakdown was a false signal, as evidenced by the chart. My analysis indicates that this could present a buying opportunity, with the potential for further upward movement in the near term.
saminsalehi85
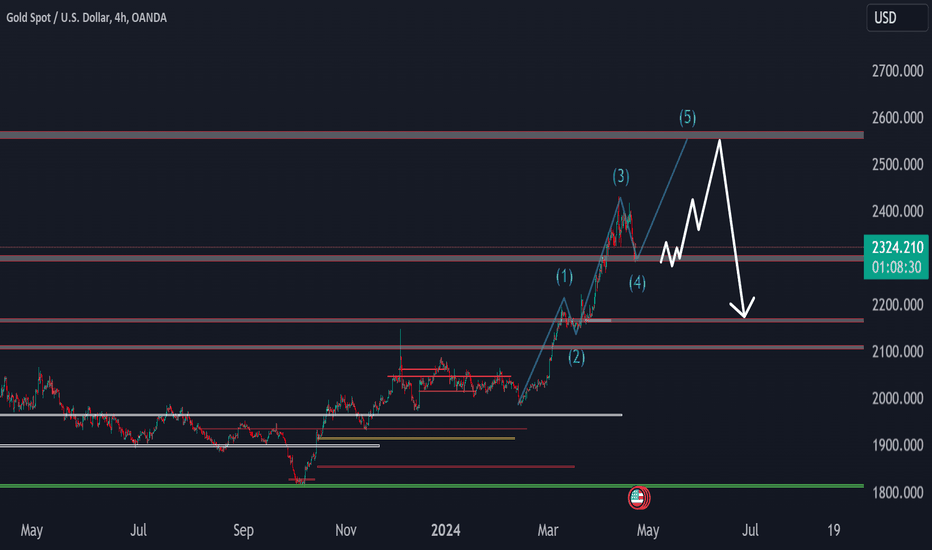
The Gold chart is currently trending upwards, with a strong support zone between $2,300 and $2,980. Our last target for this trend is in the range of $2,550 to $2,570. While there have been several smaller waves within this uptrend, I am waiting for the price to reach the final target before considering a long position. My entry for a long position in gold is at $2,300, with a stop loss set at $2,275.
saminsalehi85
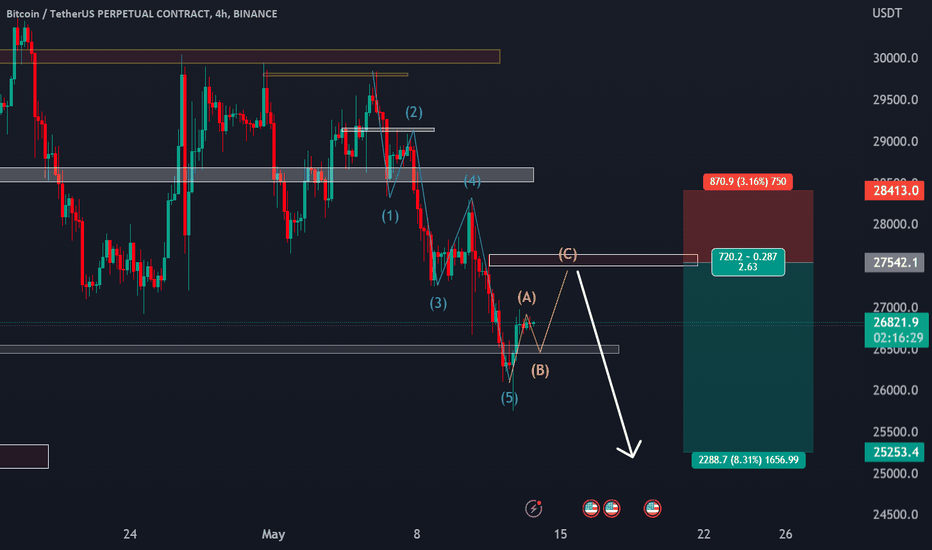
In this comprehensive Bitcoin analysis, we delve into the intricacies of the Elliott Wave Theory applied to the 4-hour time frame. The price movement of Bitcoin reveals a discernible downtrend, stretching from 29,800 to 25,800. This downtrend represents the initial wave of a larger, more significant wave structure. Within this initial wave, we observe five sub-waves moving in a downward direction. These sub-waves, marked by their distinct peaks and troughs, provide valuable insights into the current market dynamics. Additionally, within this wave structure, we encounter an A-B-C corrective wave, which adds further complexity to the analysis. Drawing on the principles of Fibonacci retracements, we meticulously analyze the key levels of support and resistance, allowing for a more precise understanding of potential price reversals. The Fibonacci sequence aids in identifying areas where the market may experience a correction, thereby guiding traders in their decision-making processes. By incorporating Elliott Wave Theory and the concept of corrective waves, this analysis offers a comprehensive perspective on the Bitcoin market. Traders and investors can gain a deeper understanding of the current price movements, potential future trends, and crucial levels to watch out for.
saminsalehi85
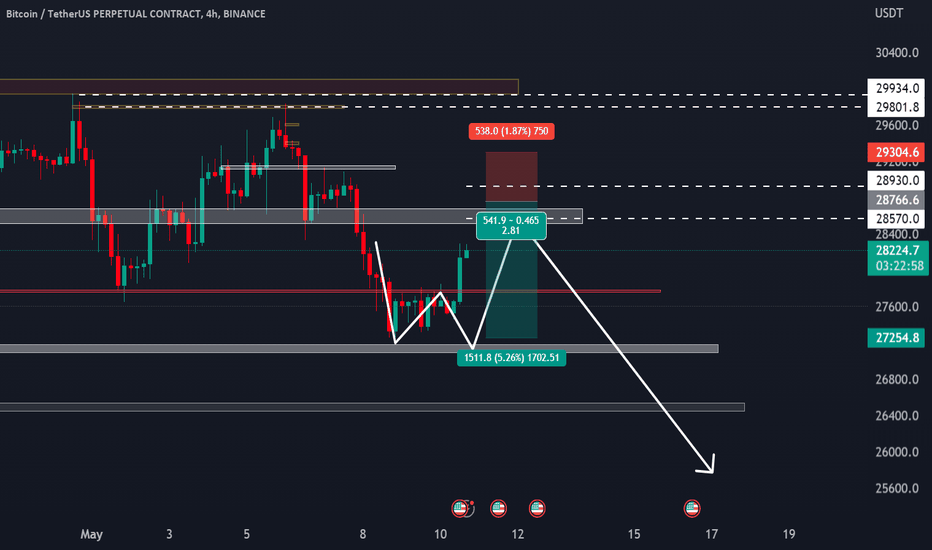
#BTC #bitcoin #crypto youtu.be/oFdtIgAKfSY we explore a short position opportunity in Bitcoin, leveraging a combination of technical analysis indicators. We focus on the significant bearish signals such as the emergence of a caps pattern and the break of the uptrend line. Additionally, we observe key resistance levels at 29,000 and 30,000 on the daily chart, which have been discussed in detail in a related YouTube channel. By analyzing the caps pattern, a bearish technical formation characterized by three consecutive peaks, we identify a potential reversal in Bitcoin's price trend. Moreover, the break of the uptrend line suggests a shift in market sentiment from bullish to bearish, further strengthening the case for a short position. To support our analysis, we refer to the YouTube channel where these patterns and levels have been thoroughly explained. This resource provides additional context and insights into the technical factors influencing the market, aiding traders in making informed decisions. Please note that trading involves risks, and it is essential to exercise caution, conduct thorough research, and use appropriate risk management strategies when considering any investment or trading opportunity.
saminsalehi85
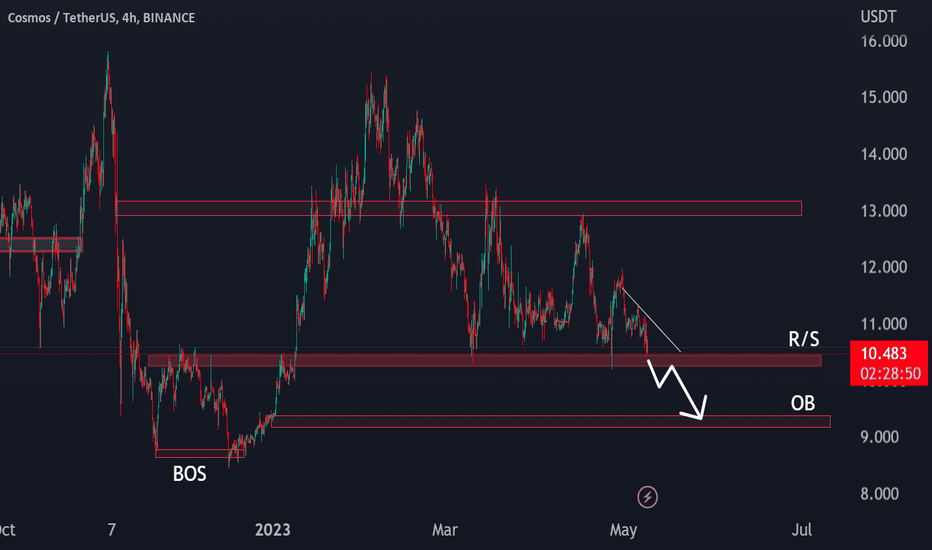
important Level for Trade and investment, Fresh Order Block Not Financial advice
saminsalehi85
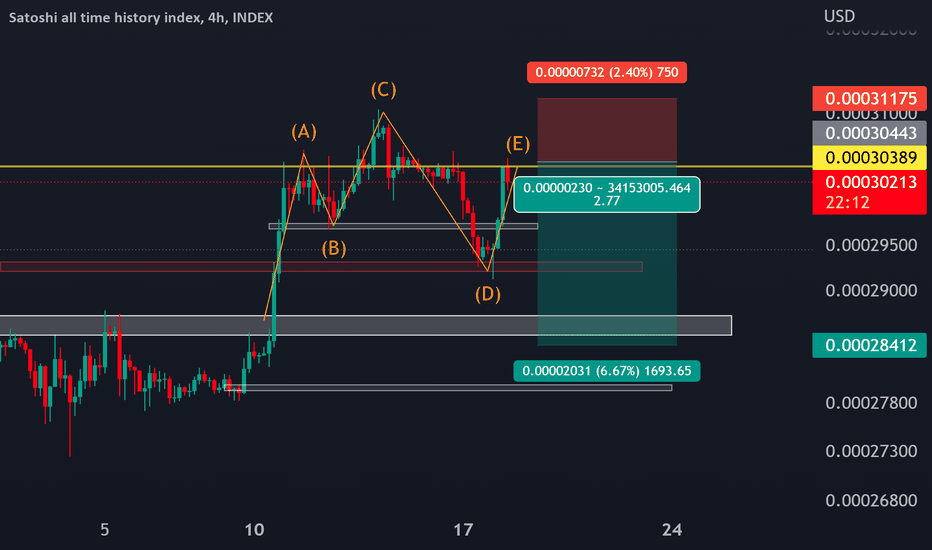
QM Pattern Max pain level of QM divergence in RSI High risk
saminsalehi85
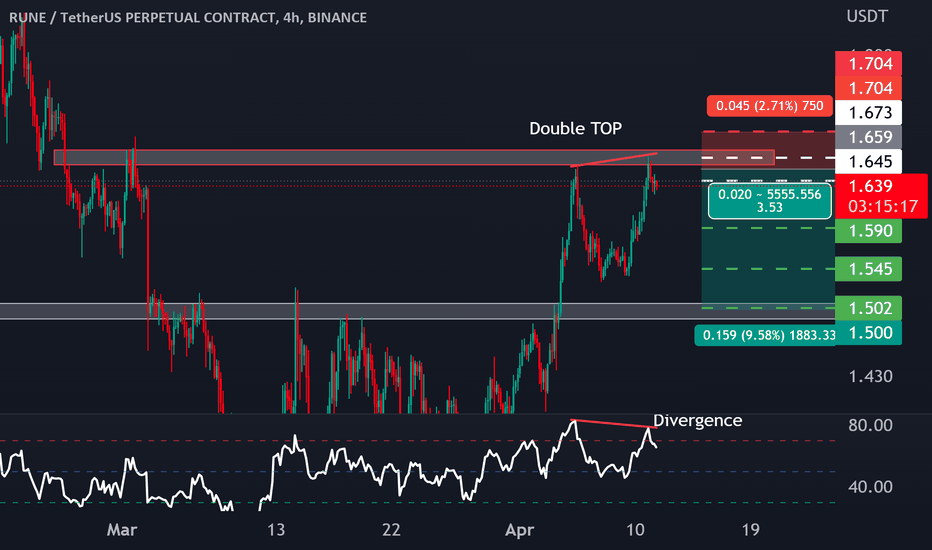
Time: 4H Important S/R Double TOP Divergence in RSI
saminsalehi85
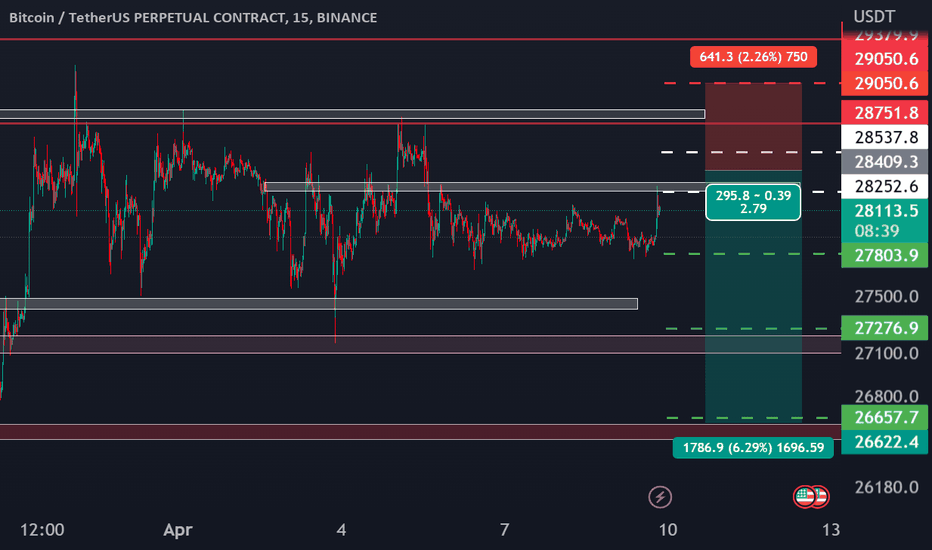
divergence in 4H divergence in daily important resistance Overbuy in RSI
saminsalehi85
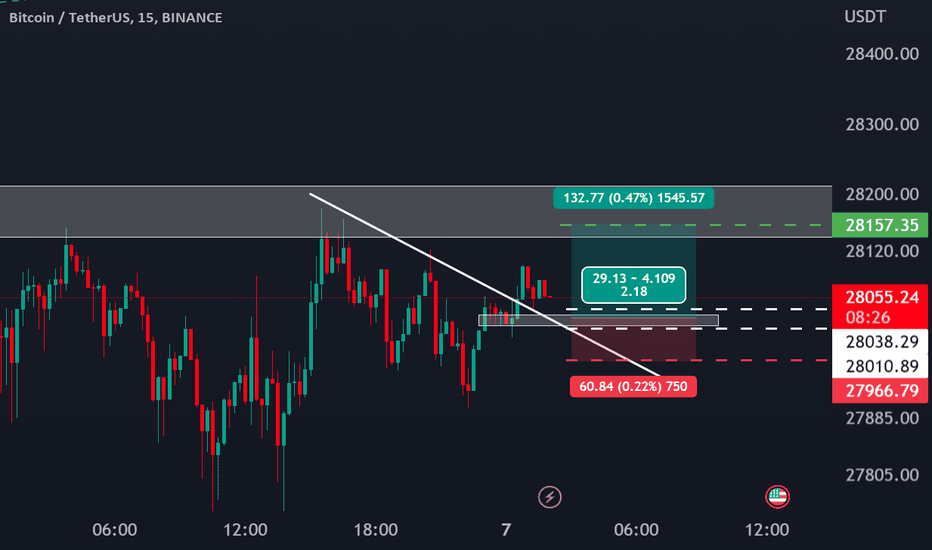
Long position for bitcoin Break out the down-trend line Divergence in 4 H time frame
Disclaimer
Any content and materials included in Sahmeto's website and official communication channels are a compilation of personal opinions and analyses and are not binding. They do not constitute any recommendation for buying, selling, entering or exiting the stock market and cryptocurrency market. Also, all news and analyses included in the website and channels are merely republished information from official and unofficial domestic and foreign sources, and it is obvious that users of the said content are responsible for following up and ensuring the authenticity and accuracy of the materials. Therefore, while disclaiming responsibility, it is declared that the responsibility for any decision-making, action, and potential profit and loss in the capital market and cryptocurrency market lies with the trader.