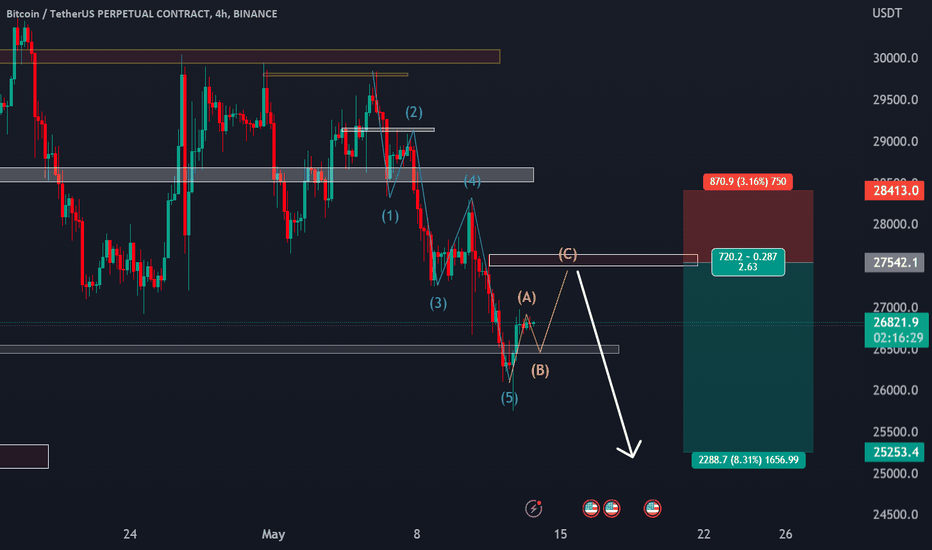
Technical analysis by saminsalehi85 about Symbol BTC on 5/13/2023
saminsalehi85

In this comprehensive Bitcoin analysis, we delve into the intricacies of the Elliott Wave Theory applied to the 4-hour time frame. The price movement of Bitcoin reveals a discernible downtrend, stretching from 29,800 to 25,800. This downtrend represents the initial wave of a larger, more significant wave structure. Within this initial wave, we observe five sub-waves moving in a downward direction. These sub-waves, marked by their distinct peaks and troughs, provide valuable insights into the current market dynamics. Additionally, within this wave structure, we encounter an A-B-C corrective wave, which adds further complexity to the analysis. Drawing on the principles of Fibonacci retracements, we meticulously analyze the key levels of support and resistance, allowing for a more precise understanding of potential price reversals. The Fibonacci sequence aids in identifying areas where the market may experience a correction, thereby guiding traders in their decision-making processes. By incorporating Elliott Wave Theory and the concept of corrective waves, this analysis offers a comprehensive perspective on the Bitcoin market. Traders and investors can gain a deeper understanding of the current price movements, potential future trends, and crucial levels to watch out for.