
sahandm99
@t_sahandm99

What symbols does the trader recommend buying?
Purchase History
پیام های تریدر
Filter
Signal Type
sahandm99
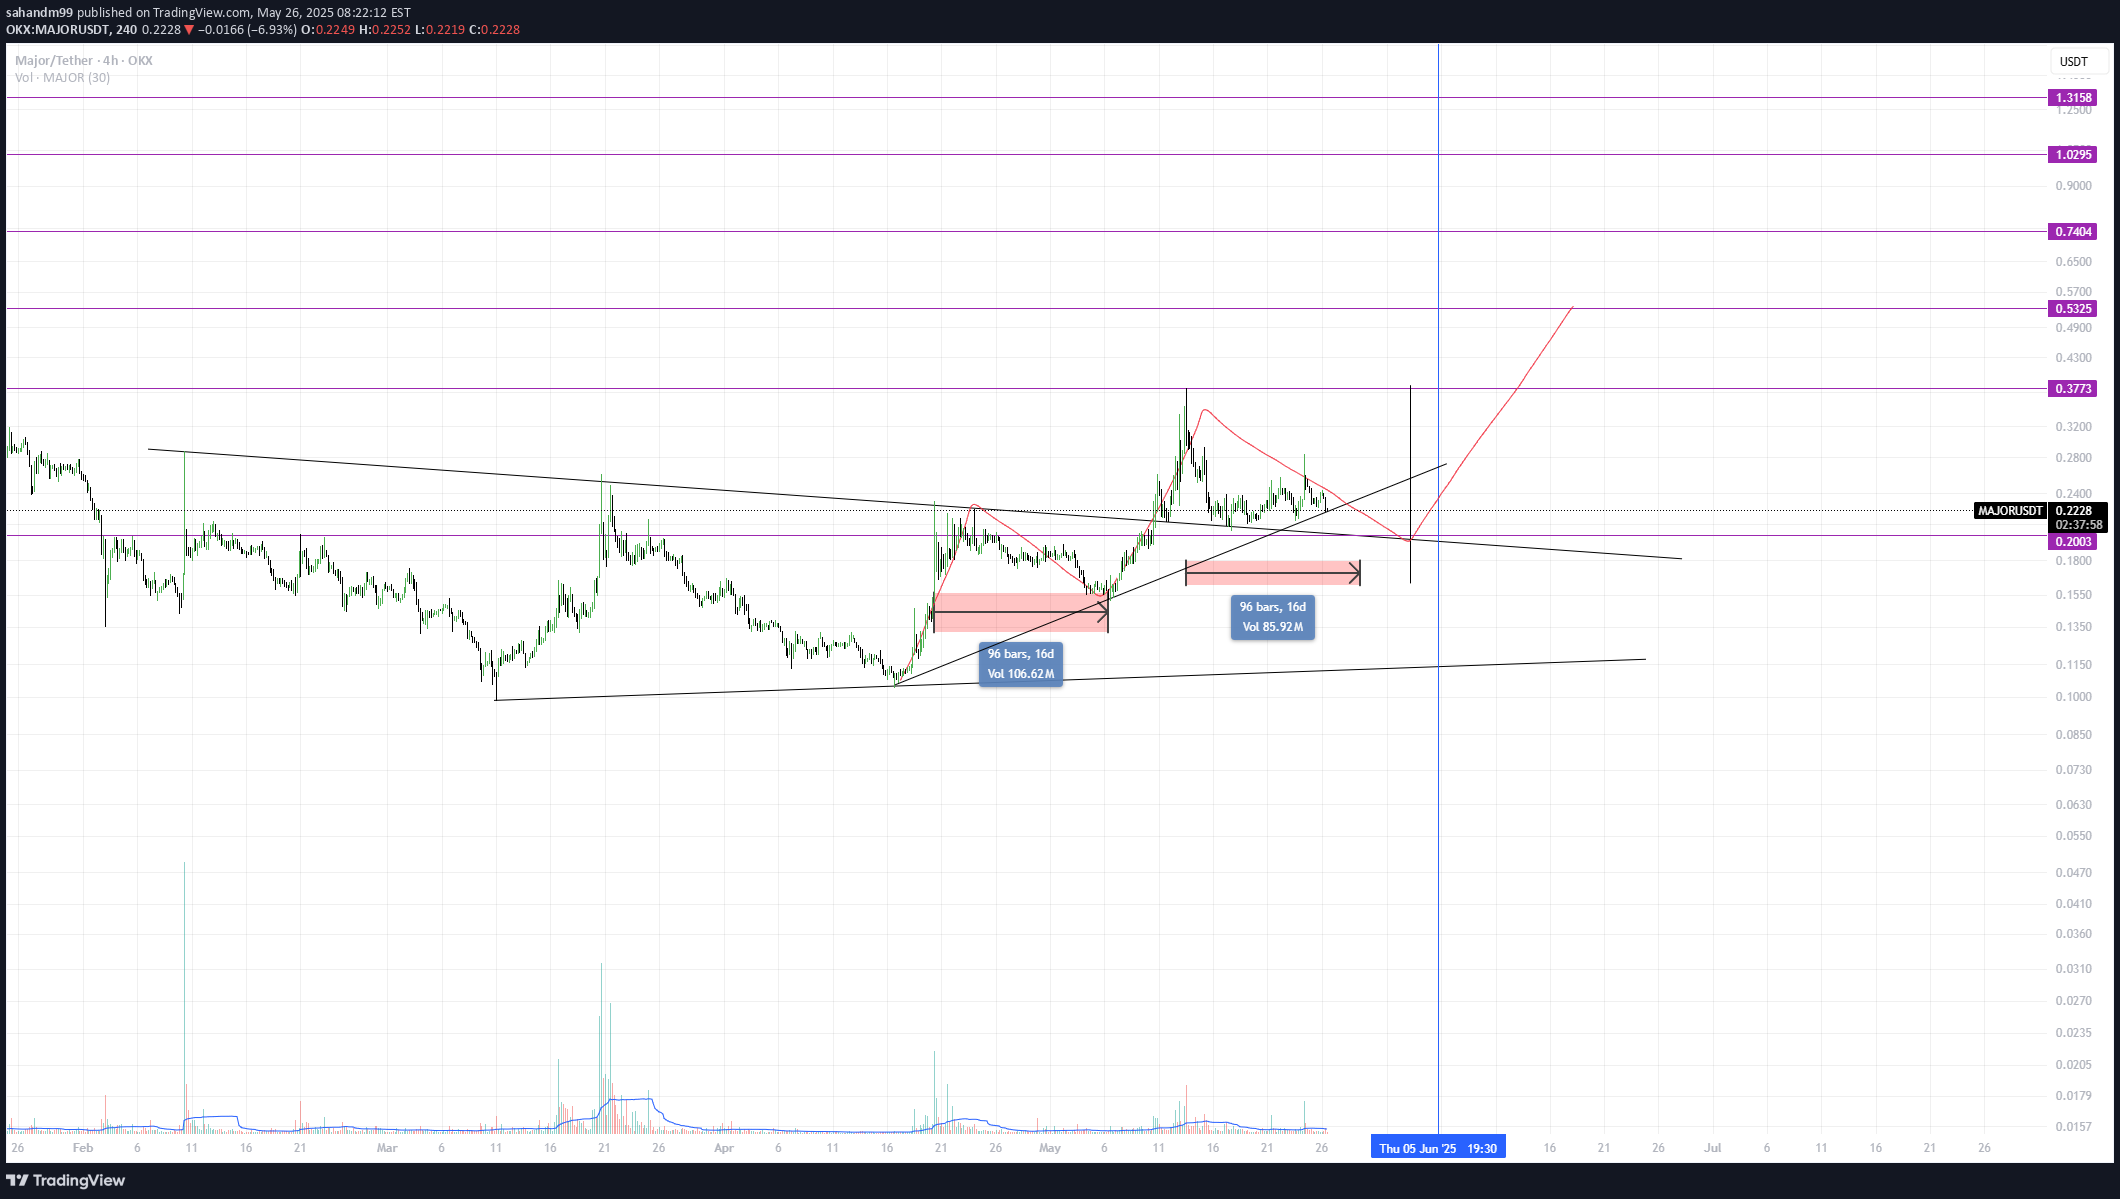
Simple Analysis base on chart pattern times. $0.2 was a concrete wall for major and broke successfully. Now 0.2 is a strong support and must not close daily candle below it.
sahandm99
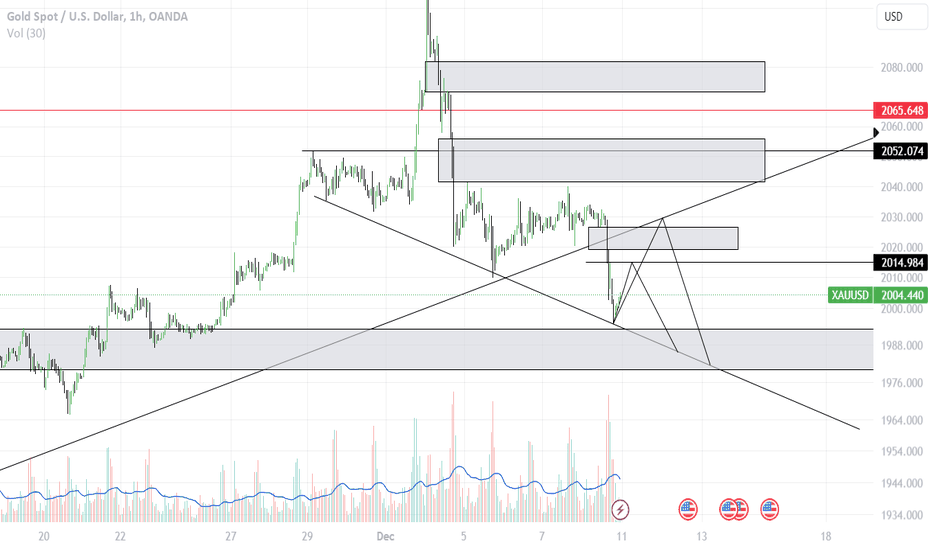
As we can see a trendline we had is now lost and a pullback is possible. So we have 2 ways to go. 1. a 2014 retest and continue the downward path or a complete pullback and retest the trendline and then continue the downward path. Please see my latest analysis on Gold on my profile so you can follow my analysis on long term gold. Stay safe
sahandm99
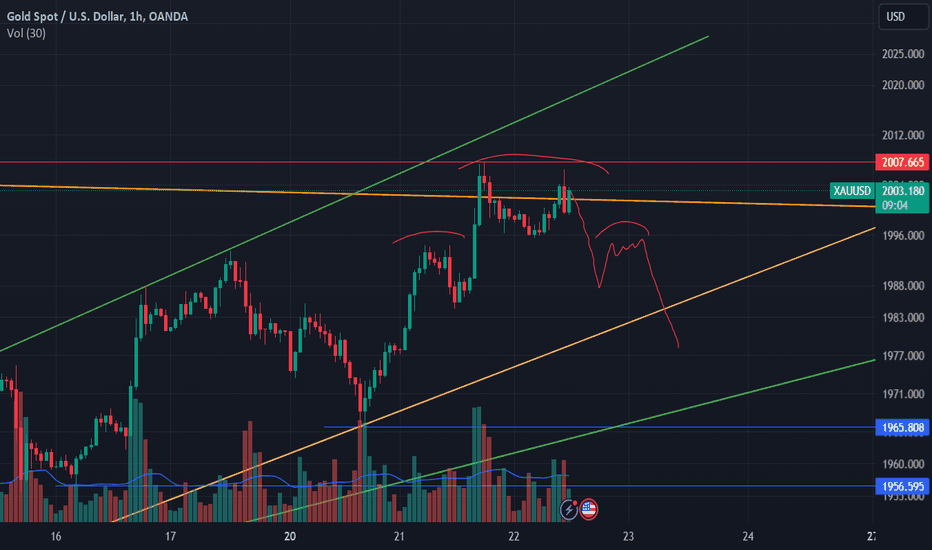
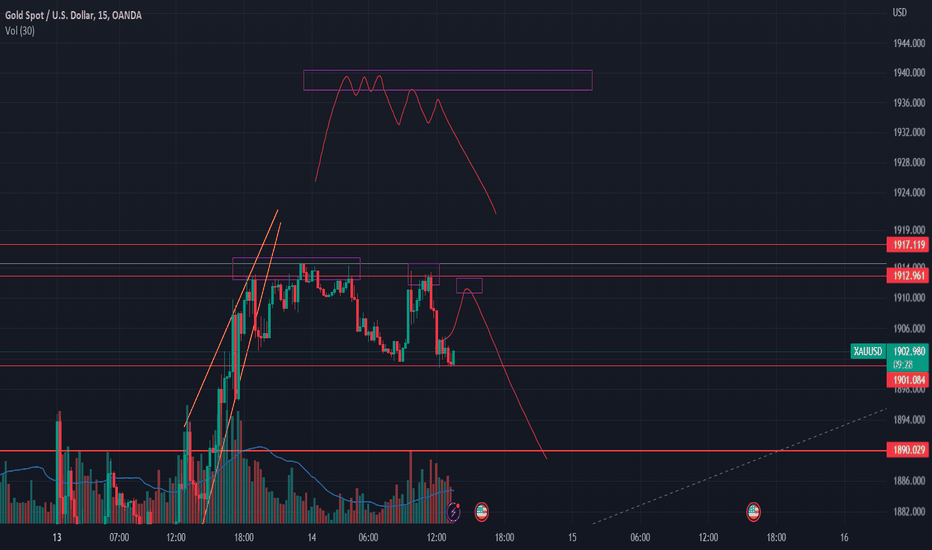
Hello guys, Hope you are doing well. A H&S is possible. This is my idea about xauusd short term. Please consider my other analysis on my page so you can find out the roadmap I think about. Good luck
sahandm99
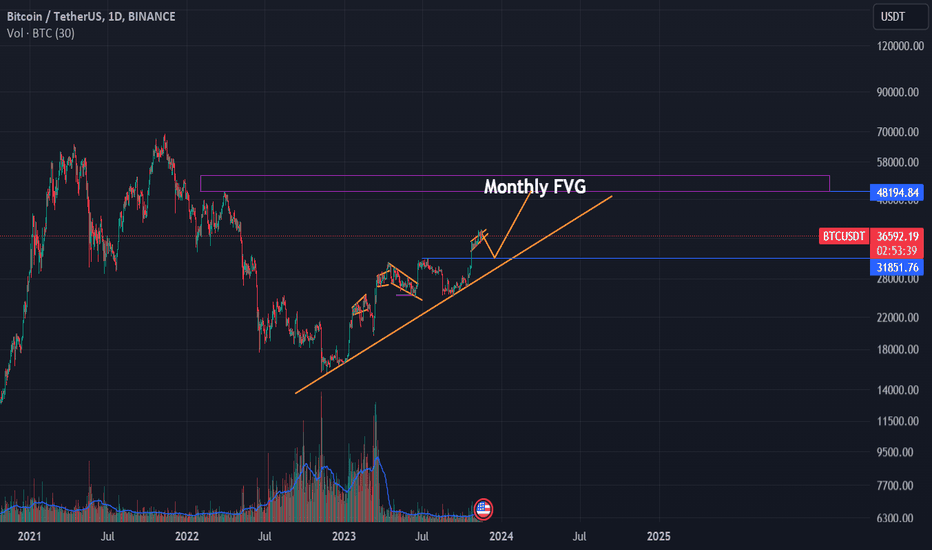
As we can see we have a Monthly FVG that could act like a magnet for price. It's about 48-53k . I think we just started a short term correction to 4H FVGs and then if the orange line holds the price then we will definitely reach 48-53 k and that must be the last target till Halving.
sahandm99
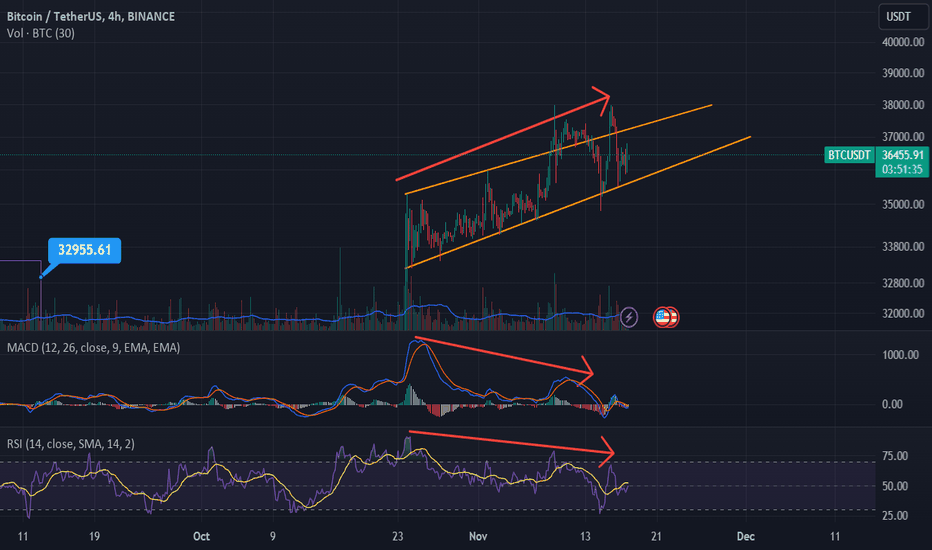
Hello, Just pay attention to 4H divergences. That's it. Also we have a wedge pattern that could be the last breathes of BTC for now. Do not FOMO
sahandm99
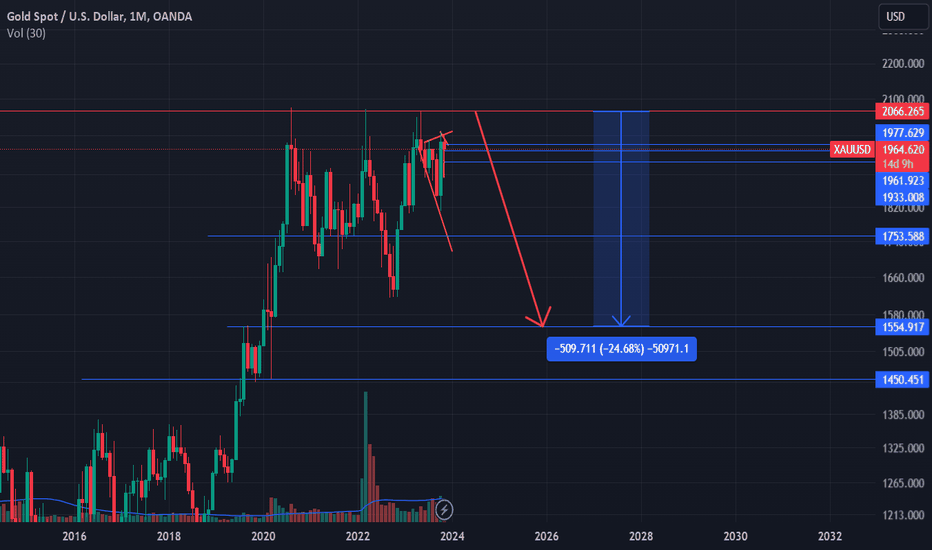
Hello there, It is just a personal opinion and please do not act base on it. As we can see on monthly chart, we had 3 try to break the resistance and failed every time. just use a Fibo Ret to see 127.2 to 138.7 levels. It is on 1475 to 1550 dollar. So consider it on mind it would not impossible to drop to 1500$ but it highly improbable. Have fun and make the right decision.
sahandm99
Hope you guys are well I have an idea about selling Gold. I think we have a Return to Supply pattern here and I think we can get a short position to 1870$. I'll be happy to share your ideas with me too
sahandm99
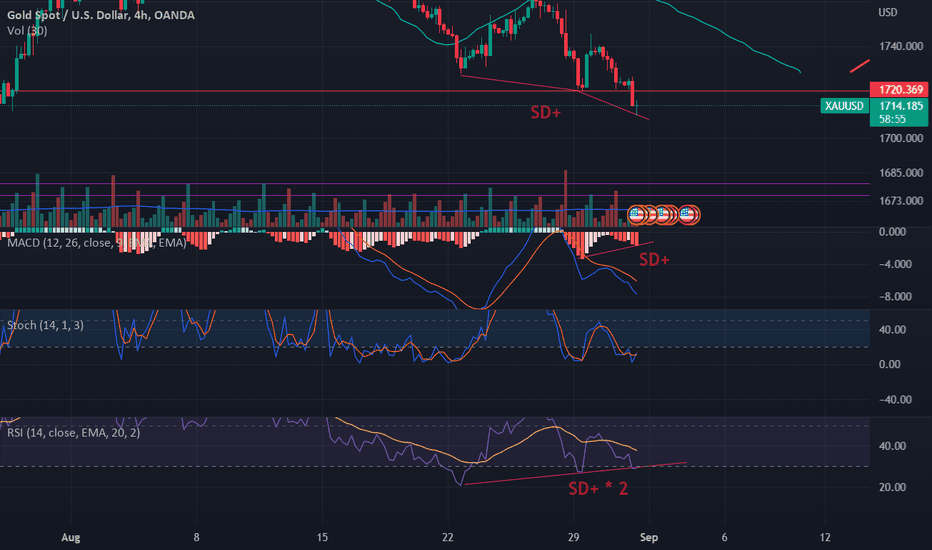
Hey there, Please first of all note that this analyse is my personal opinion and please do not open any position on that. Specifically we can see a Strong divergence on H4 timeframe on #xauusd chart. Maybe price see some lows from here but in the end price will go higher because of strong divergences we have. I will be happy if you share your ideas with me too. sincerely
sahandm99
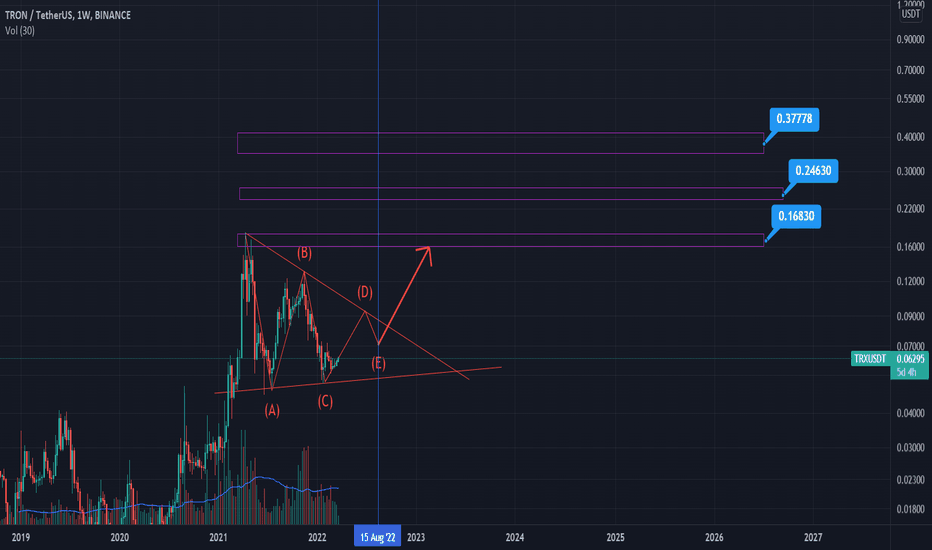
Hello, Hope you all doing well well ! Lets analyse the TRX on Weekly timeframe for a long term investment. :) It seems that price is making a triangle with 5 waves ABCDE. According to "fib time zone" tool, we have a important time on august 2022 that it can be the end of E wave. ( last wave ). Then price will increase to the targets which I marked on the chart. Don't forget the TRX burning inception. Be aware of token burning as well. It can help a lot in the market cap. 3/23/2022 **This analysis is not an incentive to buy or sell and is purely educational.**Hey guys. Hope you all doing well. Just to remember the TRX roadmap
sahandm99
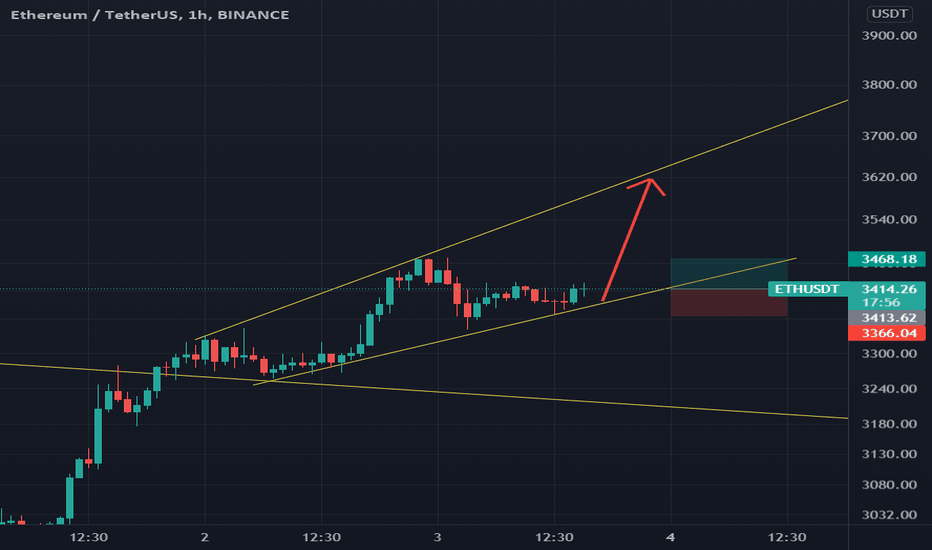
Just an easy look. 2 Trend lines. a Bullish candle on bottom of upward trend. Buy high, Sell Higher. **Please analyse the chart by yourself and do not trade with my analyse.**
Disclaimer
Any content and materials included in Sahmeto's website and official communication channels are a compilation of personal opinions and analyses and are not binding. They do not constitute any recommendation for buying, selling, entering or exiting the stock market and cryptocurrency market. Also, all news and analyses included in the website and channels are merely republished information from official and unofficial domestic and foreign sources, and it is obvious that users of the said content are responsible for following up and ensuring the authenticity and accuracy of the materials. Therefore, while disclaiming responsibility, it is declared that the responsibility for any decision-making, action, and potential profit and loss in the capital market and cryptocurrency market lies with the trader.