
phaneth2014
@t_phaneth2014

What symbols does the trader recommend buying?
Purchase History
پیام های تریدر
Filter
تحلیل ساختار بیت کوین: سقوط به ۷۷,۰۰۰ دلار محتمل است؟
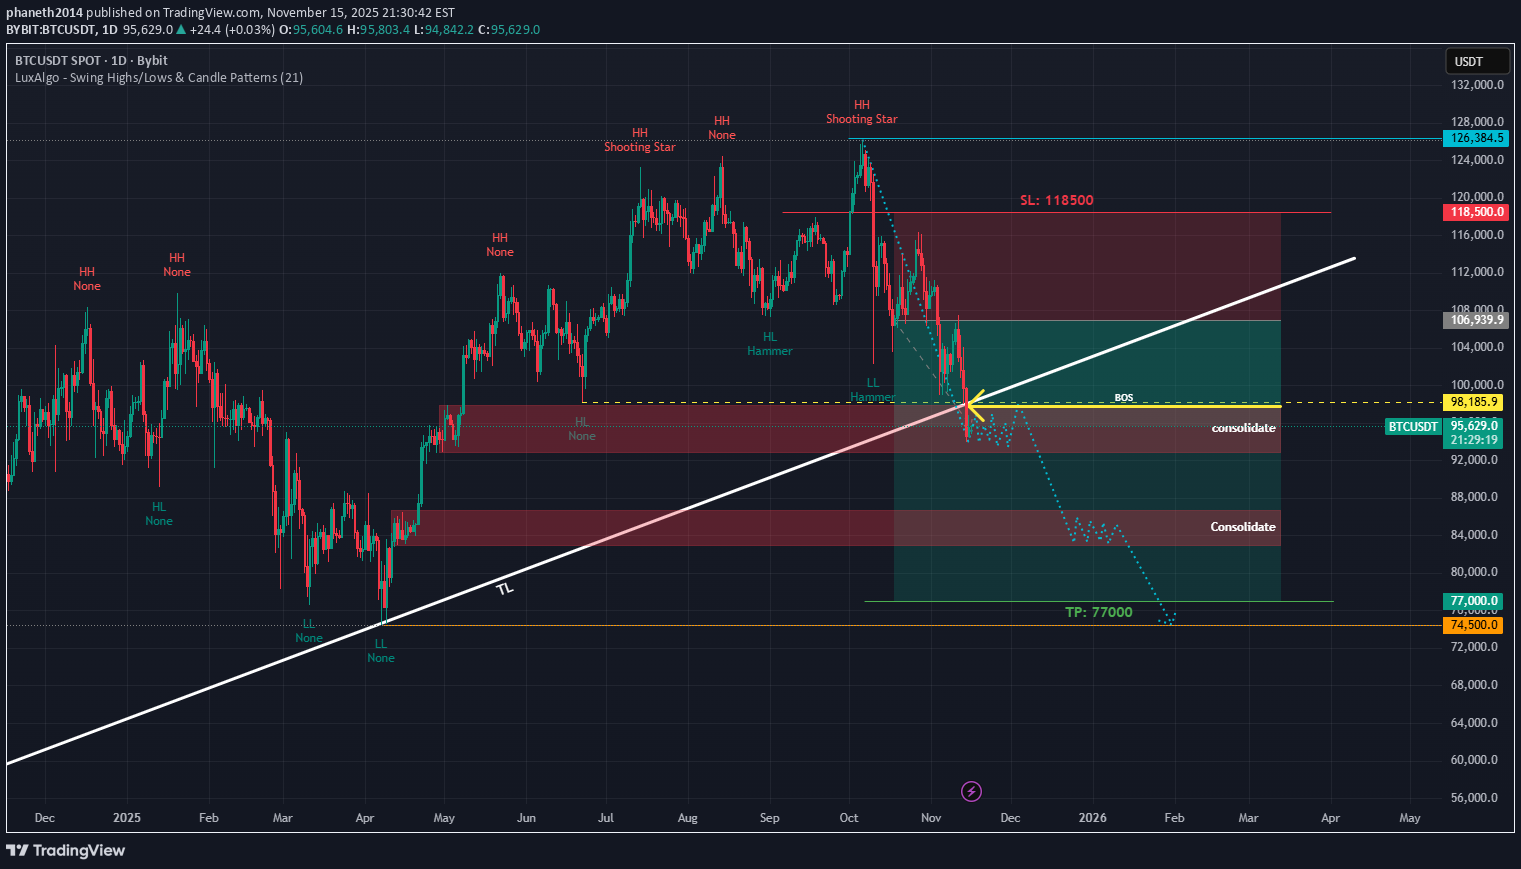
✅ 1. Market Structure (1D Timeframe) My chart shows: 🔹 Lower Low (LL) recently formed This confirms bearish structure, since before that we had a Higher Low (HL). The LL breaks the bullish trend. 🔹 Multiple Shooting Stars at the top This shows strong distribution (smart money selling). The rejection near 126k was the macro top. 🔹 BOS (Break of Structure) at ~98,186 I marked this correctly. Breaking this level initiates a new bearish cycle. ________________________________________ ✅ 2. Trendline Break (Big Signal) My long-term ascending trendline (TL) was broken decisively with a strong bearish candle. This is a major indication of: •Bullish trend ending •Smart money exiting •Bearish continuation expected A retest of the trendline may happen, but usually after a TL break, BTC continues lower for weeks. ________________________________________ ✅ 3. Current Price Action (95,447 area) Price is sitting inside my red supply/consolidation zone, which aligns with: •Prior HL •BOS level •Strong liquidity zone This is why I see consolidation — market is deciding whether to: A) Retest the TL again (short-term up) or B) Continue dumping toward demand below Given my structure: B is more likely. ________________________________________ 🟥 4. Bearish Scenario (Most Likely) This follows my dotted projection and makes sense with the chart. BTC likely does: 1.Small bounce to retest 98,000 – 100,000 oThis is BOS retest oThis is supply oThis is also TL retest zone oThis is where sellers reload 2.Failure to break TL → major drop begins 3.First stop: 88,000 – 84,000 Consolidation Zone This is a major liquidity zone. 4.Final target: 🎯 77,000 (my TP is correct) or even wick to: 🎯 74,500 (liquidity) Why 77k target is logical: •High timeframe demand zone •Big imbalance to fill •Previous consolidation •Measured move from top → aligns perfectly ________________________________________ 🟩 5. Bullish Scenario (Low Probability) For BTC to flip bullish again: 1.Must reclaim 98,186 BOS 2.Must close above 100,000 3.Must break back inside the trendline Only then bullish continuation to: 📈 106,000 📈 118,500 SL zone But currently price is below BOS + below TL, so bullish scenario is only 25–30% likely. ________________________________________ ⭐ 6. Big Summary (Easy to Read) ✔ Trend: Bearish ✔ Structure: Lower Low (LL) confirmed ✔ Trendline: Broken → Bears in control ✔ BOS: Below 98k → bearish continuation ✔ Short-term: Bounce to 98k possible ✔ Mid-term: Drop to 88k–84k ✔ Final Target: 77k → 74.5k My TP (77,000) is accurate and realistic.
تحلیل ساختار طلا (XAU/USD): سناریوی نزولی محتمل و سطوح کلیدی خرید
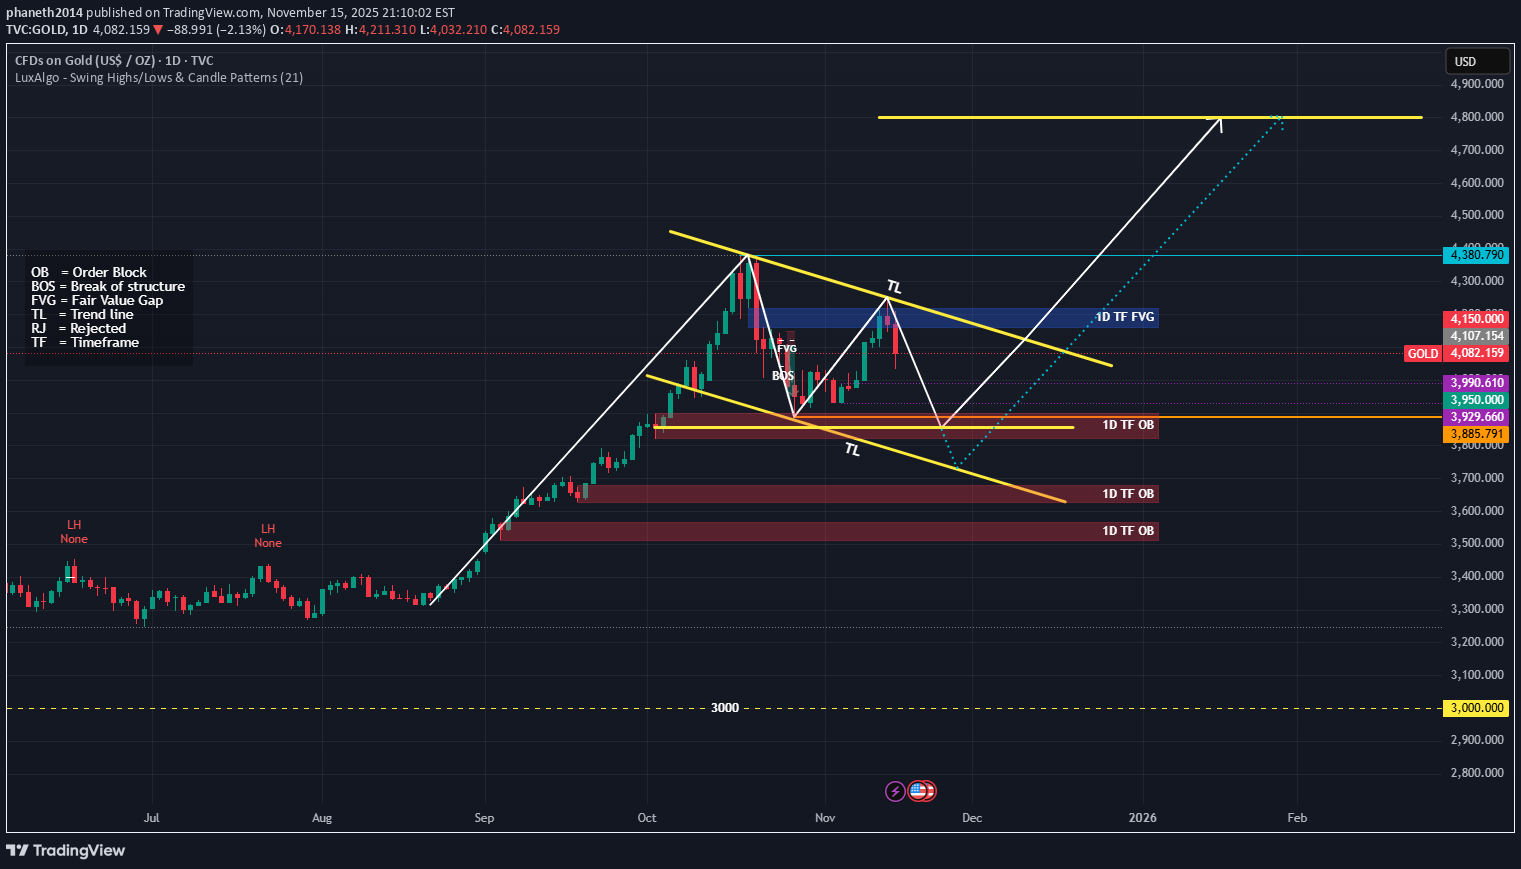
✅ 1. Overall Structure (1D Timeframe) •A descending corrective channel (yellow lines) •Major rejection at the channel top •Price making lower highs (LH) → still bearish structure •Price currently sitting below the mid-range of the channel This means: 👉 Gold is still in a corrective downtrend, not bullish yet. 👉 High probability the market wants to fill lower OBs before any breakout. ________________________________________ ✅ 2. Key Areas I Highlighted 🔷 1D TF FVG (4,107–4,150) – Major Resistance •This zone is extremely important. •Price has failed here multiple times already. •As long as price is below this → bearish pressure continues. This is the “breaker” level for bulls. ________________________________________ 🔴 1D OB Zones Below (Demand Areas) I mapped the OB zones correctly: 1️⃣ OB: 3,990 – 3,950 •First liquidity target •Already almost tapped/mitigated •Still valid for another reaction 2️⃣ OB: 3,929 – 3,885 •Stronger demand •Highly likely to get tapped if the rejection continues •My trendline bottom also aligns here → confluence 3️⃣ OB: 3,800 – 3,700 •If price breaks deeper into channel •This is the next liquidity layer These OBs line up perfectly with my descending channel. ________________________________________ Extreme Liquidity Below I noted: •3100 •3000 •2600 These are macro liquidity harvest levels, NOT near-term. Price falls here only if: •Channel breaks down •Major macro bearish shift occurs → Not likely in the next few weeks unless massive catalyst. ________________________________________ ✅ 3. Updated Structural Reading (Using New Drawing) A. Price recently failed to break the upper channel This supports more downside. B. I drew an ABC correction The new chart also still shows: •A → B → C decline likely forming •Potential completion at the lower trendline This supports a drop before any rally. C. My white projection (V-shape recovery) This large bullish projection is valid ONLY if: •Price touches lower OB ➡️ 3,929 – 3,885 •And then breaks back above ➡️ 4,150 Only then the big bullish run can start. ________________________________________ 📉 4. Most Likely Path (Updated With New Chart) Based on my new structure: Primary Scenario (70% probability) Price drops to the lower OB: → 3,929 – 3,885 Possibly even wick into: → 3,800 – 3,700 Then: Strong bounce → retest 1D FVG (4,107–4,150) If rejection again → continuation inside channel. ________________________________________ Bullish Scenario (30% probability) For my yellow arrow to be valid: 1.Price must touch the lower OB 2.Then form a strong reversal 3.Then break upward out of the descending channel 4.Then close above 4,150 5.Target becomes: 4,380 → 4,800 This matches my yellow long-term projection. ________________________________________ 🎯 5. Key Levels to Watch (Updated) Immediate Support LevelSignificance 3,990Weak OB – might not hold 3,950First real support 3,929 – 3,885🔥 Strong OB + channel bottom confluence Immediate Resistance LevelSignificance 4,107–4,150🔷 Strong 1D FVG (must break for bulls) 4,200Channel breakout level 4,380First macro target ________________________________________ ⭐ 6. Simple Final Summary (Very Clear) My new chart indicates: ✔️ Market still bearish inside descending channel ✔️ Price likely drops to 3,929–3,885 OB ✔️ This is the best zone for bullish reversal ✔️ Bulls must break 4,150 to confirm trend change ✔️ If breakout happens → target 4,380–4,800 ✔️ If OB fails → deeper channel drop to 3,700 OB I drew the structure correctly. The analysis fully matches my levels.
پیشبینی دقیق بیت کوین: سقوط به ۷۶۰۰ دلار تکرار میشود؟
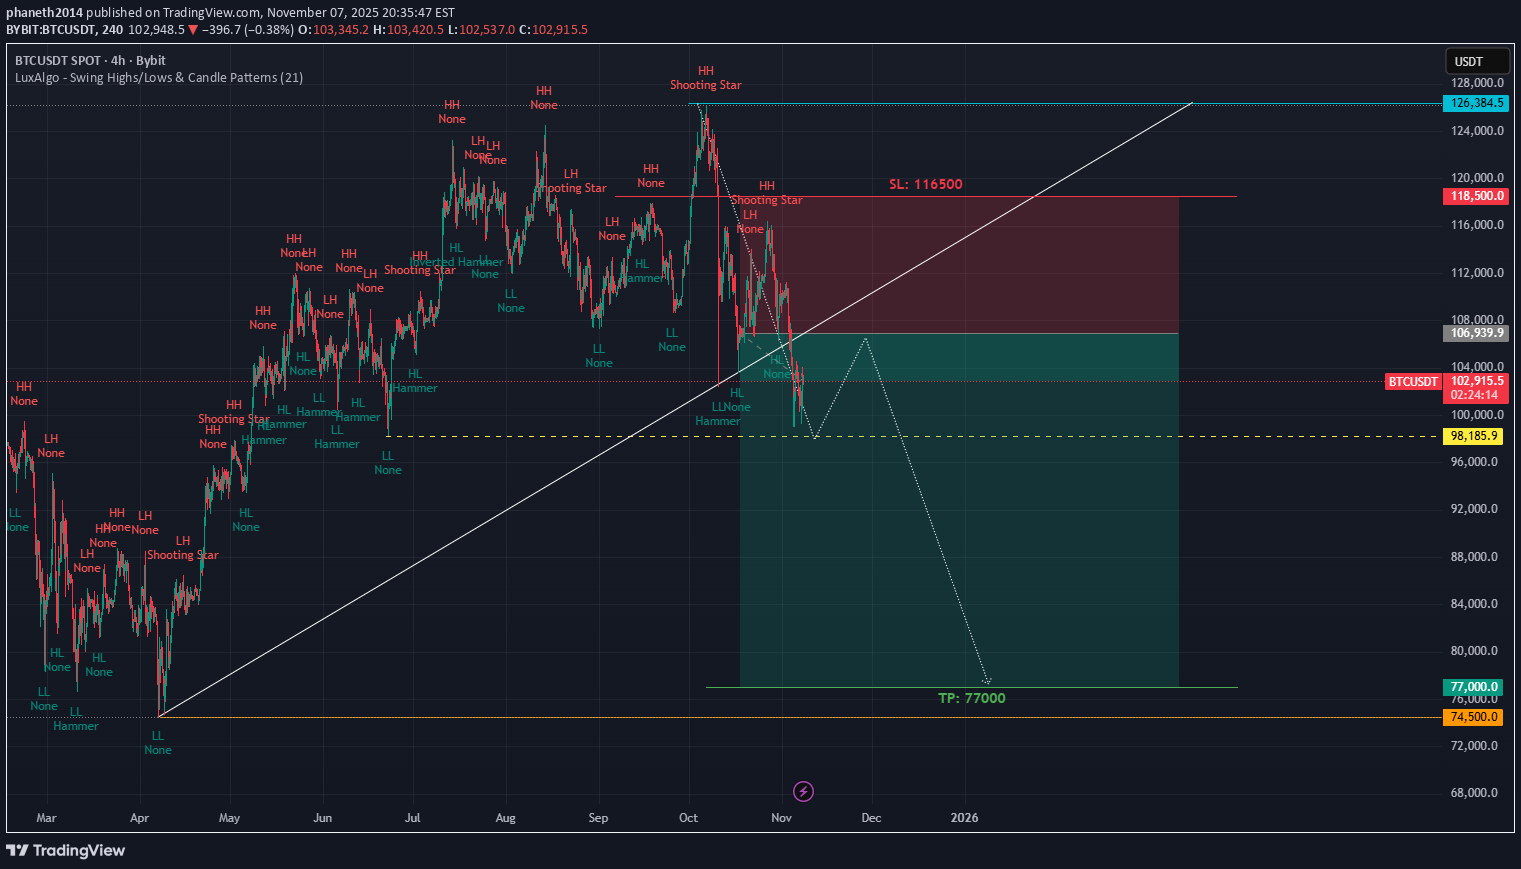
BTCUSDT BTC I said on Oct 17, 2025 last month will dump to $7600, now new month in November 2025, look like follow my structure
افت شدید بیت کوین: پسلرزه رد شدن از مقاومت $4020 و هدف جدید $3885
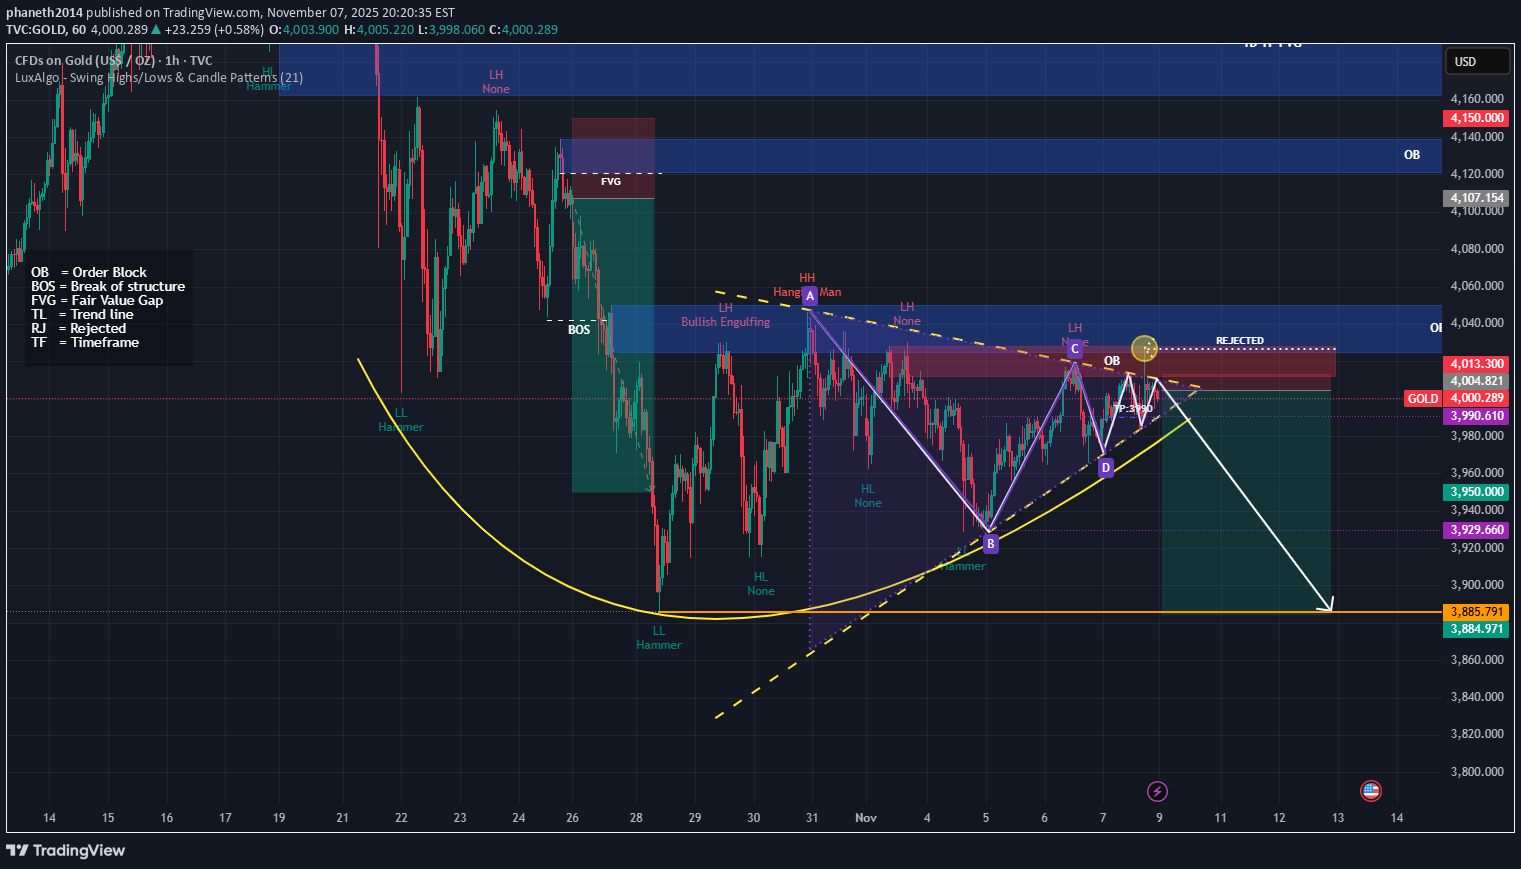
🧭 Overall Structure The chart shows a potential bearish setup. I have drawn a descending pattern (A-B-C-D) with rejection from an Order Block (OB) around $4,013–$4,020. The white arrow projects a downward move toward 3,885. 🔍 Key Technical Elements 1. Order Blocks (OB) Upper OB (~4,150–4,120): Higher timeframe supply zone; strong resistance if price rallies. Current OB (~4,013–4,040): Recently rejected here — price reacted and failed to make a new higher high → confirms seller pressure. 2. Break of Structure (BOS) A previous BOS occurred to the downside, suggesting bearish momentum took control after a temporary bullish leg. 3. Trend Lines (Yellow Dashed) The upper TL connects lower highs → consistent downtrend. The lower TL (support) was recently tested and might break soon — signaling bearish continuation. 4. Pattern A–B–C–D harmonic-like pattern completed near the order block, often signaling a sell opportunity when it aligns with rejection zones. Price formed a lower high (LH) at point C and another at D → confirms trend weakness. 5. Candlestick Rejection “Rejected” and “Hammer” labels near point D and OB zone show failed bullish attempts → adds confluence for short. 🎯 Bearish Targets TP1: 3,950 (nearest support) TP2: 3,930 (previous low) TP3 (Major): 3,885 (strong historical support zone) ⚠️ Invalidation If price closes above 4,040–4,060 (OB zone), bearish setup invalidates. That would mean liquidity grab and possible push toward 4,100–4,150 OB. 🧩 Summary BiasEntry ZoneConfirmationTargetsInvalidation Bearish4,010–4,020 OB zoneRejection + lower high3,950 → 3,930 → 3,885Close above 4,060
طلا پس از شکست ناموفق، به زیر محدوده ۴۰۵۰ سقوط کرد: تحلیل حرکت نزولی تا ۳۸۵۰!

🧭 Chart Analysis (XAUUSD – 1H with structure context) Market Structure That means momentum continues downward as long as price stays below 4030–4050. 🔑 Key Levels LevelTypeExpectation 4050Resistance / SL zoneIf broken, bears invalidated 4000Minor resistanceRetest zone after rejection 3920Target 1Previous swing low liquidity 3880–3850Target 2Measured move of the channel / full extension 3820ExtremeFinal downside sweep before reversal possible 📉 Projection If price closes below 3920 (cleanly on 4H or D1), next leg likely extends to 3850 — the lower boundary of your yellow trend channel. That level aligns with: Previous liquidity grab zone from October 22 low. Channel bottom support. Fibonacci extension 1.272 from the 4050 swing high. ⚙️ Trading Setup Idea Bias: Short (continue existing sell bias) Sell zone: 4000–4020 (retests possible) SL: 4060 TP1: 3920 TP2: 3886 TP3: 3850 TP4: 3820 (extended) Risk–Reward ≈ 1:3.8 ✅ Structure = Bearish ✅ Rejection = Confirmed ✅ Target = 3850 realistic if 3920 breaks
پیشبینی طلا برای هفته آینده: آیا سقوط به ۳۹۵۰ دلار حتمی است؟
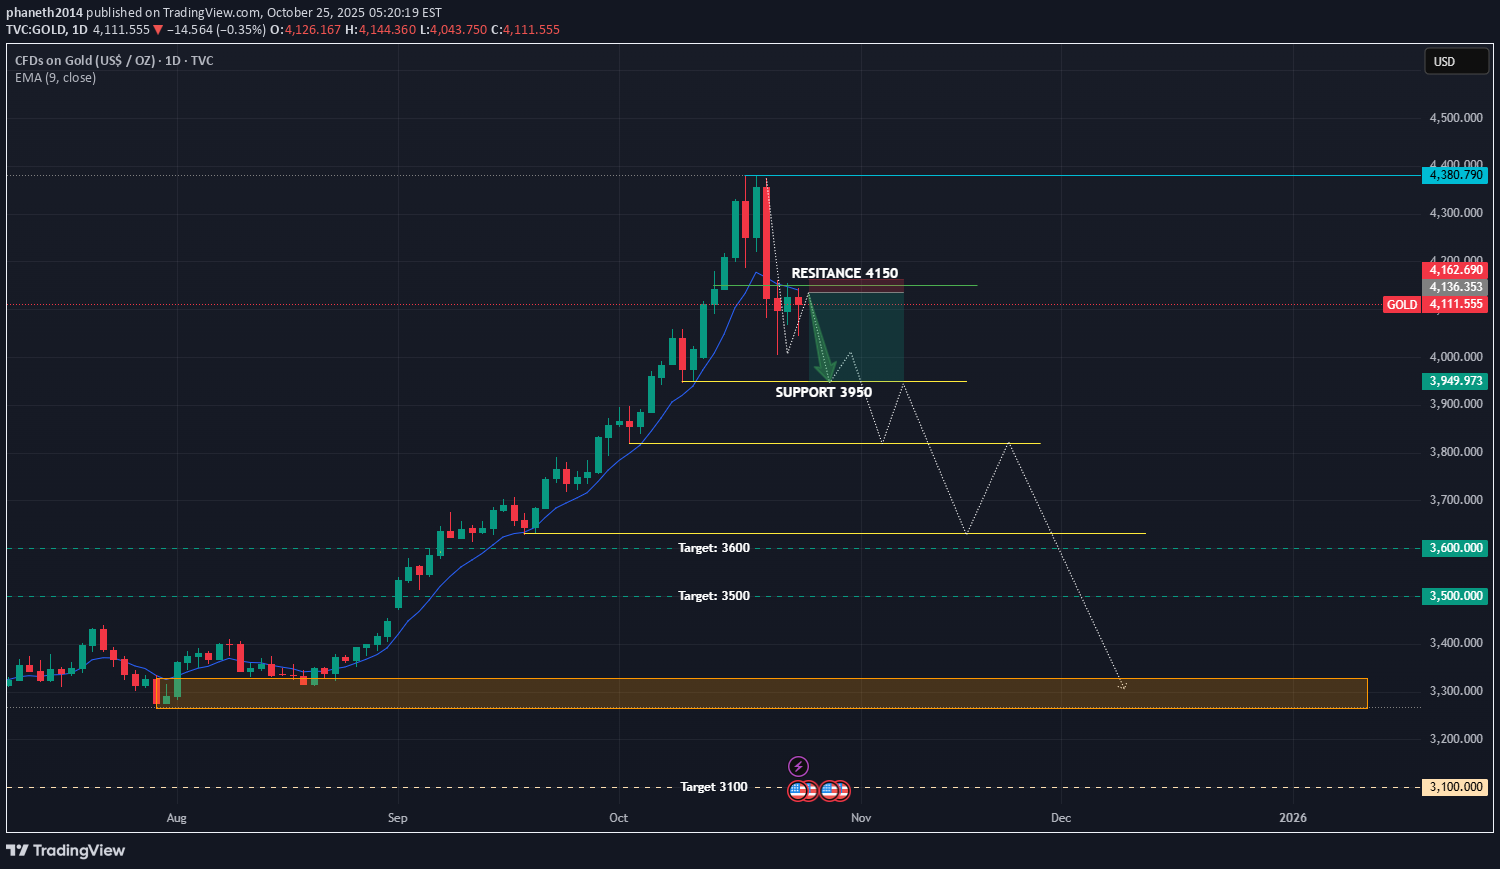
🧭 Current Market Context (XAUUSD around 4111): Price is below EMA 9 and failed to break above 4200–4250. The structure shows lower highs → bearish continuation still dominant. Momentum is weak, and buying pressure hasn’t confirmed reversal yet. 📉 Primary Plan (Bearish Bias – More Likely) Entry: Wait for a 4H close below 4070–4050. Enter short/sell once confirmed. Targets: TP1 = 3950 TP2 = 3600 TP3 = 3500 TP4 (long-term) = 3100 Stop Loss: Above 4250 (or above last swing high). ✅ Reason: Trend still bearish. EMA and structure show resistance above price. Strong downside targets available. ✅ Reason: That breakout would invalidate bearish structure and shift momentum up. ⚠️ Key Tips Don’t trade inside 4050–4250 (range zone, no clear direction). Follow 4H or Daily candle confirmations — avoid early entries. Risk only 1–2% of account per trade. If shorting, take partial profit near 3600 and trail stops.
طلا به کجا میرود؟ پیشبینی سقوط تا ۴۱۰۰ دلار در هفته آینده!

Gold pullback on last Friday, the price can be still downtrend on the next Monday - Tueday to target $4100, if the day closed below $4200, so the price still downtrend more to $4000 for other days
احتمال سقوط اتریوم به زیر 2100 دلار در ماه آینده: تحلیل کف قیمتی ETH
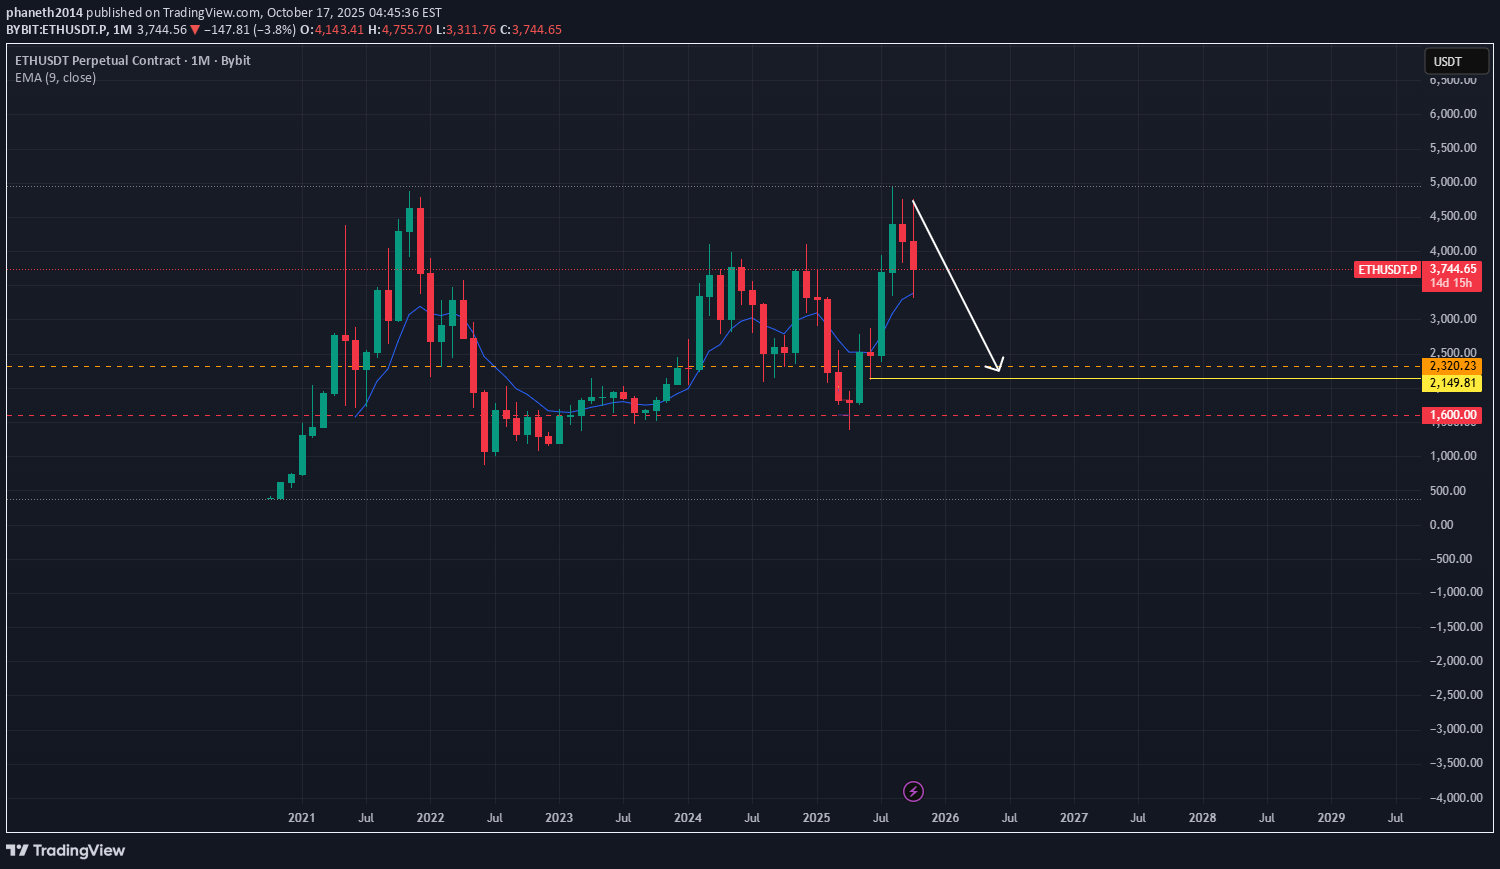
ETH 1 month timeframe is under downtrend the price can be pullback to between $1800 ~ $2100
بیت کوین در مسیر نزولی بلندمدت: آیا کف بعدی کانال 76000 دلار است؟
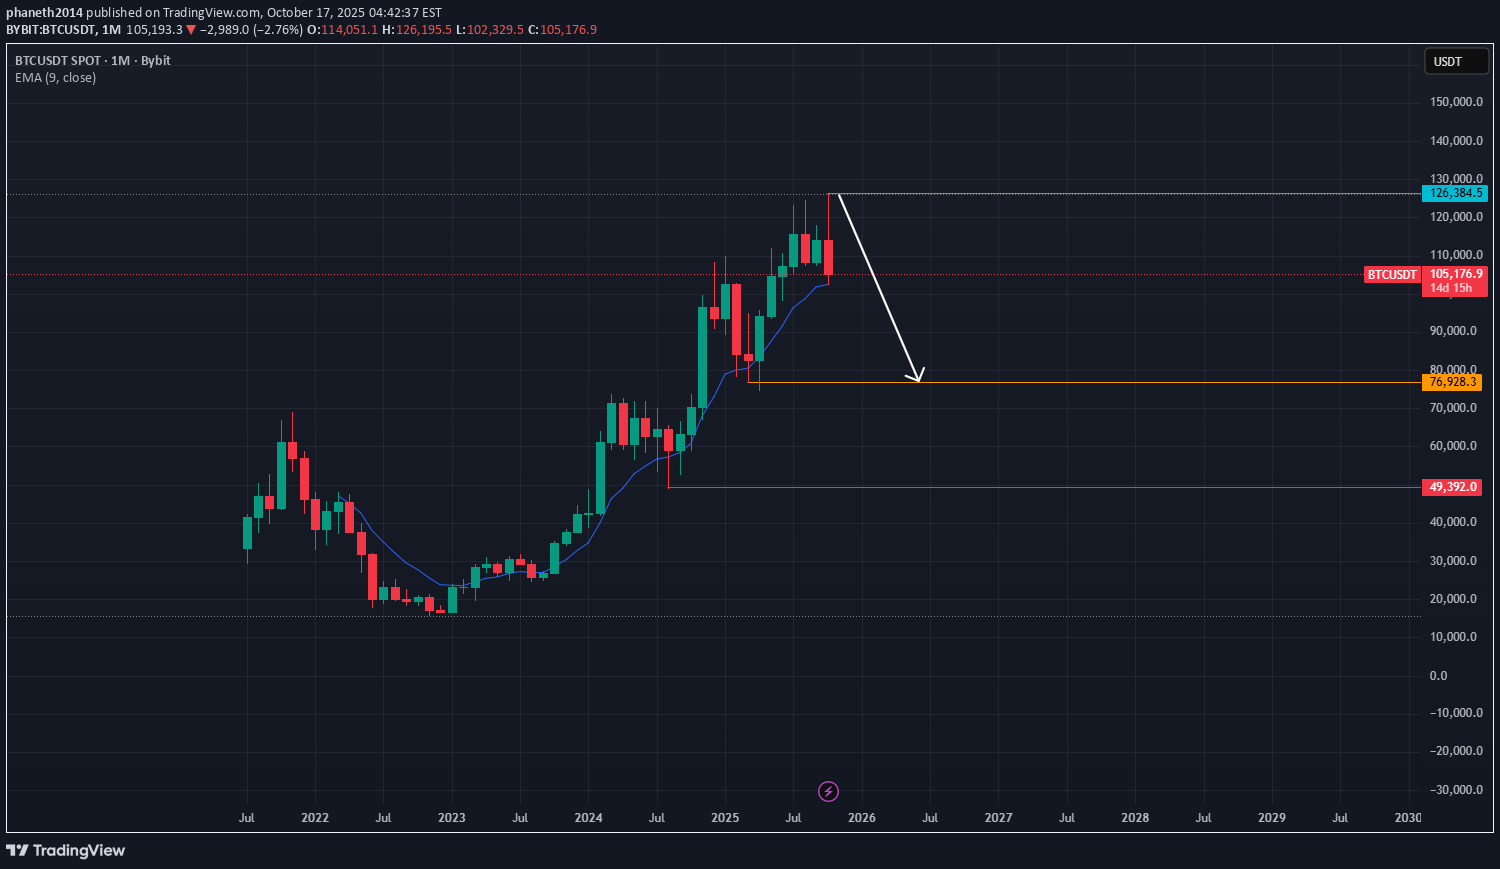
BTC monthly timeframe view under downtrend the target can be pullback to the 76000 ~ 80000
Gold created other structure bullish racgtangle

Gold created other structure it looks like a bullish racgtangle will be uptrend more
Disclaimer
Any content and materials included in Sahmeto's website and official communication channels are a compilation of personal opinions and analyses and are not binding. They do not constitute any recommendation for buying, selling, entering or exiting the stock market and cryptocurrency market. Also, all news and analyses included in the website and channels are merely republished information from official and unofficial domestic and foreign sources, and it is obvious that users of the said content are responsible for following up and ensuring the authenticity and accuracy of the materials. Therefore, while disclaiming responsibility, it is declared that the responsibility for any decision-making, action, and potential profit and loss in the capital market and cryptocurrency market lies with the trader.