
persis10t
@t_persis10t

What symbols does the trader recommend buying?
Purchase History
پیام های تریدر
Filter
persis10t
$BTCUSDT weekly analysis!

BTCUSDT is testing a major confluence support where the rising trendline meets horizontal demand. This zone has been respected multiple times in the past. Holding here keeps the macro uptrend intact. A weekly close below would open room for deeper correction. Key zone to watch. No panic, no FOMO.
persis10t
ETH Daily Chart Update
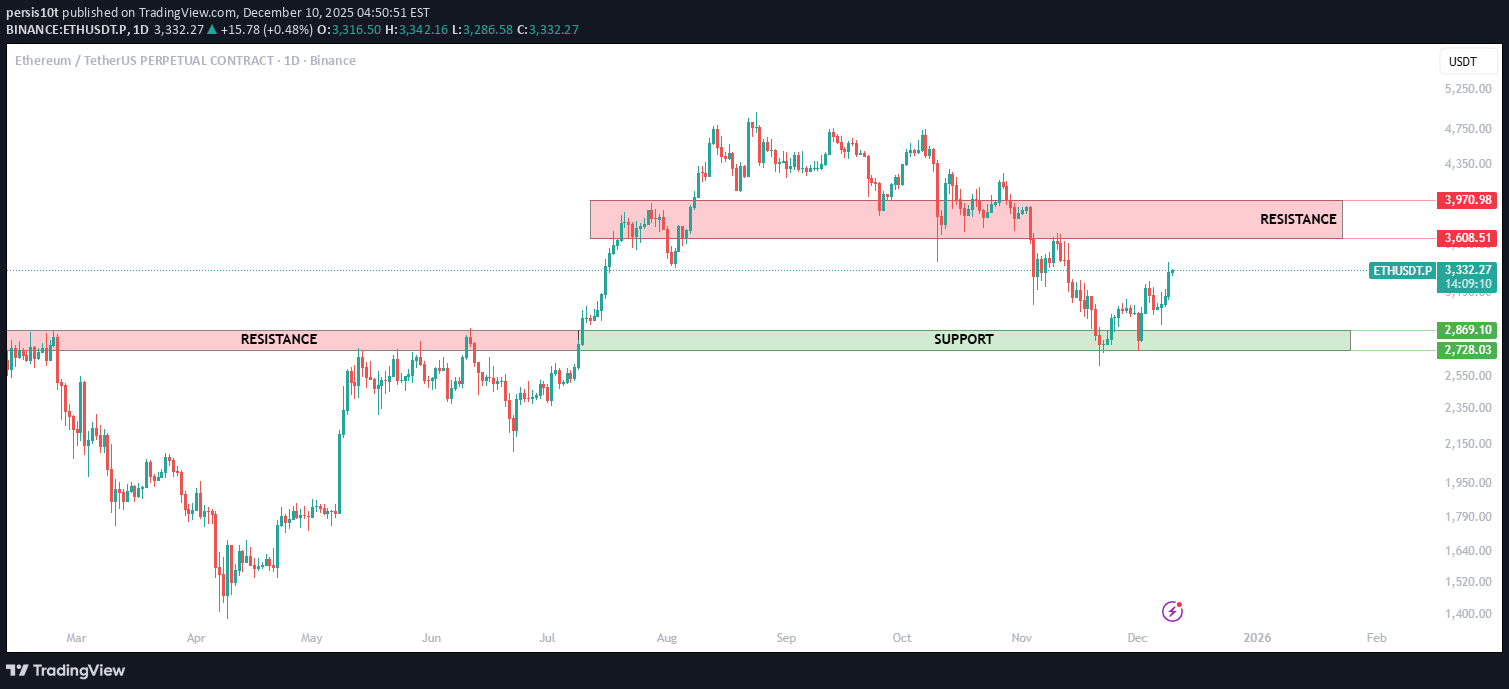
Ethereum has bounced strongly from the key support zone at 2728–2869 and is now pushing upward. This level has acted as a reliable demand area throughout the year, and the latest reaction confirms buyers are active again. The next major hurdle is the resistance zone at 3608–3970. ETH will need a clean breakout above this range to open the door for a larger trend continuation. For now, the structure remains intact: • Support held perfectly • Momentum shifting upward • All eyes on the resistance above
persis10t
آوالانچ (AVAX) در نقطه حیاتی: آیا این حمایت چندساله نجاتبخش خواهد بود؟
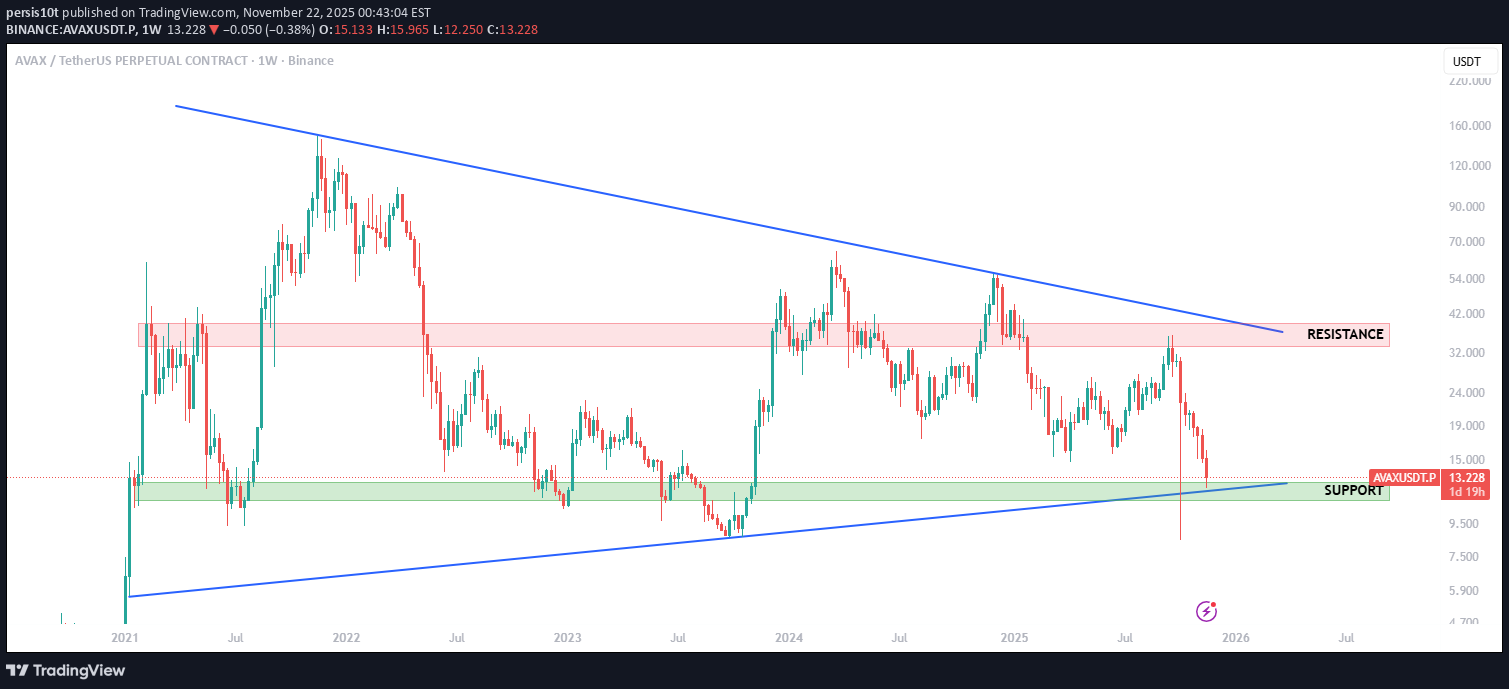
AVAX has dropped back into a major multi-year support zone after a sharp weekly selloff. This level has held the range multiple times since 2021, and the price is now reacting around the same support + long-term trendline. If AVAX manages to hold this area, a bounce toward the mid-range levels ($21.40 → $33.22) becomes possible. Failure to hold support would expose lower targets. This zone is critical — AVAX either stabilizes here or breaks structure for a deeper move. Fundamental Analysis: AVAXUSDT stands out as a leading Layer-1 blockchain, known for speed, scalability, and growing real-world asset (RWA) adoption. Subnet activity is rising, DeFi liquidity is improving, and the network’s decentralized finance ecosystem is gaining fresh momentum. Exchange reserves continue to decline, showing healthy on-chain fundamentals and liquid supply trends. Latest Updates: - Avalanche recently completed a major network upgrade, temporarily suspending AVAX C-Chain deposits and withdrawals for enhanced security. - Its DeFi roadmap features the V1 launch on Sepolia testnet (Q4 2025), including new liquidity pools and support for ETH and USDT. - Recent audits and a $50k bug bounty solidify Avalanche’s reputation for security and reliability.
persis10t
تحلیل قیمت TON: آیا این حمایت حیاتی، سقوط را متوقف میکند؟
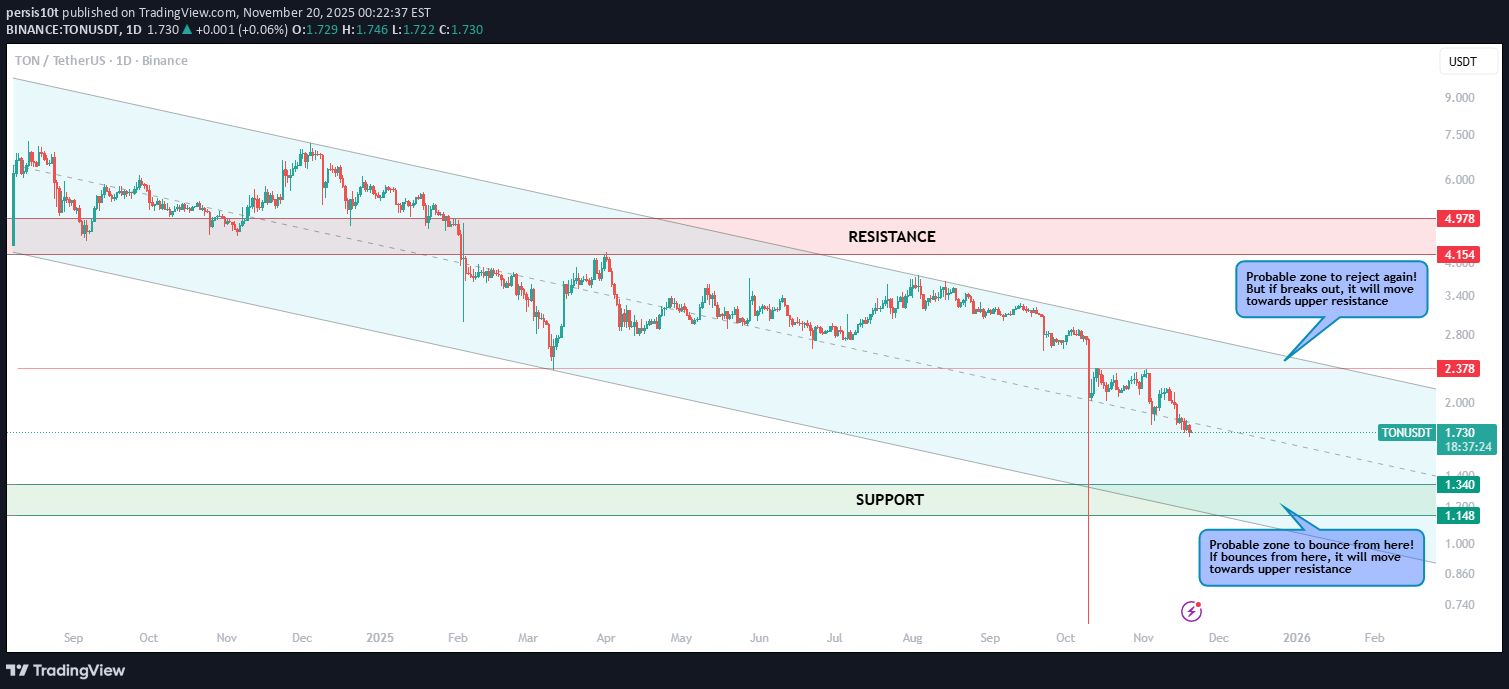
TONUSDT is still moving inside the falling channel. Price is now very close to the major support zone (1.14–1.34) — a region where a bounce has high probability. If TONUSDT reacts from this zone, the next target would be the mid-channel level and then 2.37. But if it rejects there again, we continue the downtrend until a proper breakout.
persis10t
بیت کوین در نقطه حساس: آیا حمایت کلیدی شکسته میشود یا شاهد جهش خواهیم بود؟
persis10t
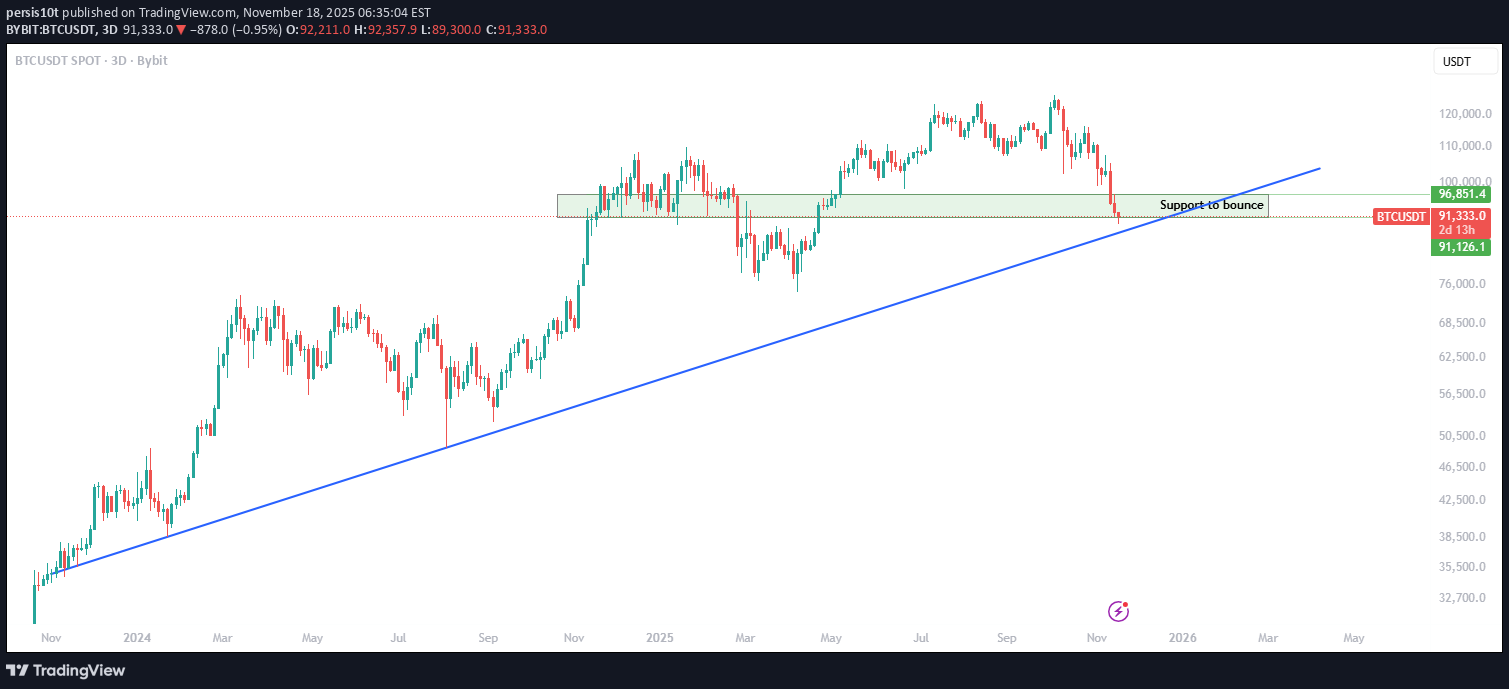
زمان شروع جمعآوری بیت کوین: فرصت طلایی در منطقه حمایتی مهم!
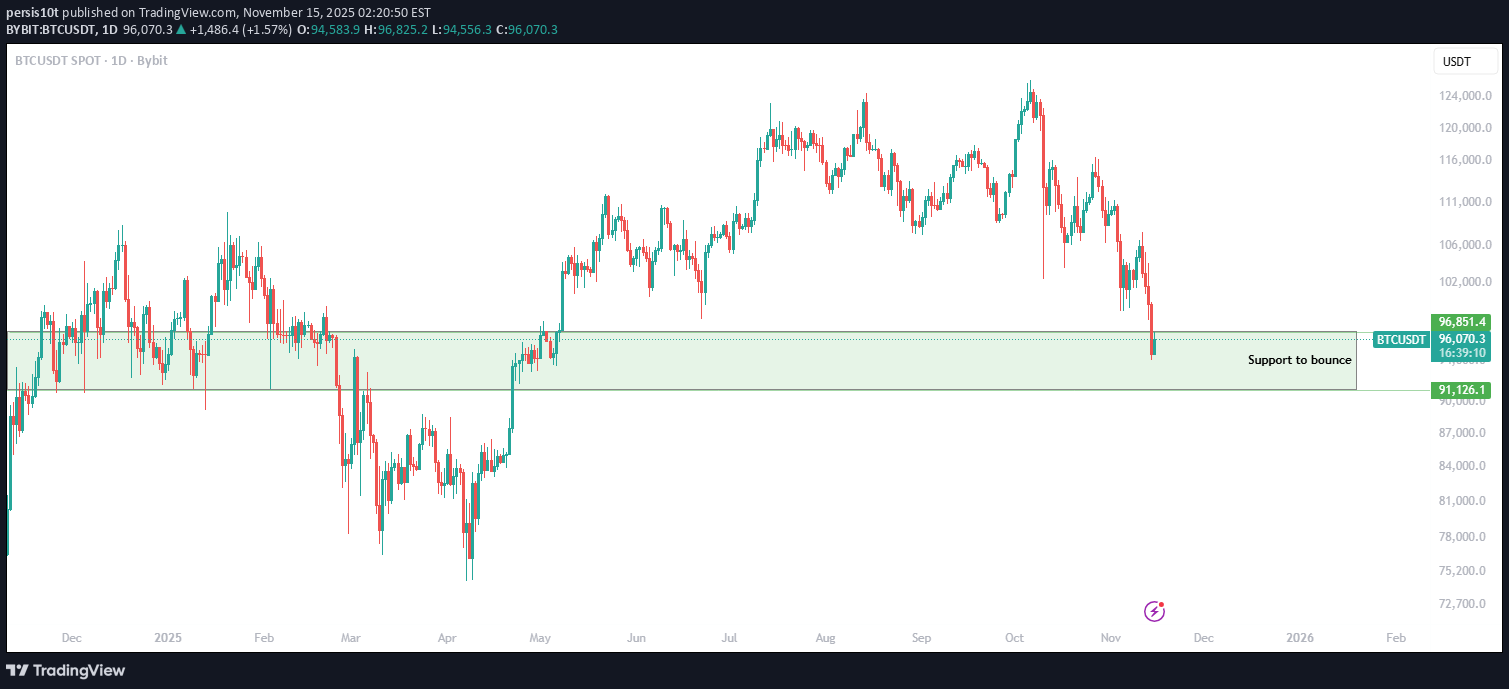
Bitcoin has reached a major demand zone between $91,000–$97,000, an area that has consistently acted as a strong support throughout 2024–2025. Price has now tapped the bottom of this accumulation zone, where buyers previously stepped in aggressively. Key Points: BTC is sitting inside a high-probability bounce zone. Historically, this region has triggered strong upward reversals. Market structure is still intact as long as price holds above $91,000. Perfect area for long-term positioning. Start accumulating BTC within this support zone. This is one of the cleaner levels to build exposure before the next macro move.
persis10t
شکست کانال سه ساله $FIRO: سیگنال صعودی بزرگ با اهداف سر به فلک کشیده!
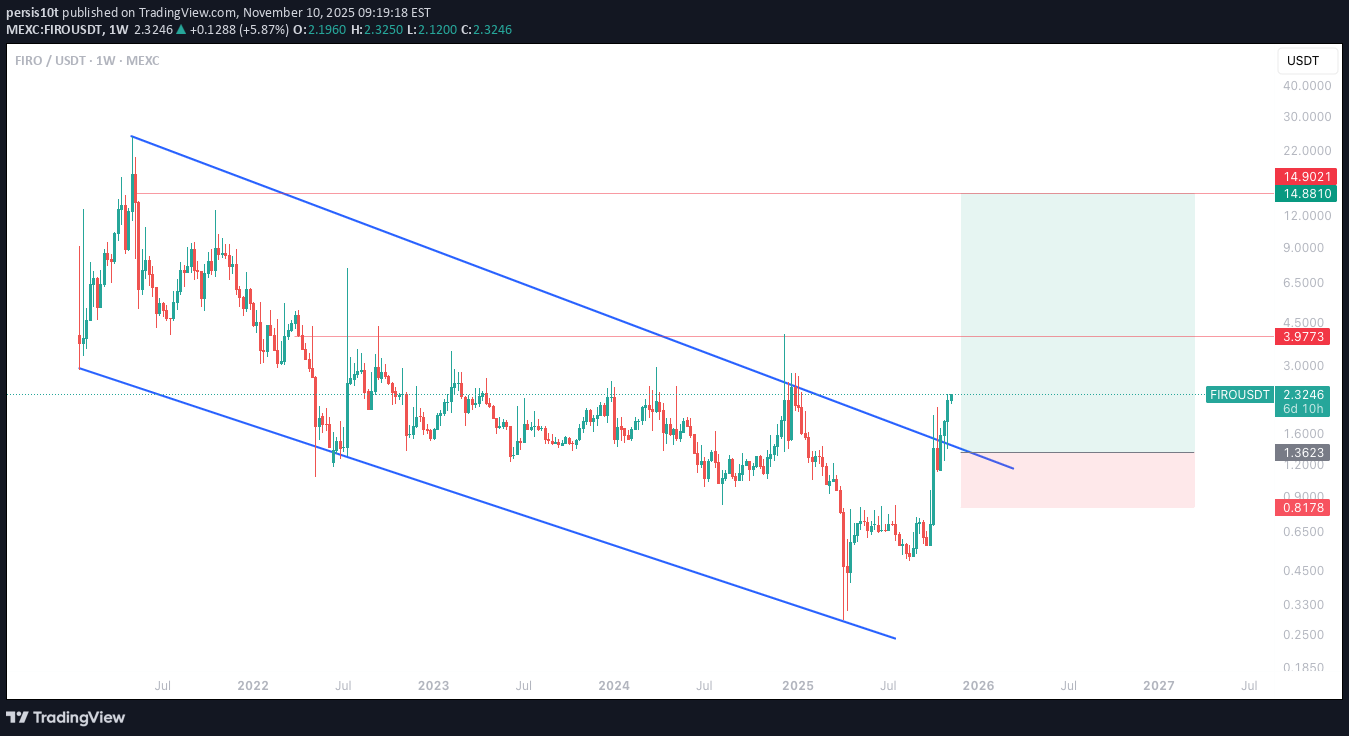
$FIRO has finally broken out of a long-term descending channel that’s been in play since 2021 👀 ✅ Weekly close above trendline = confirmed breakout ✅ First target around $3.97, then $14.88 if momentum continues ✅ Retest zone between $1.36–$1.60 could offer a strong re-entry This structure resembles early-stage trend reversals seen in multiple alts before their parabolic runs. Key levels: 🟢 Support: $1.36 – $1.60 🔵 Resistance: $3.97 → $14.88 ⚠️ Invalid below $0.81 Breakout from a 3-year downtrend = serious momentum potential ⚡
persis10t
قیمت NEAR به نقطه حیاتی رسید: آیا فرصت خرید بزرگ فرا رسیده است؟
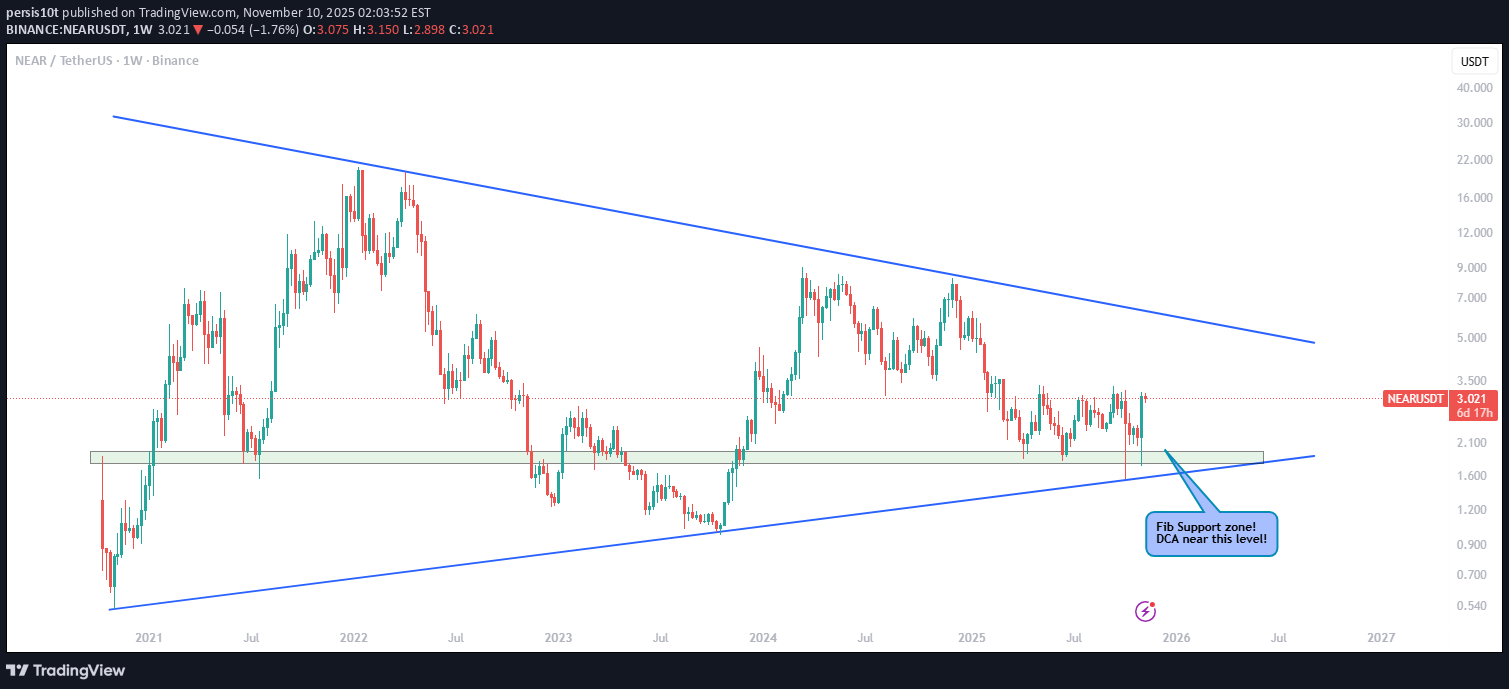
NEAR has reached an important Fibonacci + structural support zone, aligning perfectly with the long-term trendline. This area has acted as a strong demand zone multiple times in the past — making it a good DCA (dollar-cost averaging) region for long-term investors. If price holds this level, we could see a reversal or strong bounce toward the $4.5 and $6.6 resistance zones. Key levels to watch: 🟢 Support: $1.8 – $2.2 (Fib + Trendline zone) 🔴 Resistance: $4.5 → $6.6 Patience pays off near major confluence zones 👀
persis10t
سولانا (SOL) در آستانه تکرار تاریخسازی بایننس کوین (BNB)؟ احتمال انفجار قیمت!
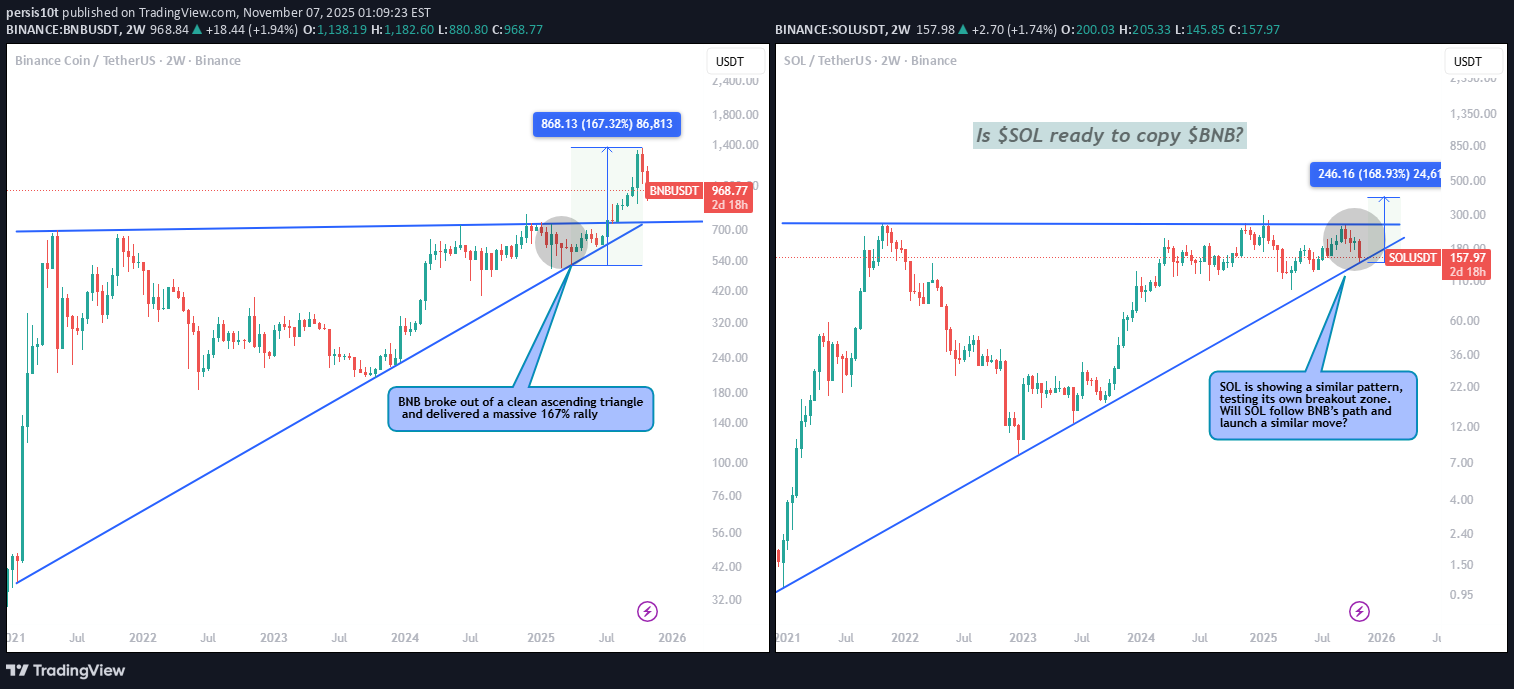
BNB broke out of a clean ascending triangle and delivered a massive 167% rally. Right now, SOL is showing a similar pattern, testing its own breakout zone. Will SOL follow BNB’s path and launch a similar move? A structure like this could set the stage for a big run if support holds. Share your views—is SOL ready for its breakout moment?
persis10t
بیت کوین آماده انفجار؟ راز حمایتهای کلیدی که سرنوشت قیمت را رقم میزند!

BTC is once again reacting strongly from the lower channel support, similar to the previous green-circle bounces we’ve seen this year. Each green circle has marked key accumulation points — followed by strong upside momentum. Meanwhile, red circles highlight resistance rejections where profit-taking zones formed near the upper channel boundary. 🧭 Key Levels to Watch: Support: $106.8K – $110.5K Resistance: $120.1K – $123.5K Trend: Holding firmly inside the rising channel If BTC continues to respect the green zone, we could be looking at the early stages of another leg up toward the top of the channel. But if support fails, expect a deeper retest of the lower structure. Note: History doesn’t repeat perfectly — but it rhymes. Stay calm, stay patient, and let the chart tell the story.
Disclaimer
Any content and materials included in Sahmeto's website and official communication channels are a compilation of personal opinions and analyses and are not binding. They do not constitute any recommendation for buying, selling, entering or exiting the stock market and cryptocurrency market. Also, all news and analyses included in the website and channels are merely republished information from official and unofficial domestic and foreign sources, and it is obvious that users of the said content are responsible for following up and ensuring the authenticity and accuracy of the materials. Therefore, while disclaiming responsibility, it is declared that the responsibility for any decision-making, action, and potential profit and loss in the capital market and cryptocurrency market lies with the trader.