
omvats1
@t_omvats1

What symbols does the trader recommend buying?
Purchase History
پیام های تریدر
Filter
gold and three angles

gold is following 3 prominent angles since the origin of this chart, in the next few graphics , i will zoom in and zoom out to show the real picture, also will to post some important levels for the guidancezoom in
Hopeful bears and bulls, and a two channels

bitcoin is following a higher high pattern since mid'2022, giving mix chance to both the parties of happiness and pain , now took the support at the lower tl , testing mid of a lower low pattern and giving possible year end posible level, in case , never broke the below tl's , also the lower levels will be posting the important levels in below graphics shortlyin monthly
gold is riding a perfect parabolic movement, but

Hi, in my november publication, i' talked about a gold range in 12M tf, which resulted in the fall of the gold then, gold got the support below, now testing a tl above , i will share the link of the publication below gold is testing a 12M inside bar high, well at the start of the year, if, continue with it, we have some good positive levels in the near future , but, surely deserve caution here, smaller time frames will guide now in 1M, gold enjoying the breakout of the Inside bar but under the resistance of the mid of the BO zone, again a point of caution in 4H, gold is following the perfect copy book parabolic movement, making strong move after taking support and getting resistance from the above curved tls , now at a steeper angle important 12M , 1M &1W levels already given gold is within a caution zone with volatile movement , still below the lower tl in 4H , so trade safely once settled we can get a good directional trade i will timely add some smaller tf patterns which will help us to navigate through this caution zone hope you will like the publication and trade safe thanksprevious ideain 1Hin 4H, gold is trying to form a new consolidation pattern, in case price stopped following the parabolic movementstill in hh in 15 minstill in HH consolidationstill in hh patternin day tfprogressmade new parallel curved tlstook resistance at the previous day levelbreak out of the consolidation
Bitcoin , continuation of the pump and dump, but

Hi, Bitcoin perfectly following the previous pump and dump idea got resistance earlier but also the support at the below tls now bitcoin is in consolidation mode after enjoying the strong breakout , but following a curved consolidation now under the lower low phase, getting resistance above and support below now, at the low of an day inside bar also the doji low in day tf, within another day IB and the weekly IB nearing the lower HH tl, could try to take support at it ,also plotted important 12M/1M levels for reference hope u find the publication relevant and interesting, giving the progress of the previous pump and dump idea below thankszoom inprogress of the previous pump and dump idea posted in the month of december '2024in 1HBO of triangle pattern earlier , now following a LL pattern taking support at the below tl also trying to take the support of the below monthly HH zoneso , a small curved tls consolidation, under 2 falling tlsprogressin 1Hprogressprogresstook support at the below HH tl now again nearing a testadding possible monthly zones
DOGECOIN multi timeframe analysis

H!, trying to give the DOGE multi time frame analysis , please go through graphics below Doge is following a higher high (HH) channel / consolidation zone in day time frame also moving within a 12M inside bar range got the got the resistance from one of the inside bar ratios level , also giving here nearby 12M levels , will post the monthly and weekly level in separate graphics hope you will like the idea thanksweekly inside barsprogressdoge took support below now took a resistancedoge is moving with in the channel now trying to take support at the below tl also following a LL tlso break the channel low now got support at the below tlprogress , after taking support from the below tl again at testprogressprogressprogress of the doge idea if not able take support here lower tl will be testedprogressprogressinside bars
GOLD take the resistance from the monthly inside bar high

Gold take the resistance from the monthly inside bar High also an important level for 2026, broke a 15 min inside bar level , tying to take the support at the lower tl in 15 min tf, but MAs are still negative and trying for negative closeup in 15 min tf , so a place of cautionmonthly and weekly IB'sgold channel taking resistance at an important level for 2026progress
Apple , multi timeframe pattern analysis
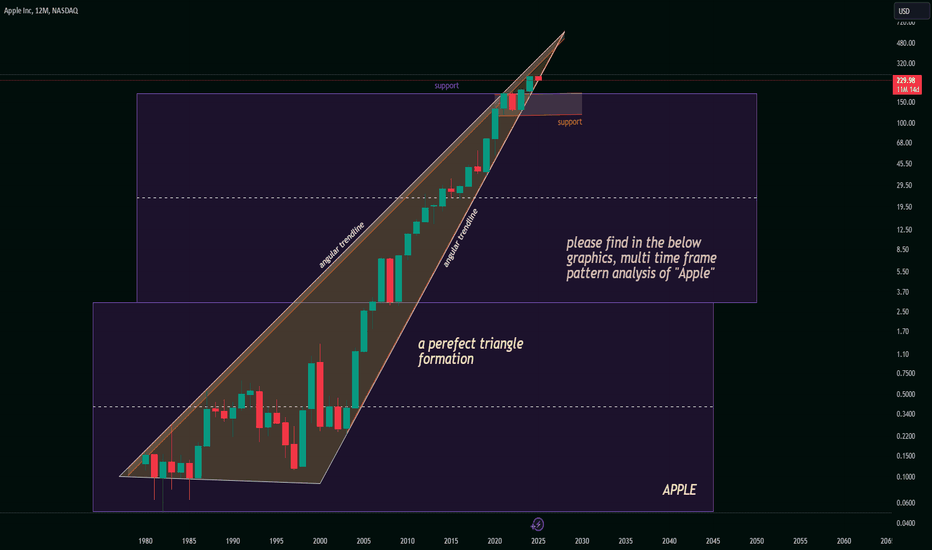
Hi, trying to give herewith apple multi timeframe analysis , patterns are showing important junction for the apple , please go through all the graphics, also tried to give important 12M levels for apple along with monthly and weekly levels in below graphicsprogressprogressprogressprogressprogressprogress
GOLD multi time frame analysis

Gold is at an important 2025 level,will try to give here graphics of multi timeframe patterns of gold also will try to give important gold levels belowin 15 min tf will also give some other important levels laterlow of the channel lets cprogressgold again took the support at the lower tl and got resistance from the above oneagain at the mid of the channel closed at the day levelstill following HH but a tl aboveagain took resistanceagain got resistance from the level, still above the weekly lvlprice above the level , following HH in 5 min tf took resistance from the day level earlierprogressprogressprogress2771.6 is a monthly inside bar levelprogressprogresstesting the lower tlprogress took support now at the resistanceprogressa lesser strong day lvlprogressprogressprogress still under the above tlprogressprogressgot resistance from the above tlgold progressagain testing the resistance zoneanother patternprogressprogressbroke the weekly and day level , followed the HH pattern perfectly, got resistance from the trendline , near the mid of the monthly inside bar BO range, lets see below another weekly lvlgot resistance from the mid of the monthly inside bar bo zone closed above the day levelgot resistance from a day level and support from lower day levelgold is following a growth angle while testing the above resistancesgot support belowgot resistance from the level shown in 15 min chart above also from the tl in 4H
progress of my October '2023 bitcoin analysis, a chart art

Hi, showing herewith, the progress of my bitcoin analysis posted in the mid of october 2023, here , i'm showing how patterns impacted the price then, also, how to use channel ratios effectively posting the original idea in next graphicoriginal idea
Bitcoin following a curve in 15 min tf

Hi, bitcoin following a curve, did give some valuable insight about the bitcoin resistance through patterns in my last idea also talked about the supporting patterns there , well nearing the end of year, will give my monthly and weekly levels in below graphics , bitcoin already took resistance from 2024, 12M level, nearing the resistance and support level for the 202512m12M in month12M in day with day tlsimportant monthly and weekly levelsin 5m tfgoing for my trading so will not able to provide regular updatesnow caution needed, upper curve and monthly opening , lets c,new 4Hnew 4Hnew 2H and lower candleslevels are workingin 15 minpattens r working levels are there so, more updated for todayno more* update for todaya bo of the curve and the new pattern in progress
Disclaimer
Any content and materials included in Sahmeto's website and official communication channels are a compilation of personal opinions and analyses and are not binding. They do not constitute any recommendation for buying, selling, entering or exiting the stock market and cryptocurrency market. Also, all news and analyses included in the website and channels are merely republished information from official and unofficial domestic and foreign sources, and it is obvious that users of the said content are responsible for following up and ensuring the authenticity and accuracy of the materials. Therefore, while disclaiming responsibility, it is declared that the responsibility for any decision-making, action, and potential profit and loss in the capital market and cryptocurrency market lies with the trader.