
novamatic
@t_novamatic

What symbols does the trader recommend buying?
Purchase History
پیام های تریدر
Filter
novamatic
نقطه عطف حیاتی MSTR: آیا ریزش شدید در راه است یا جهش بزرگ؟
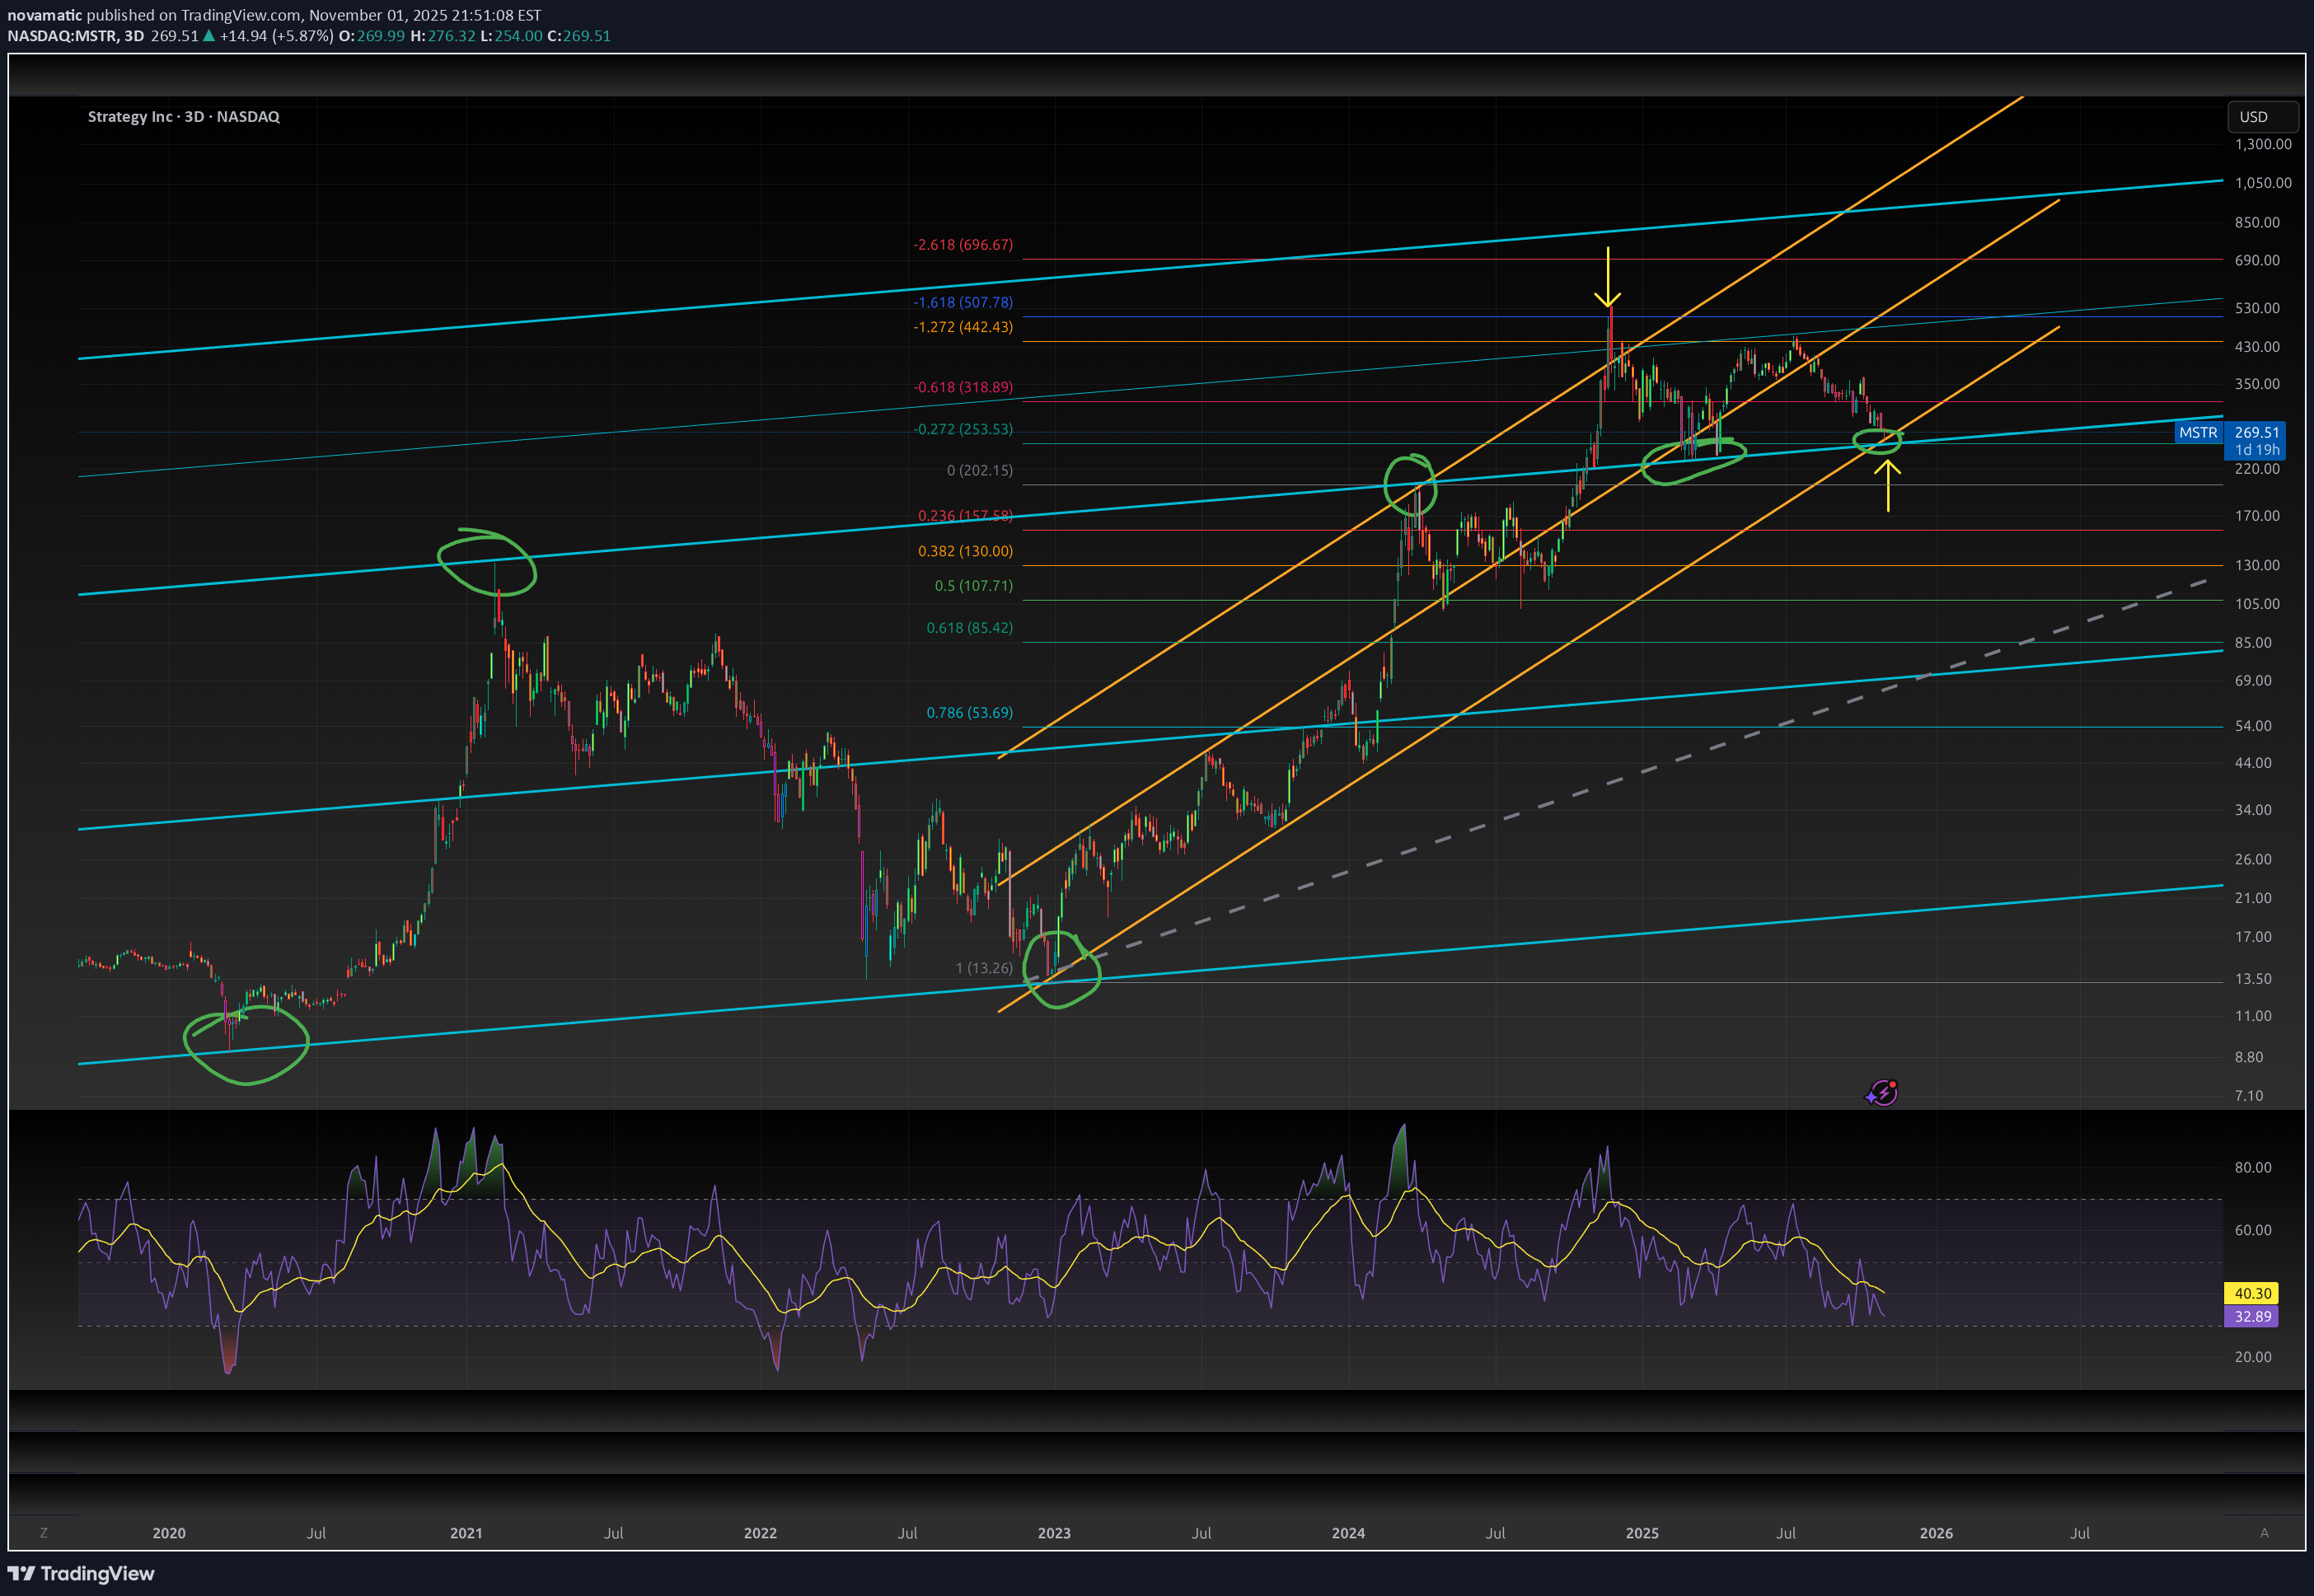
MSTR is on a point of three major confluences. To lose this level would mean we are going much lower. However, I expect at least a significant bounce from here. we have the blue channel that previously acted as resistance and recently turned into support. we have the current orange channel we have the -.272 fib level, after hitting the -1.618 Nov 2024 RSI also looks like a bottoming pattern, but that needs to play out some more to be confident. I would not be surprised if we retest the underside of the -.618 around $315 in short order. If we lose this level, it could get really nasty to the downside.
novamatic
سهم SPX6900 به ۳.۸۹ دلار میرسد؟ تحلیل تکنیکال شگفتانگیز!

We just competed a really nice test of the 50% and 61.8% retrace right on the trendline. I could be just up from here to the ultimate target at the top trendline at around $3.89
novamatic

Avax has been trading very technically. the most bullish setup I see is a pullback to the intersection of the 61.8 retrace and the 50% fib fan, which could launch us to the $40 by the end of October.
novamatic
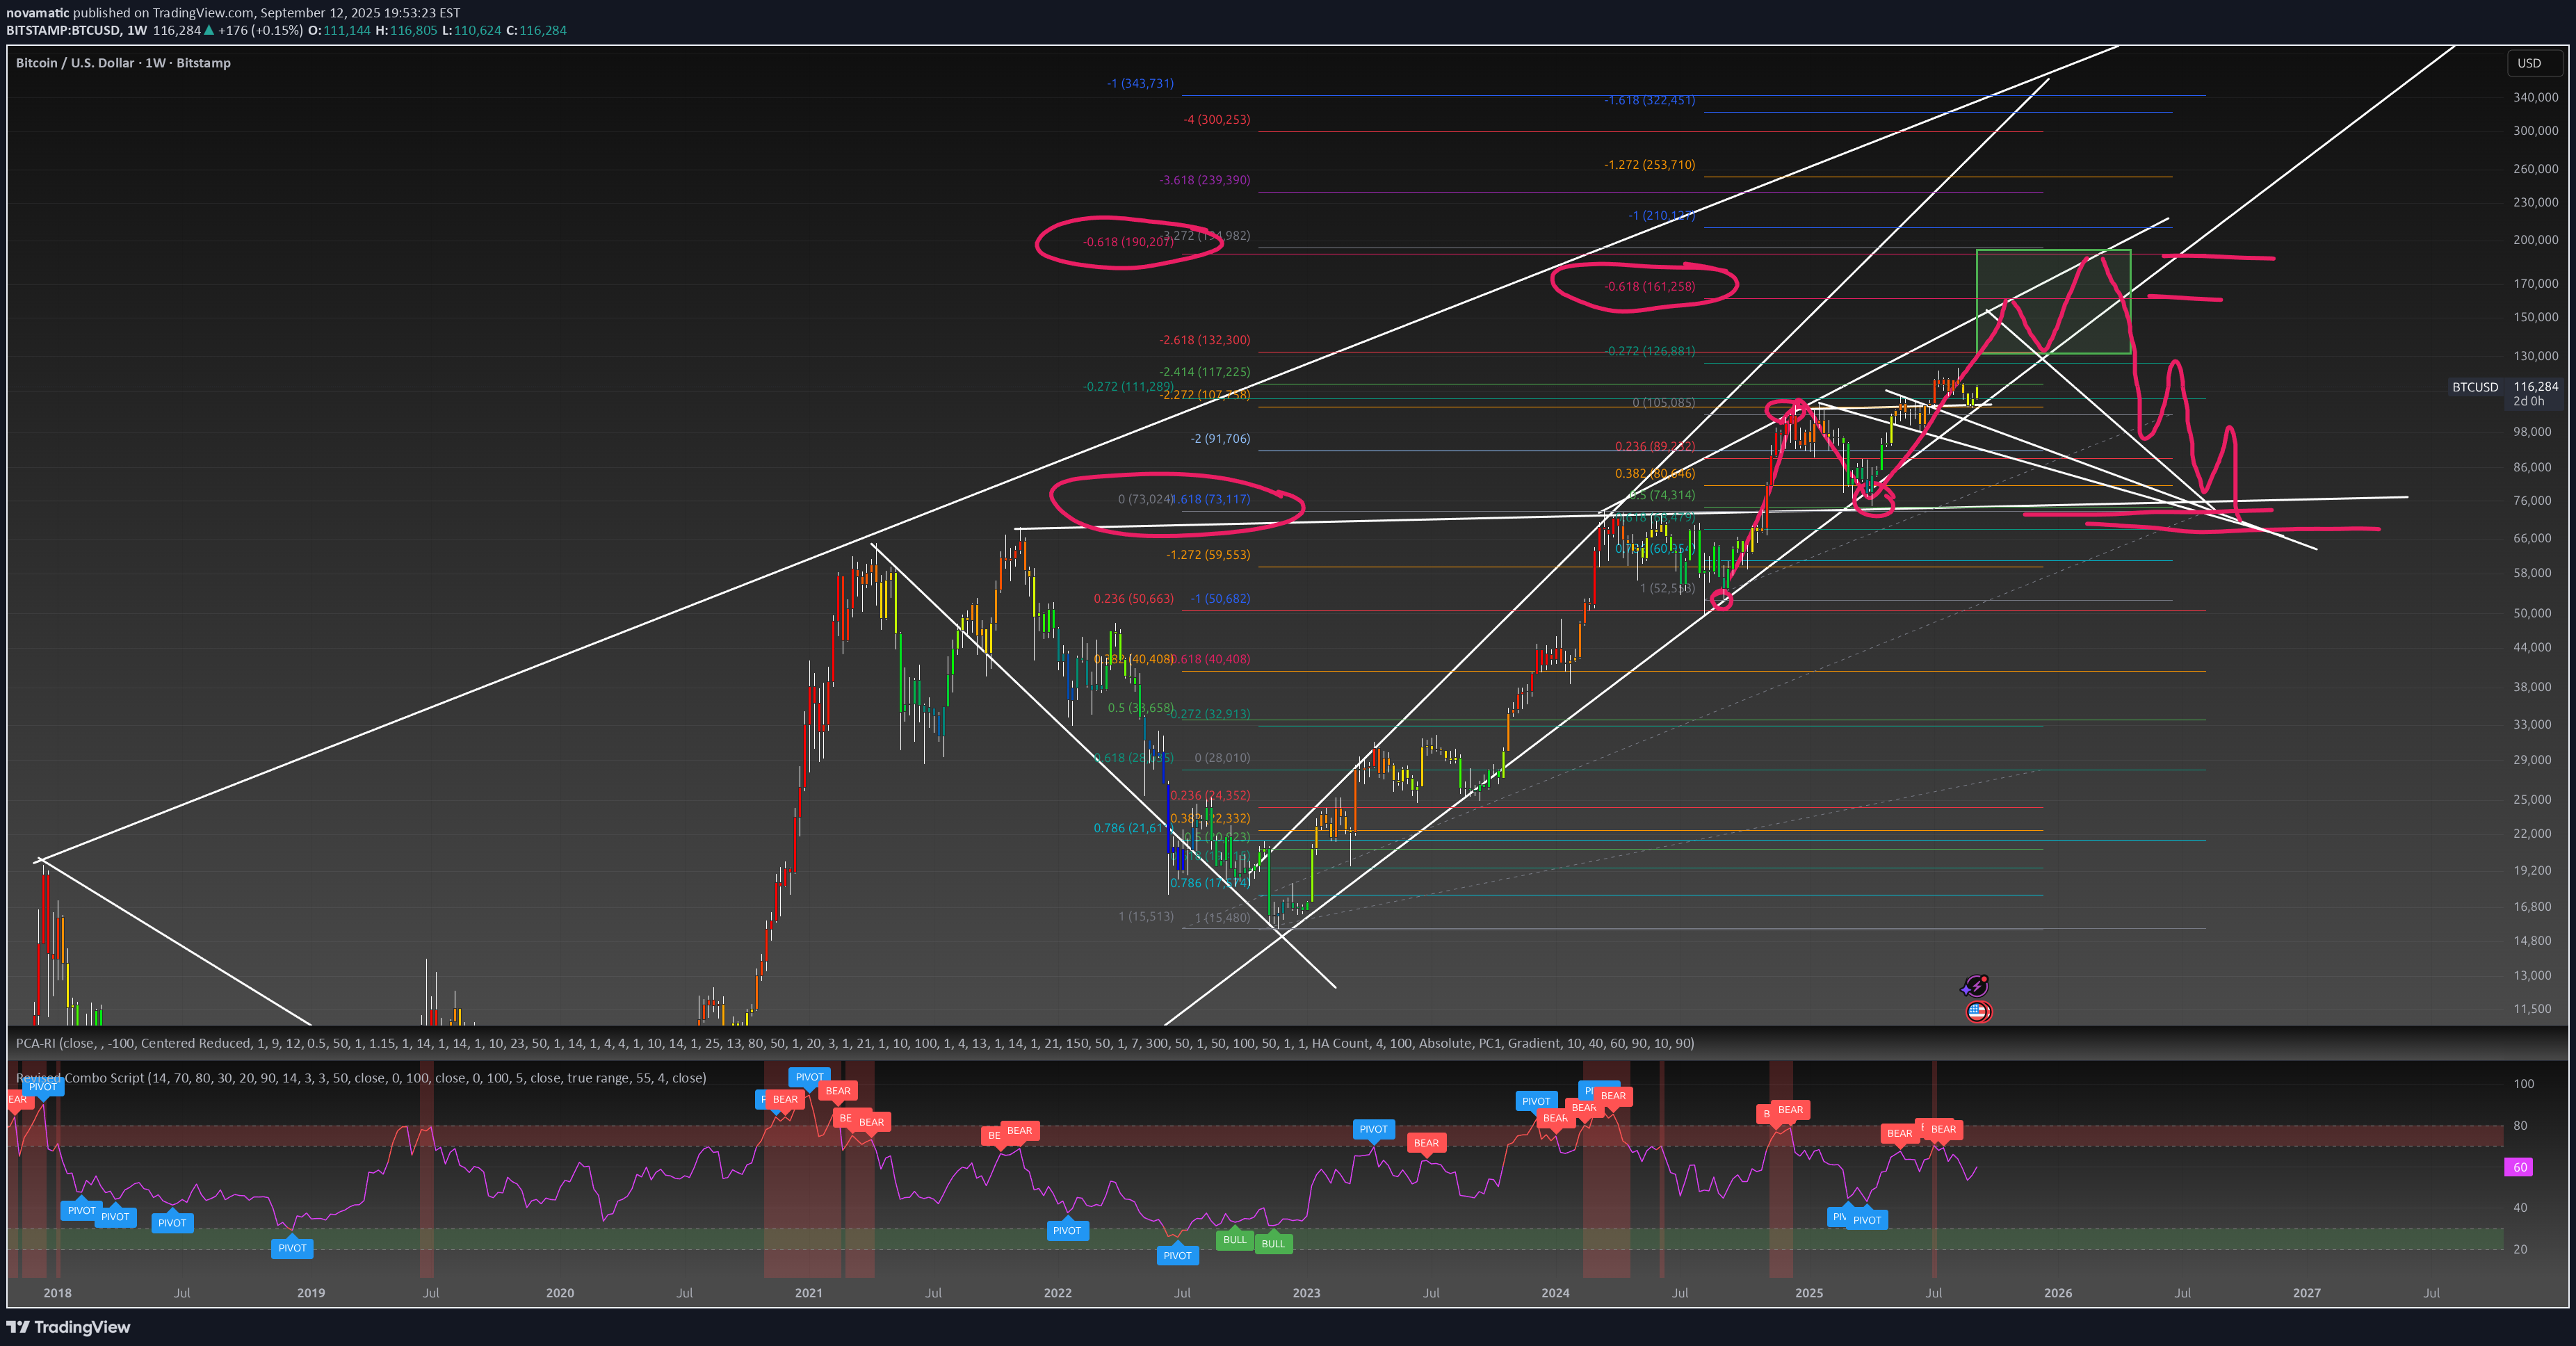
This is one of many potential paths I have for BTC and want to publish it to see if it tracks. There's a lot going on here. what's important is the fib levels are all validated, meaning, if they complete their path they will hit these levels. of course, the timing is always an issue as are the pullbacks. Right now, this is the bullish case with a retrace in 2026. Yep, it could go all the way back to somewhere $75-$68K. Let's see how it does!
novamatic
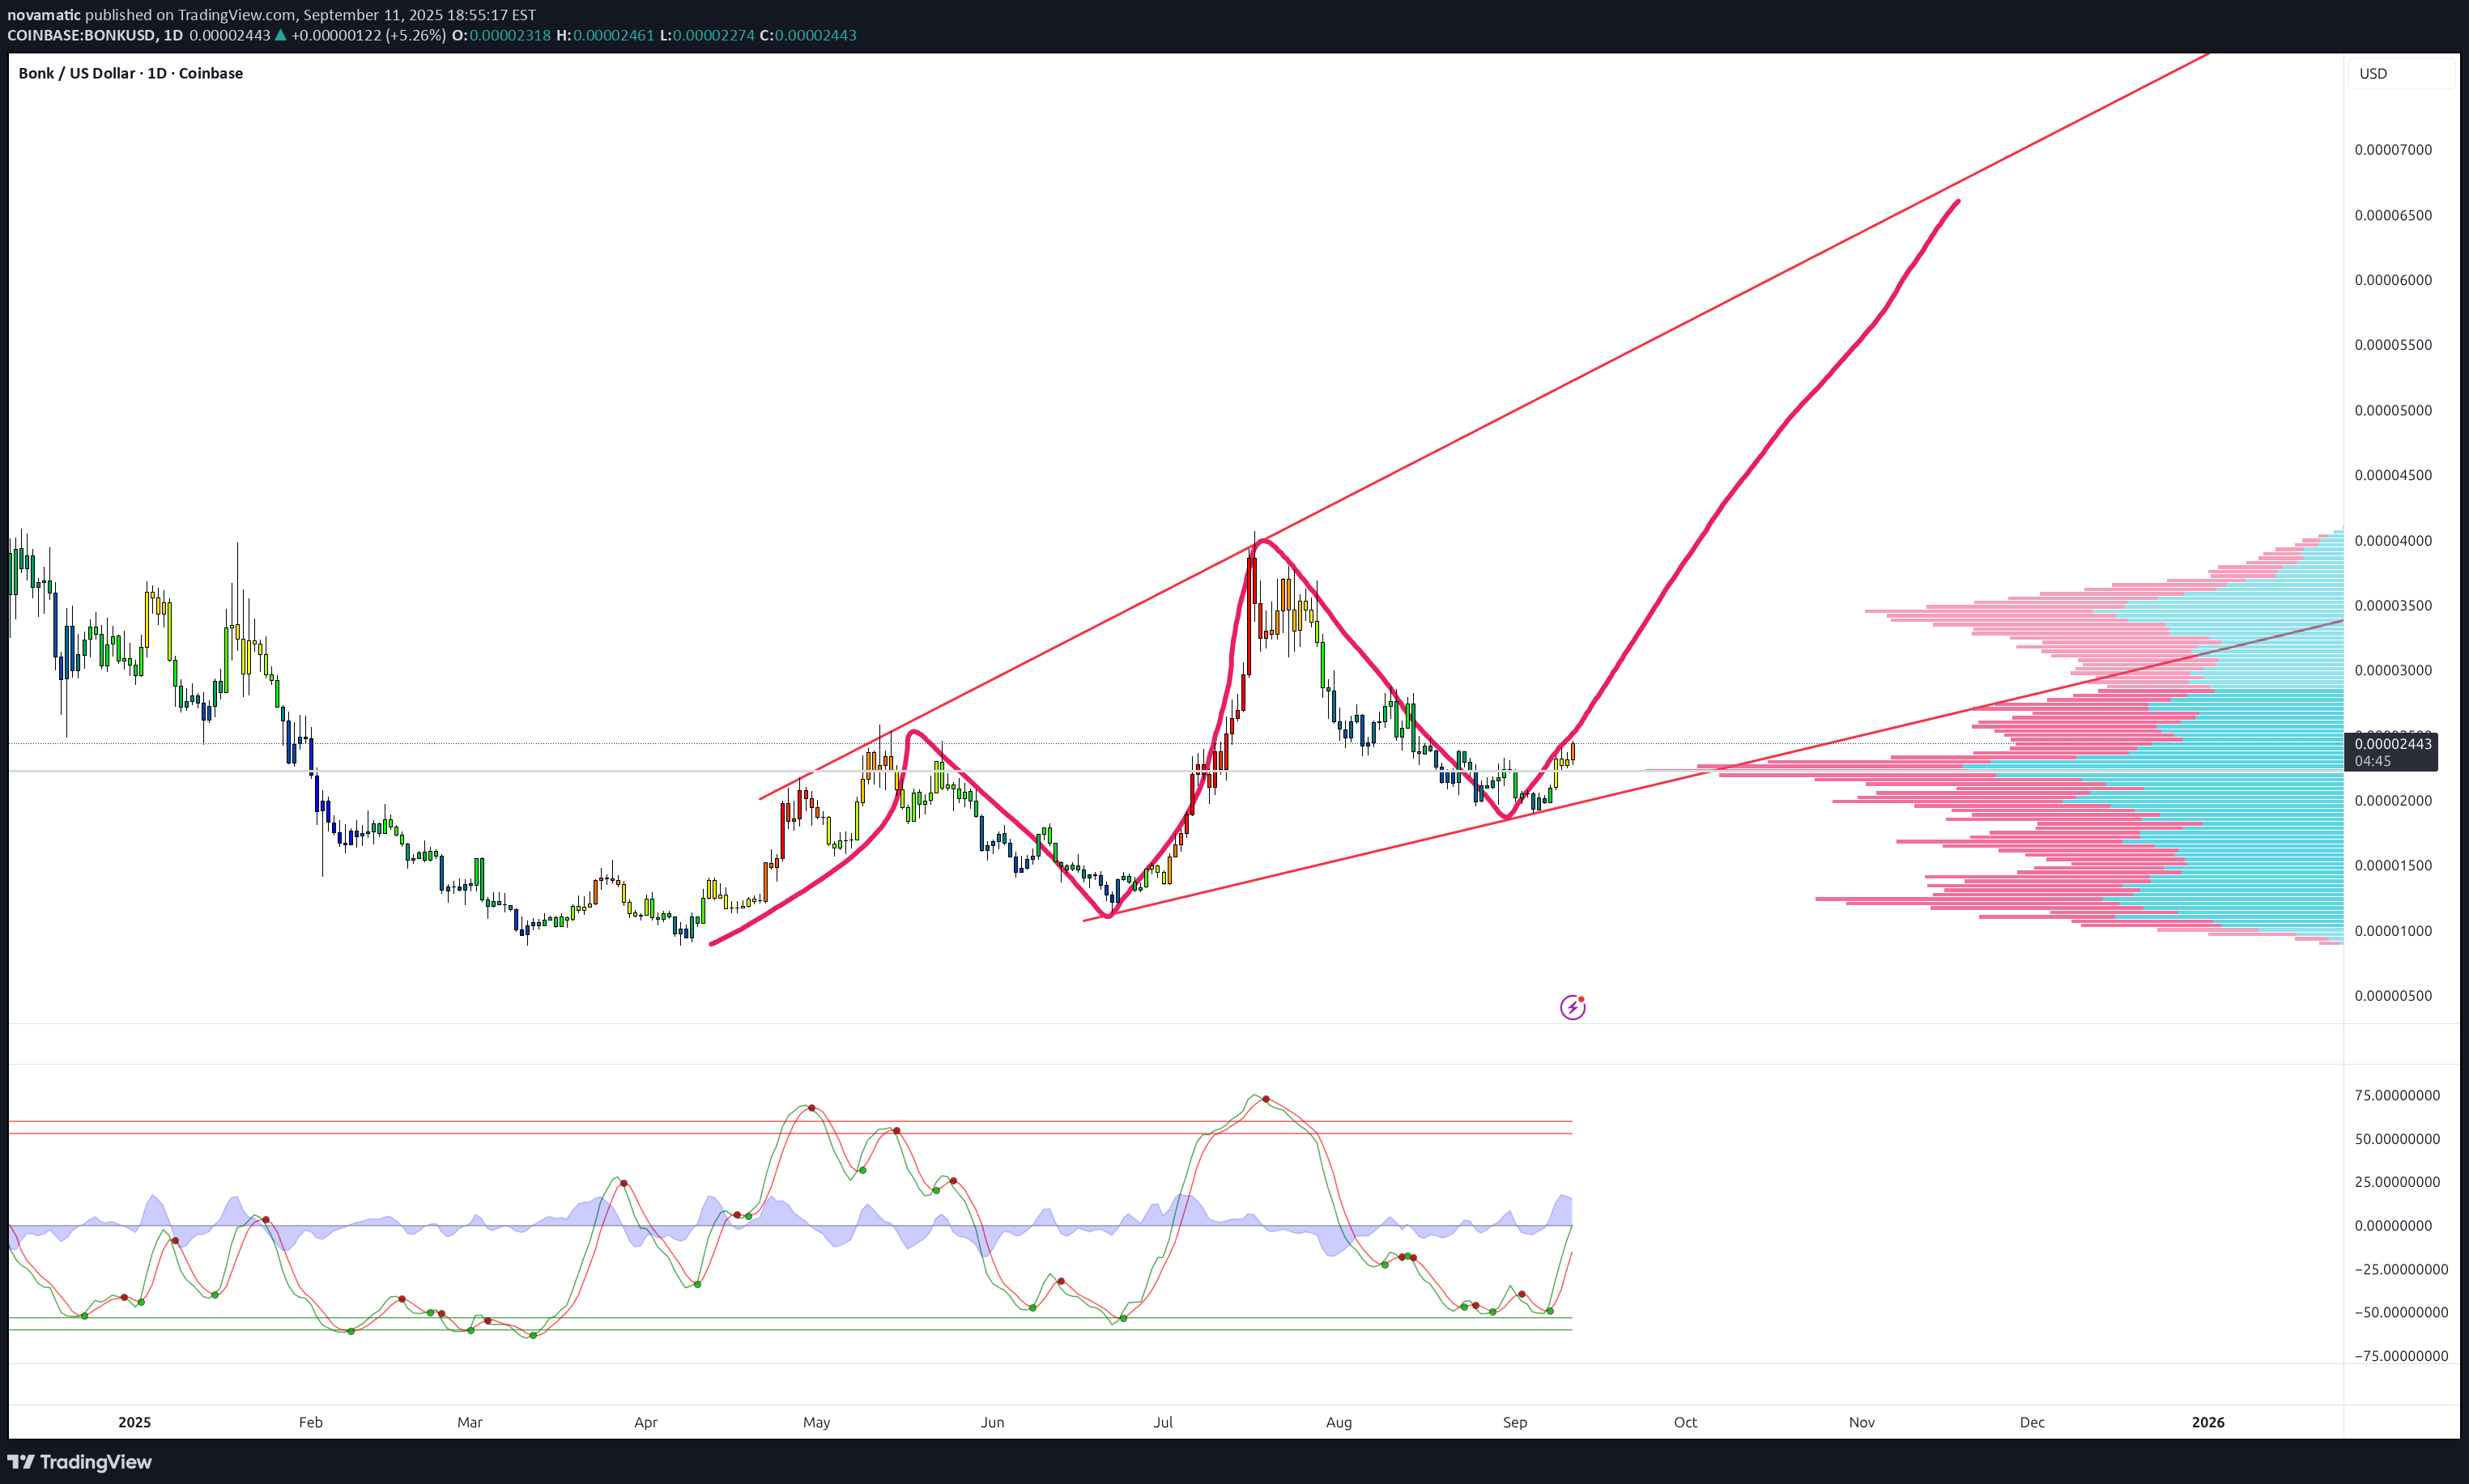
pretty straight forward pattern .everything aligns for an eventual touch to the top trendline in a 12345 move. 5 is starting, now.
novamatic
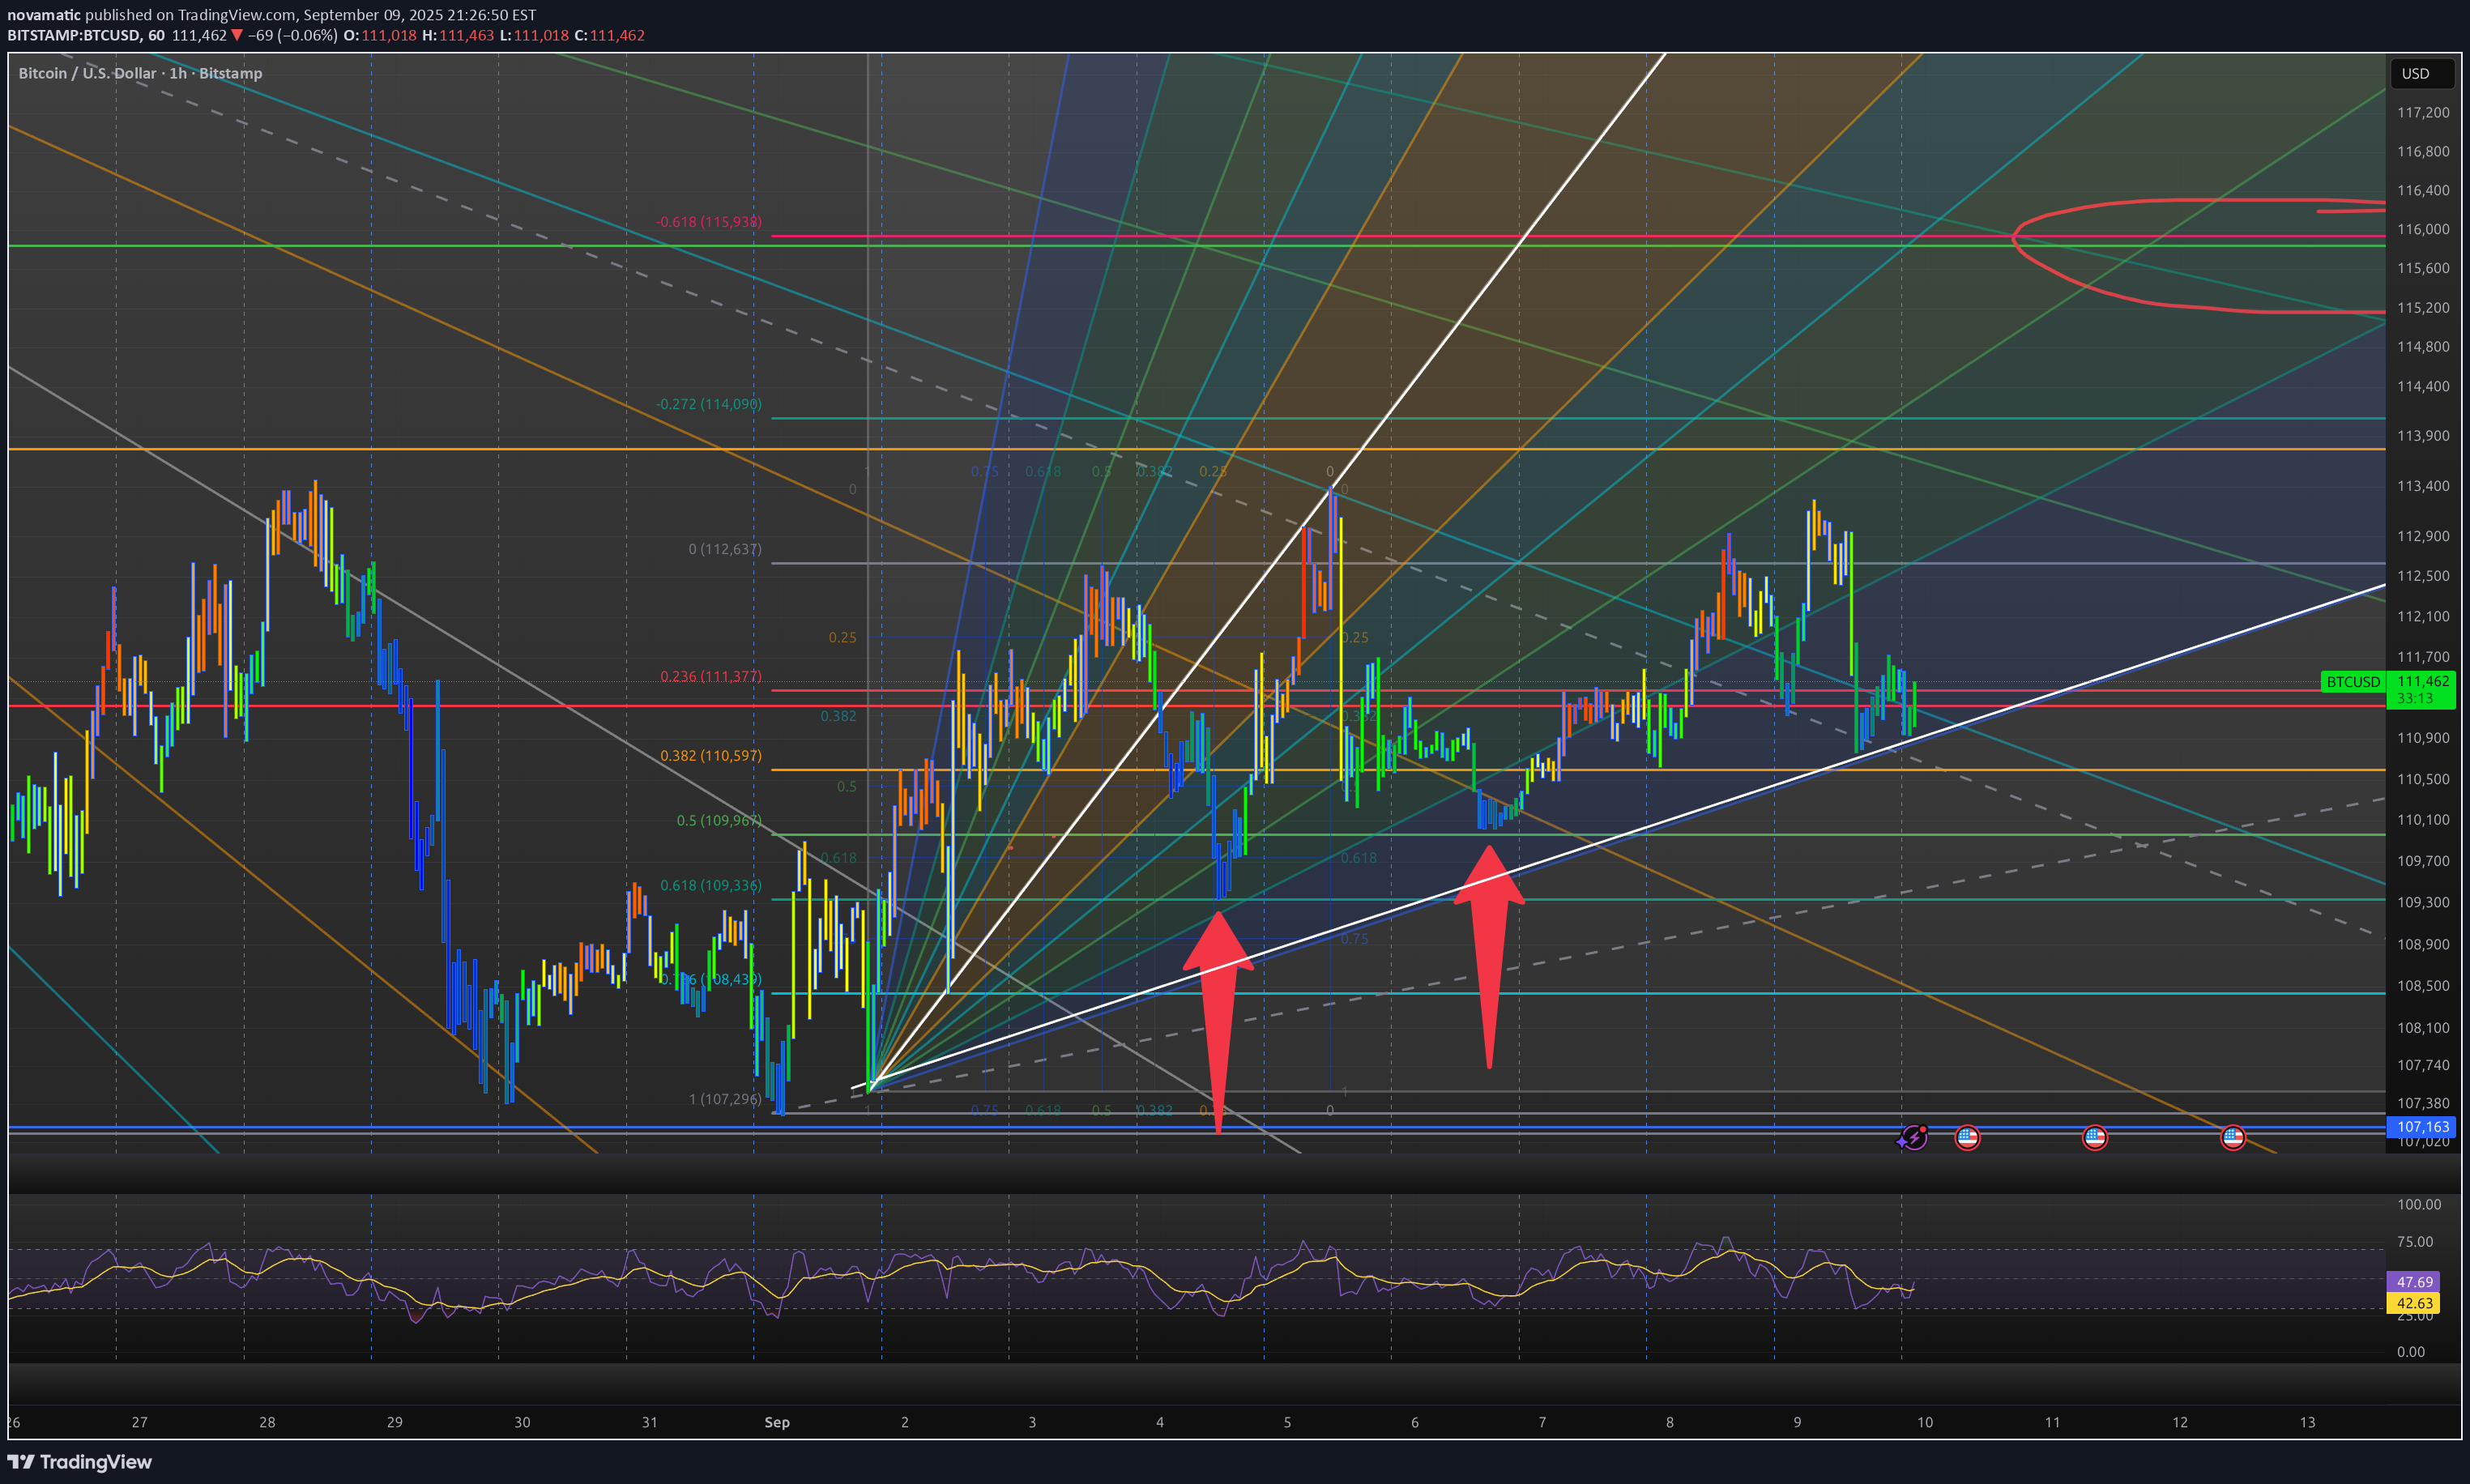
What I have here is a series of fib fans and a fib retracement. You can see we hit the 61.8 and 50% retraces (red arrows), perfectly. There is a confluence of targets above. Momentum is supportive.Target 1 almost hit. almost to fib.
novamatic
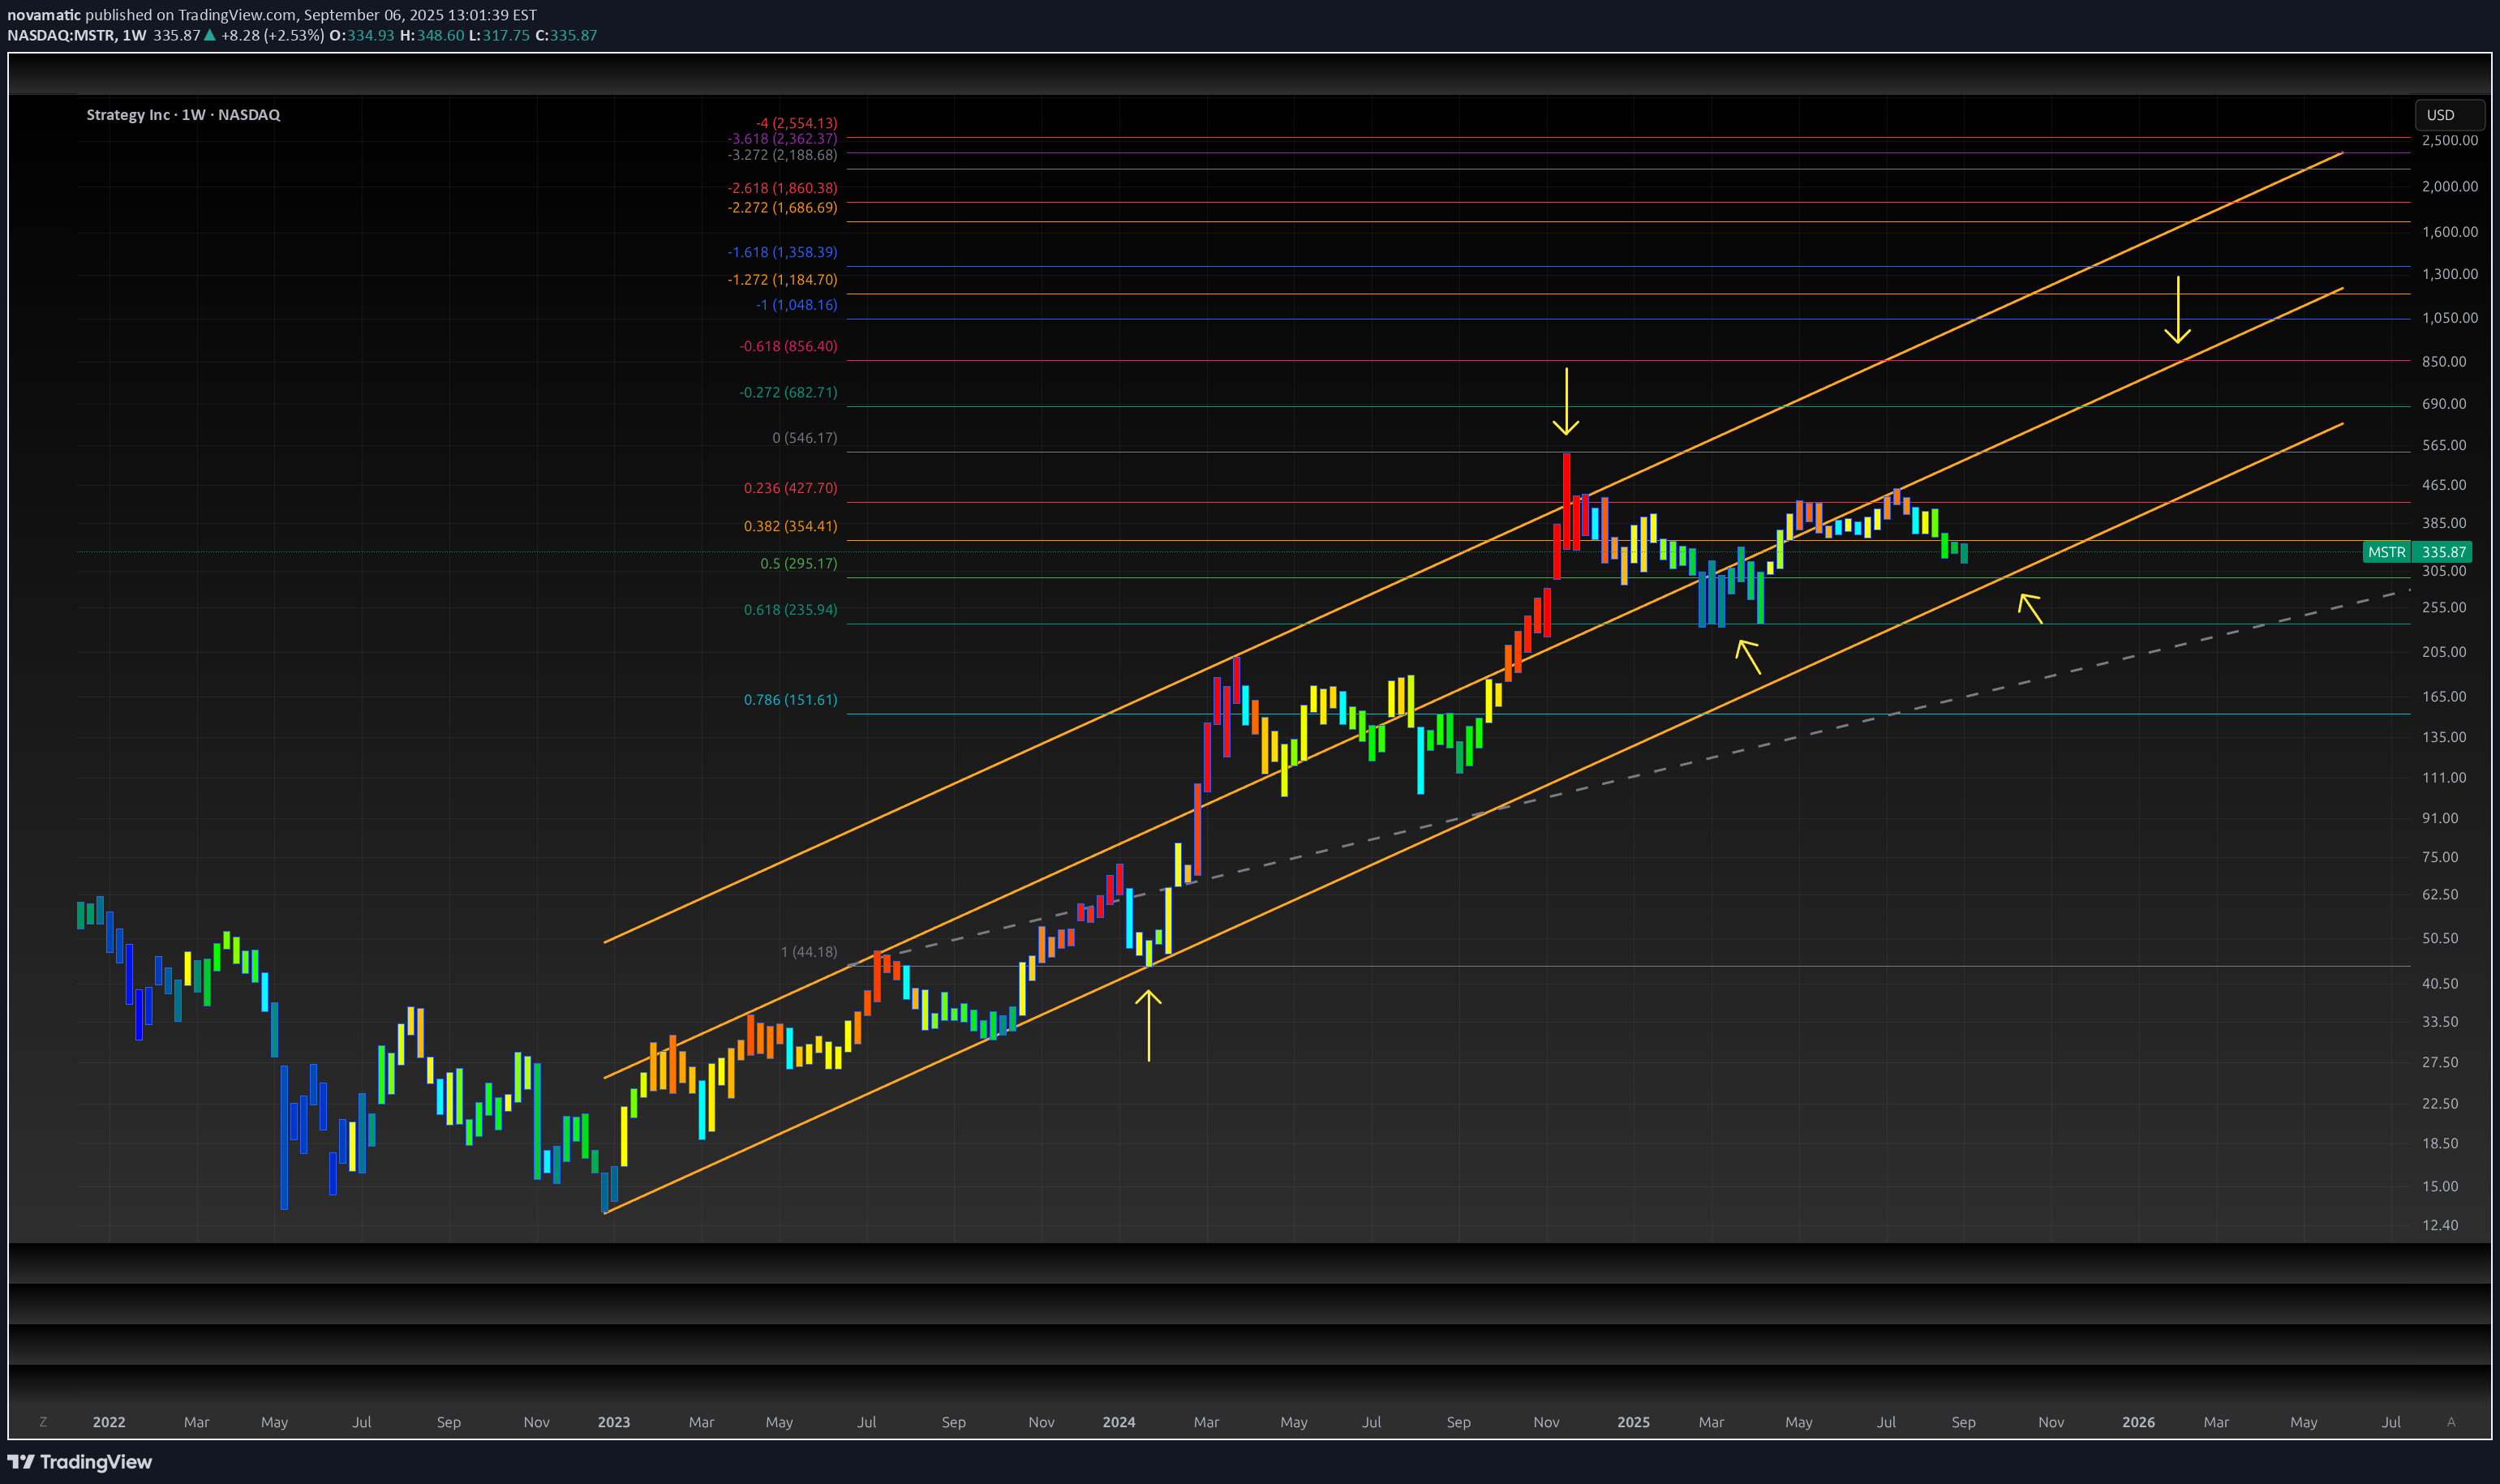
Howdy ho! I hope everyone is well. I'm going to put my best foot forward for my expectations for MSTR. Everyone was probably let down by the lack of inclusion in the S&P, on Friday. But that's OK! Hopefully this chart will help you with overall direction for MSTR. So what do we have? A validated fib (it's validated because it is anchored on the trendline and the previous extension gave us an absolutely perfect target at the high in 2024 at the 2.618. I will post this, below. A clear support trendline that perfectly aligns with the 50% retrace. A clear line of support on the 61.8, tested in March/April of 2025 at the $235 level. RSI is also starting to look supportive of a move up. Also of interest is the peak out of the channel, telling me we could explode higher out of this channel in the future. just something to watch for. Thanks and have a great one!Here's the first fib showing a PERFECT tap on the 2.618 extension.
novamatic
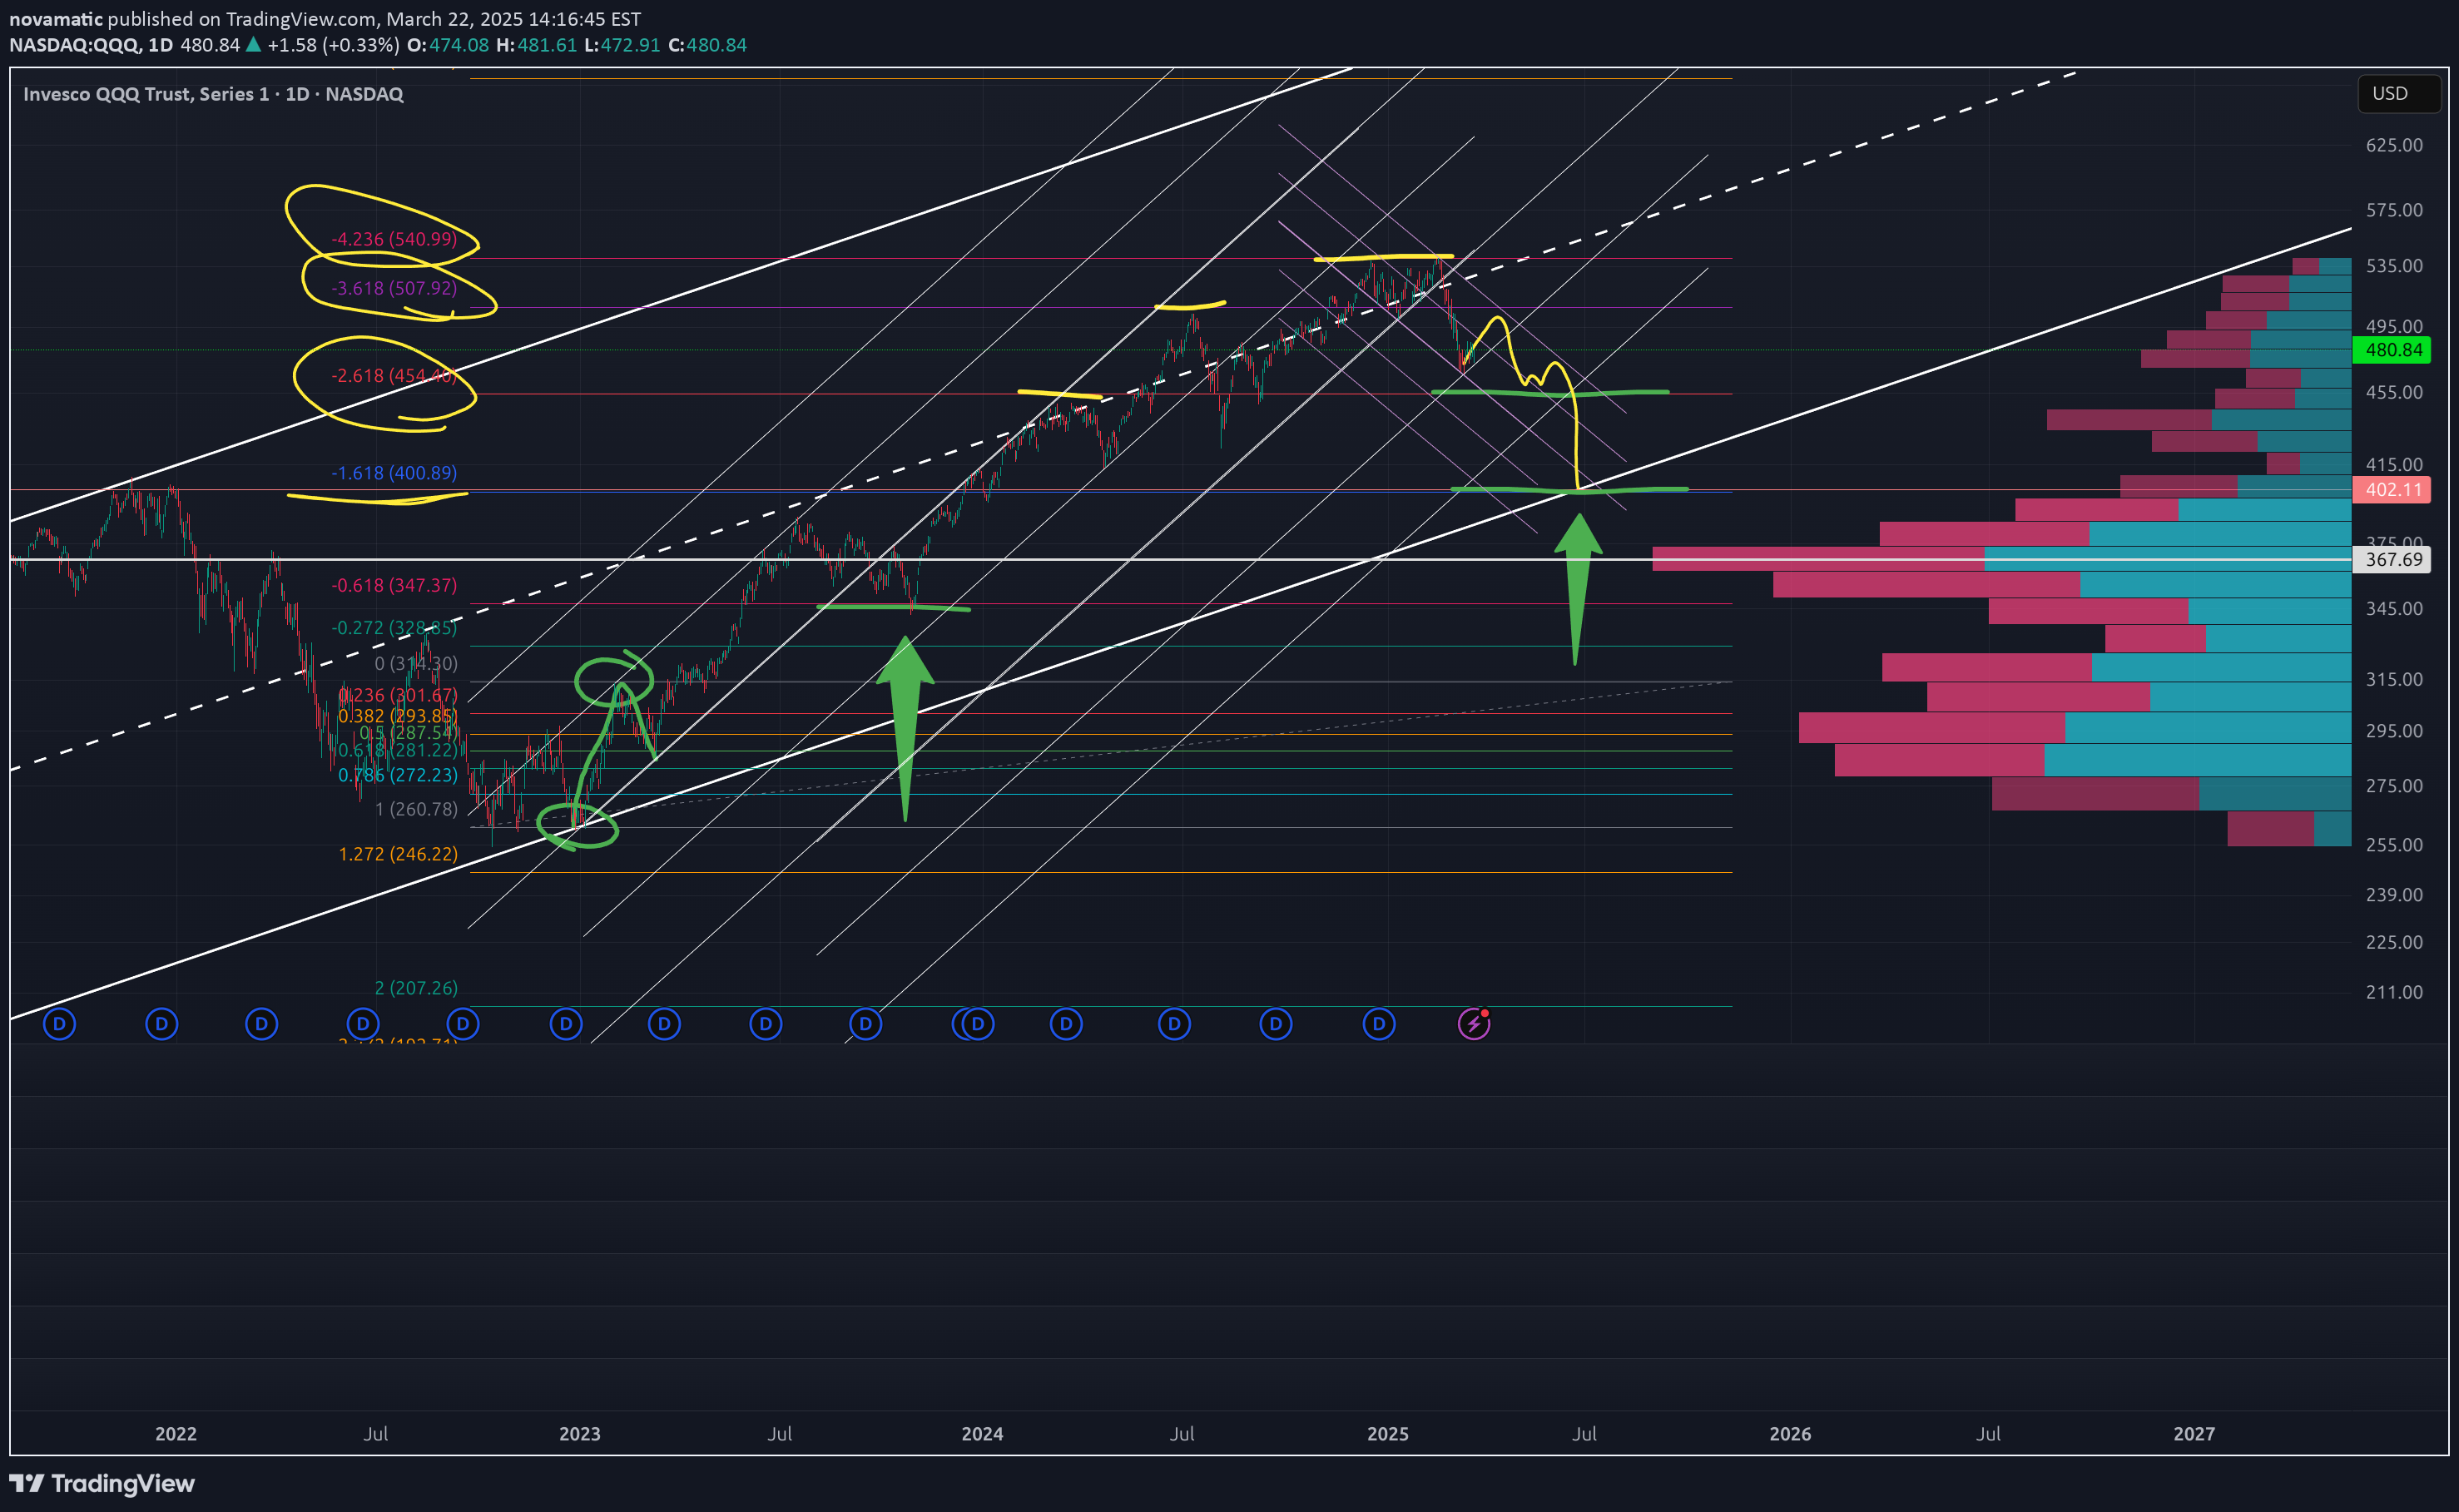
QQQ looks very weak. There are a few issues that lead me to believe $400 in June 2025 if a reasonable target: This area of the chat has very low volume and now structure - basically straight up on low volume. The chart is trading very technically using Fib levels (outlined with yellow / green lines). The market has a very high level of uncertainty, as do businesses and governments April 2 will likely be close to a top for the current retrace. Interestingly, the -1.618 just so happens to be the top reached in 2022. This is also likely to intersect the lower trendline (white) AND the volume shelf established as part of the previous high and retrace at the $400 level. What do you think?
novamatic
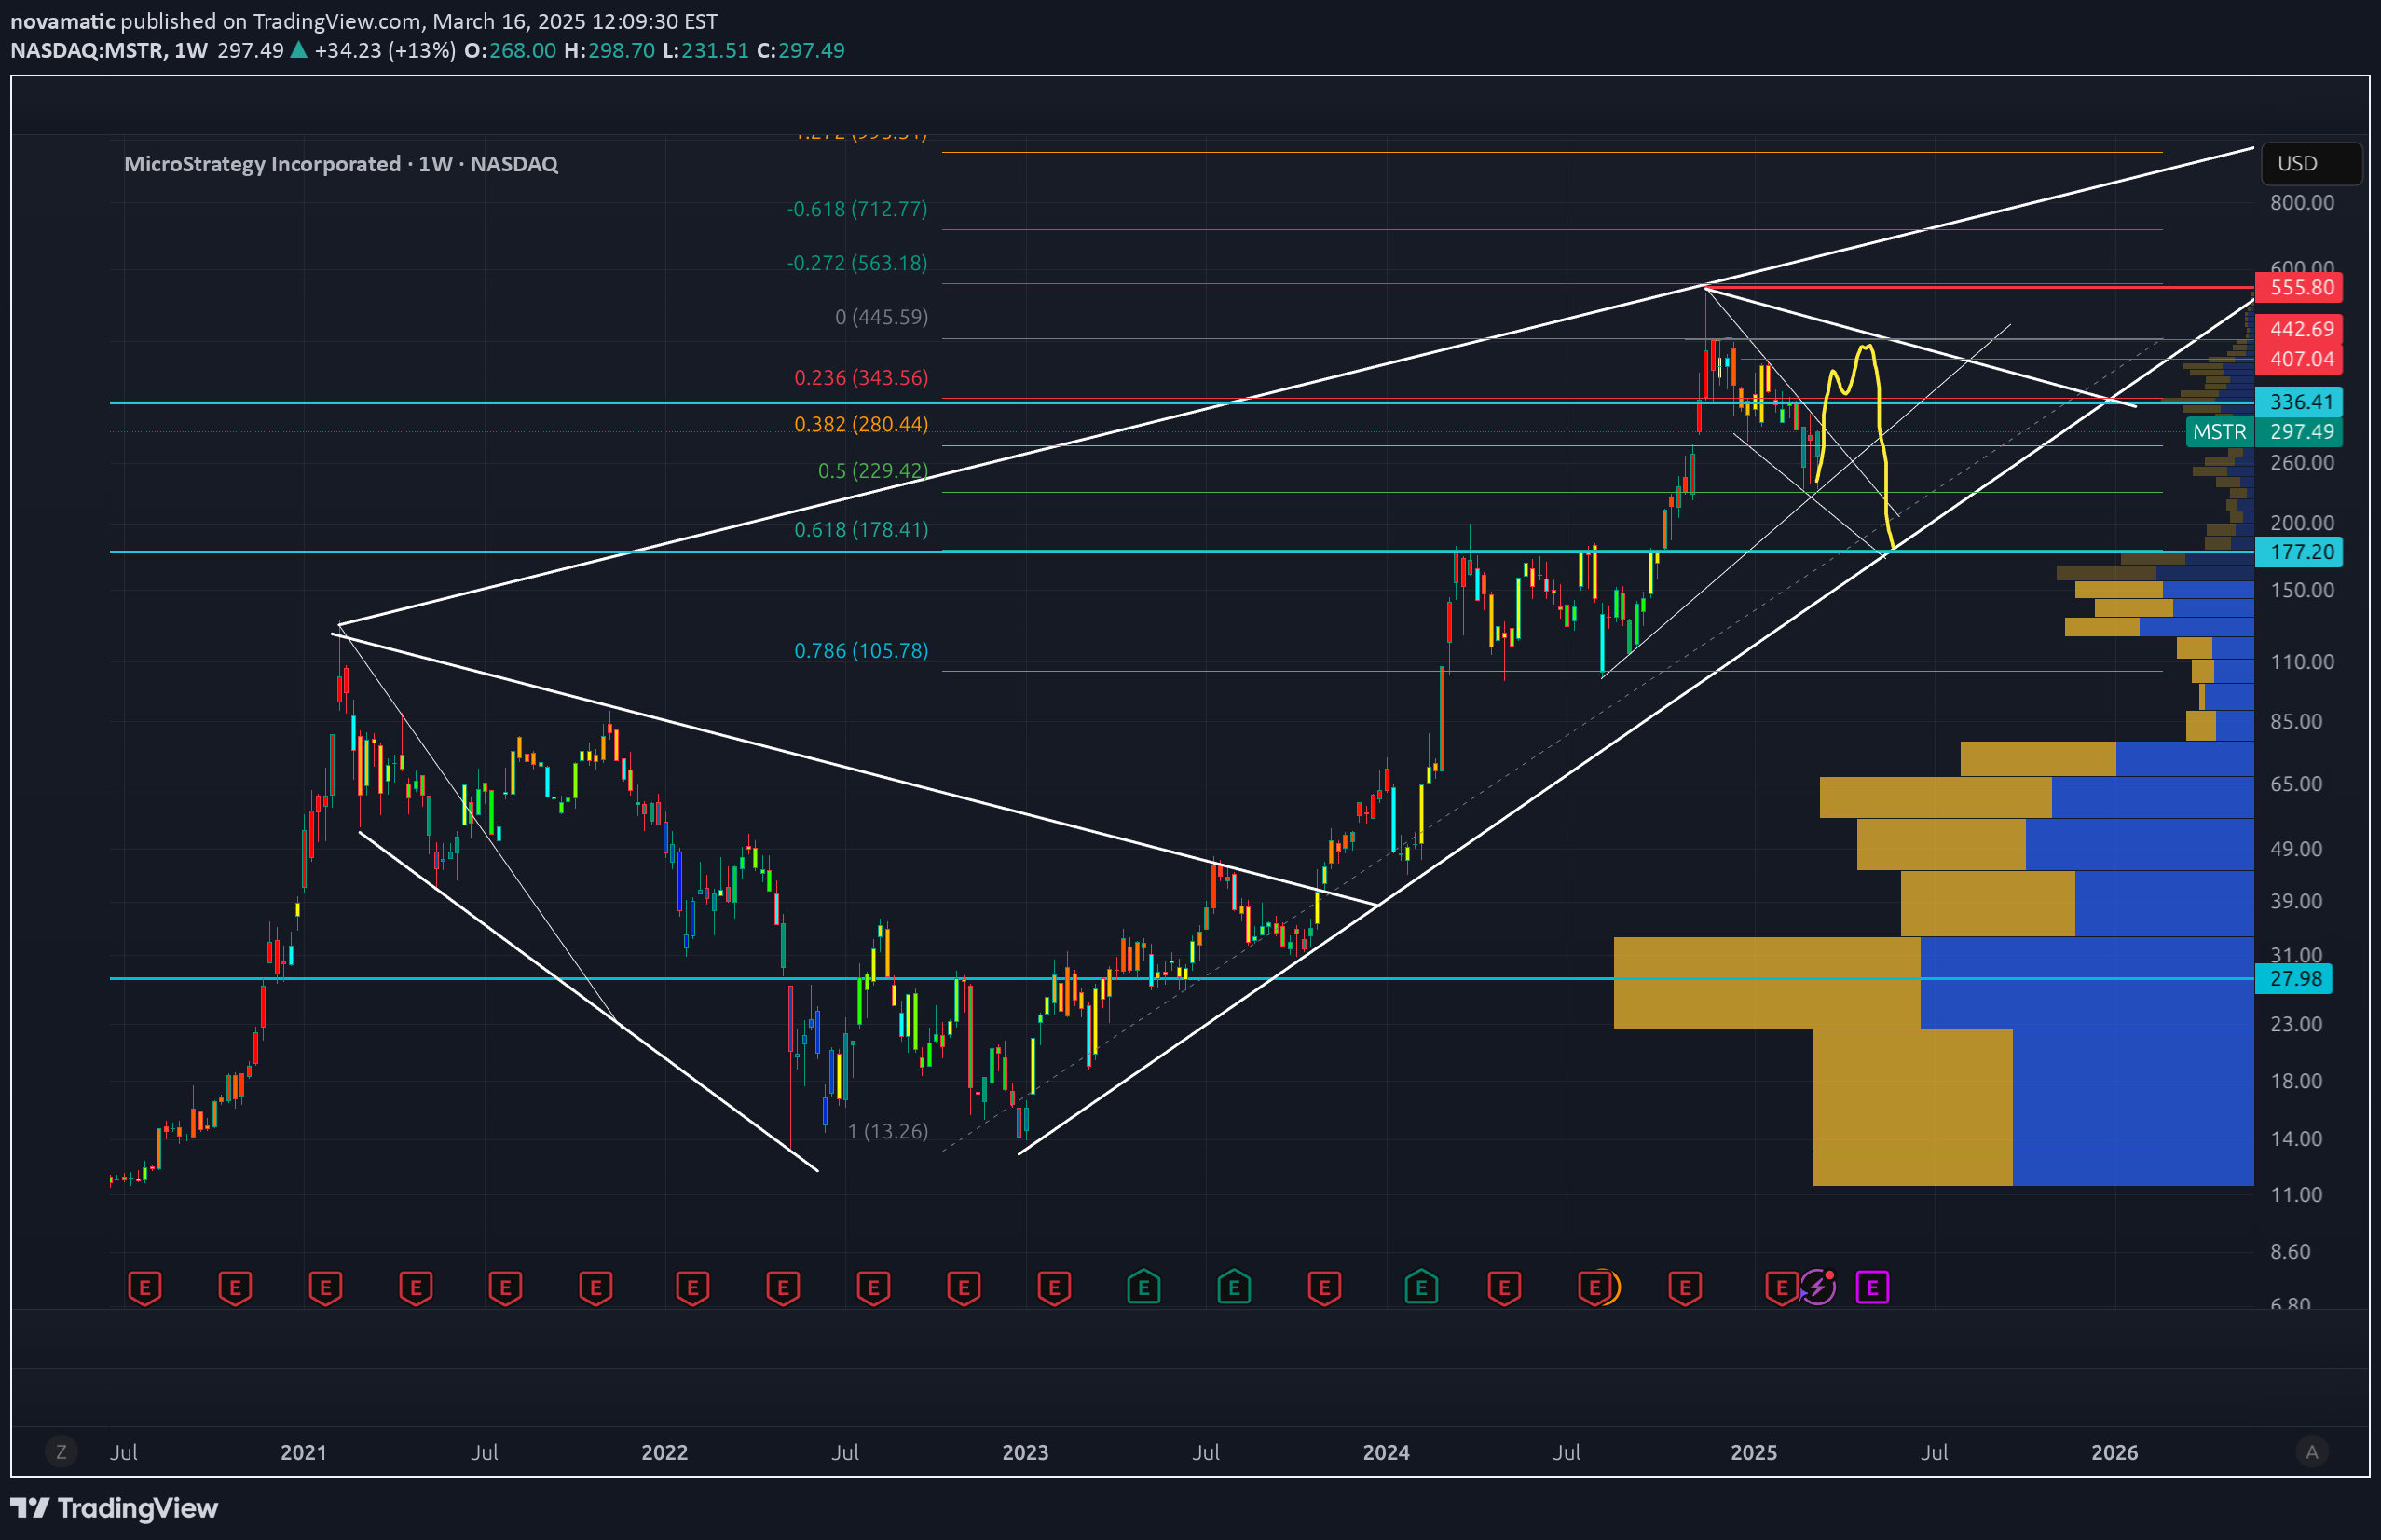
MSTR has a lot going on. I think we're going to see the chart build structure in this low volume top and ultimately retrace to important levels made in the year 2000. Specifically, $177. The $177 Price level has so many points of confluence it boggles the mind: $177 is the exact 61.8 retraca from the 2023 low of $13 $177 is the very strong resistance we saw in the first half of 2024 $177 is a key level from way back in the year 2000 (yes, MSTR was this high. In fact it hit a high of $336 way back then) $177 is also where the current lower trendline (log chart) and the 61.8 and the lower trendlien of the current wedge intersect. What do you think?Here is a monthly chart showing key levels from year 2000
novamatic
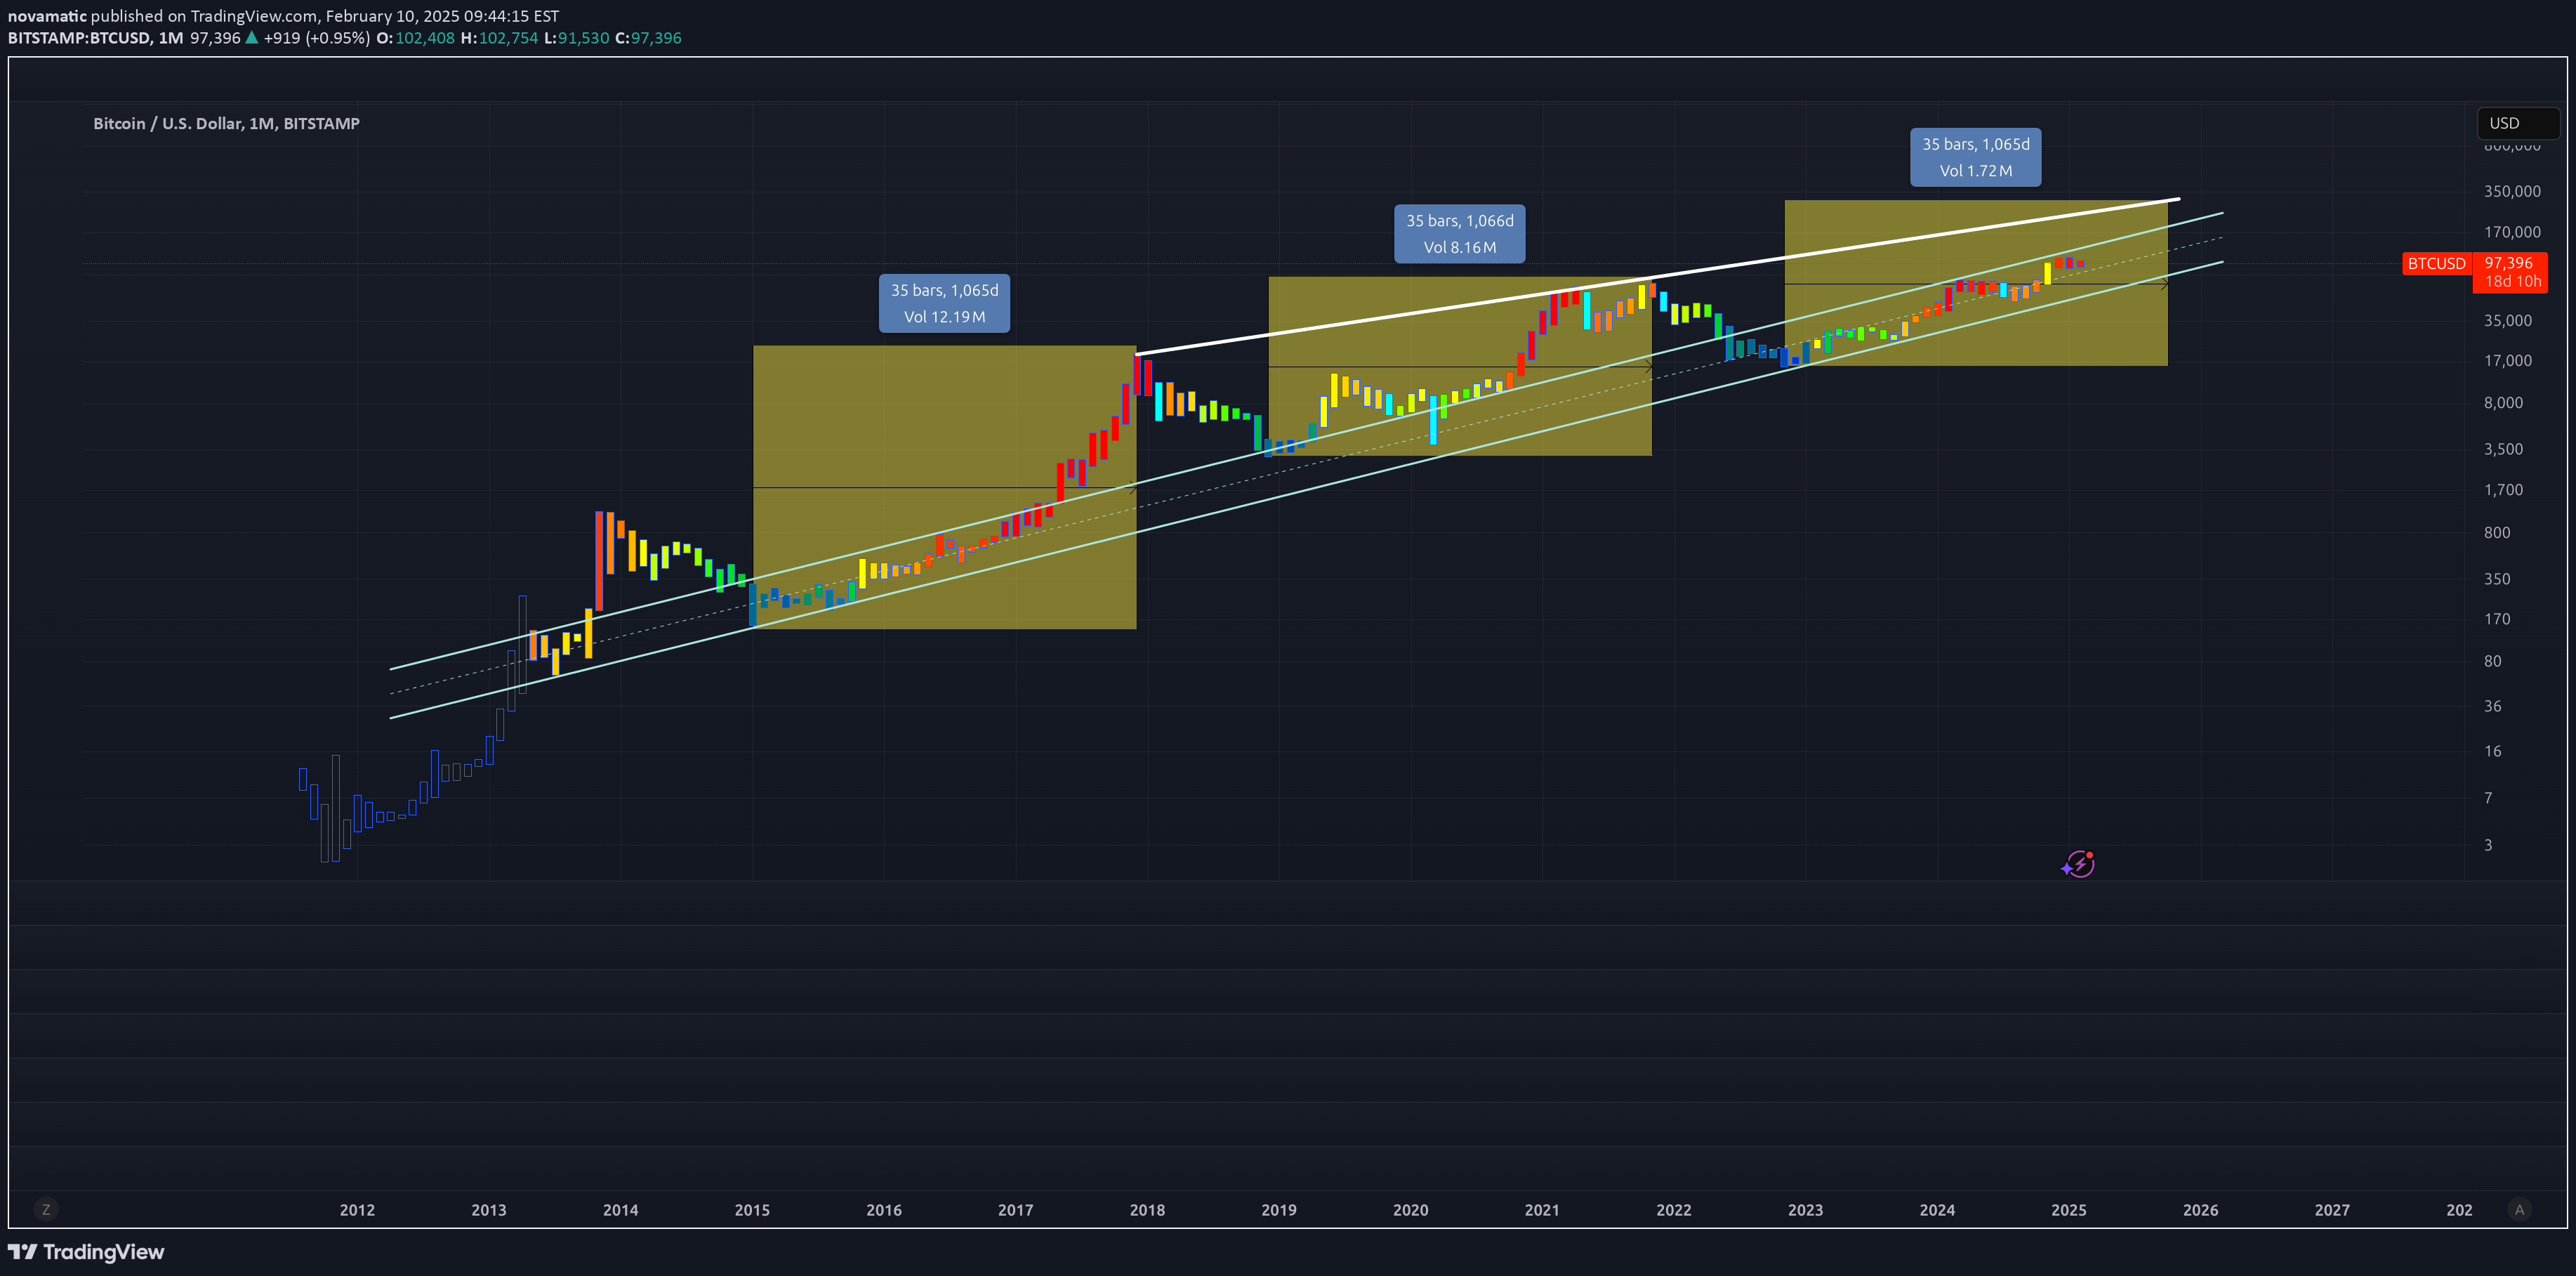
This is a log chart of BTC. it shows a few simple concepts.1. the importance of this long-term channel acting as support/resistance2. the oversold condition (blue bars) act as a launching point3. the duration of the launch seems to be 35 bars (months)4. the top trendline may be a good target for the next launch5. the channel centerpoint seems like a reasonable area of support as we move forward in the next few months.
Disclaimer
Any content and materials included in Sahmeto's website and official communication channels are a compilation of personal opinions and analyses and are not binding. They do not constitute any recommendation for buying, selling, entering or exiting the stock market and cryptocurrency market. Also, all news and analyses included in the website and channels are merely republished information from official and unofficial domestic and foreign sources, and it is obvious that users of the said content are responsible for following up and ensuring the authenticity and accuracy of the materials. Therefore, while disclaiming responsibility, it is declared that the responsibility for any decision-making, action, and potential profit and loss in the capital market and cryptocurrency market lies with the trader.