nevfell38
@t_nevfell38

What symbols does the trader recommend buying?
Purchase History
پیام های تریدر
Filter
nevfell38
BTCUSDT Technical Analysis
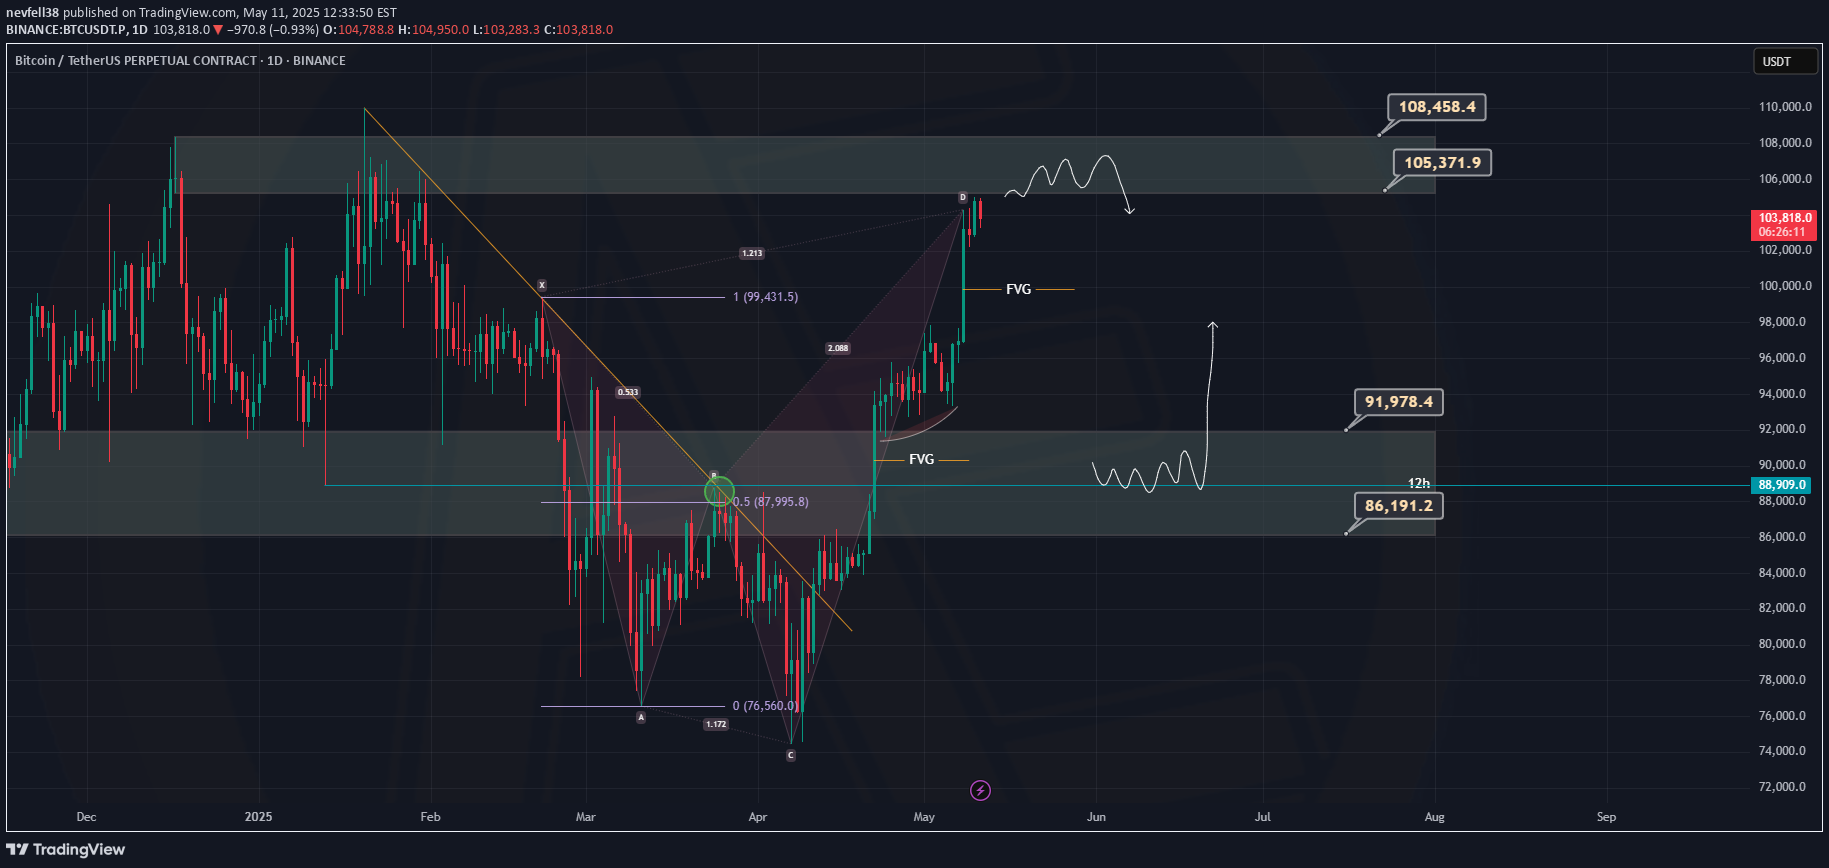
📊 BTCUSDT Technical Analysis – May 11, 2025 Hello traders! 👋 Here’s a fresh technical analysis on the BTC/USDT pair using the 1D timeframe. The chart highlights key supply and demand zones, harmonic structure, and two potential price scenarios for the coming weeks. 📌 Key Levels: Support Zone: 86,191 – 88,909 USDT Mid-Resistance: 91,978 USDT Major Resistance Area: 105,371 – 108,458 USDT 🔍 Technical Overview: After forming a strong bottom around 76,560, BTC reversed and surged upwards, filling the Fair Value Gap (FVG) created earlier. Price is now testing a critical supply zone. A rejection from here may lead to a pullback, possibly toward the 86k–89k range. If the support zone holds, it may act as a springboard for a new bullish wave targeting 105k and beyond. 🧭 Possible Scenarios: Rejection at Resistance: Consolidation or pullback from the 105k–108k zone followed by downward movement. Support Bounce: Rebound from 86k–89k support area leading to renewed bullish momentum. Sideways Action: Short-term consolidation in the current price range before direction is confirmed. 💬 What’s your outlook for BTC at this stage? Are you expecting a breakout or a pullback? Share your thoughts in the comments! 🔔 Stay tuned for more updates and trade safely!
nevfell38
#AAVE Spot Chart

#AAVE Spot Charthedes show that in certain incompatibilities, this is the most suitable purchase place for return. YTDHEDEFLER and ENTRY AREA Specified on Chart. Investment Consultancy Service is offered by the authorized organizations, taking into account the risk and return preferences of individuals. All information and analyzes, including verbal, written and graphic within the scope of this site or within the scope of our e-newspaper; It does not provide any guarantee, warranty and shared only for information to obtain information. Therefore, only based on the information contained here, the investment decision may not have consequences for your expectations.
nevfell38
1INCH Spot Chart

1INCH Spot Charthedefler Testing the same support for a certain year has been testing the same support. YTD targets and entry area on Chart. Legal Warning: Investment information, comments and recommendations on this site are not within the scope of investment consultancy. Investment Consultancy Service is offered by the authorized organizations, taking into account the risk and return preferences of individuals. All information and analyzes, including verbal, written and graphic within the scope of this site or within the scope of our e-newspaper; It does not provide any guarantee, warranty and shared only for information to obtain information. Therefore, only based on the information contained here, the investment decision may not have consequences for your expectations.
nevfell38
ANKR Long Setup 7R

ANKR Long Setup 7R Entry 0.022541 - 0.02455SL 0.02430Good Luck..Entry 0.02541 - 0.02455 The entry is still active and the transaction is in the entry!!
nevfell38
#ANKR Long Setup

Targets and entry are clear bon appetit..Entry 0.02522 - 0.02455STOP 0.02430If the opportunity allows, I am long idea from the region I specified..Legal Warning: Investment information, comments and recommendations on this site are not within the scope of investment consultancy. Investment consultancy services are provided by authorized institutions on a personalized basis, taking into account the risk and return preferences of individuals. All information and analyses, including verbal, written and graphical, on this site or within the scope of our e-bulletins; do not constitute any guarantee or warranty in terms of forming the basis of any decision and are shared only for informational purposes. Therefore, making an investment decision based solely on the information here may not produce results that meet your expectations.
nevfell38

nevfell38

nevfell38

nevfell38
#KDA LTF Chart 1H

#KDA LTF Chart 1H#KDA should be watched right now because there are eq areas above and below, according to the harmonic, you can take the eqh above first and follow after the fakeout. 🍒👍
nevfell38
#WIF 1D Chart
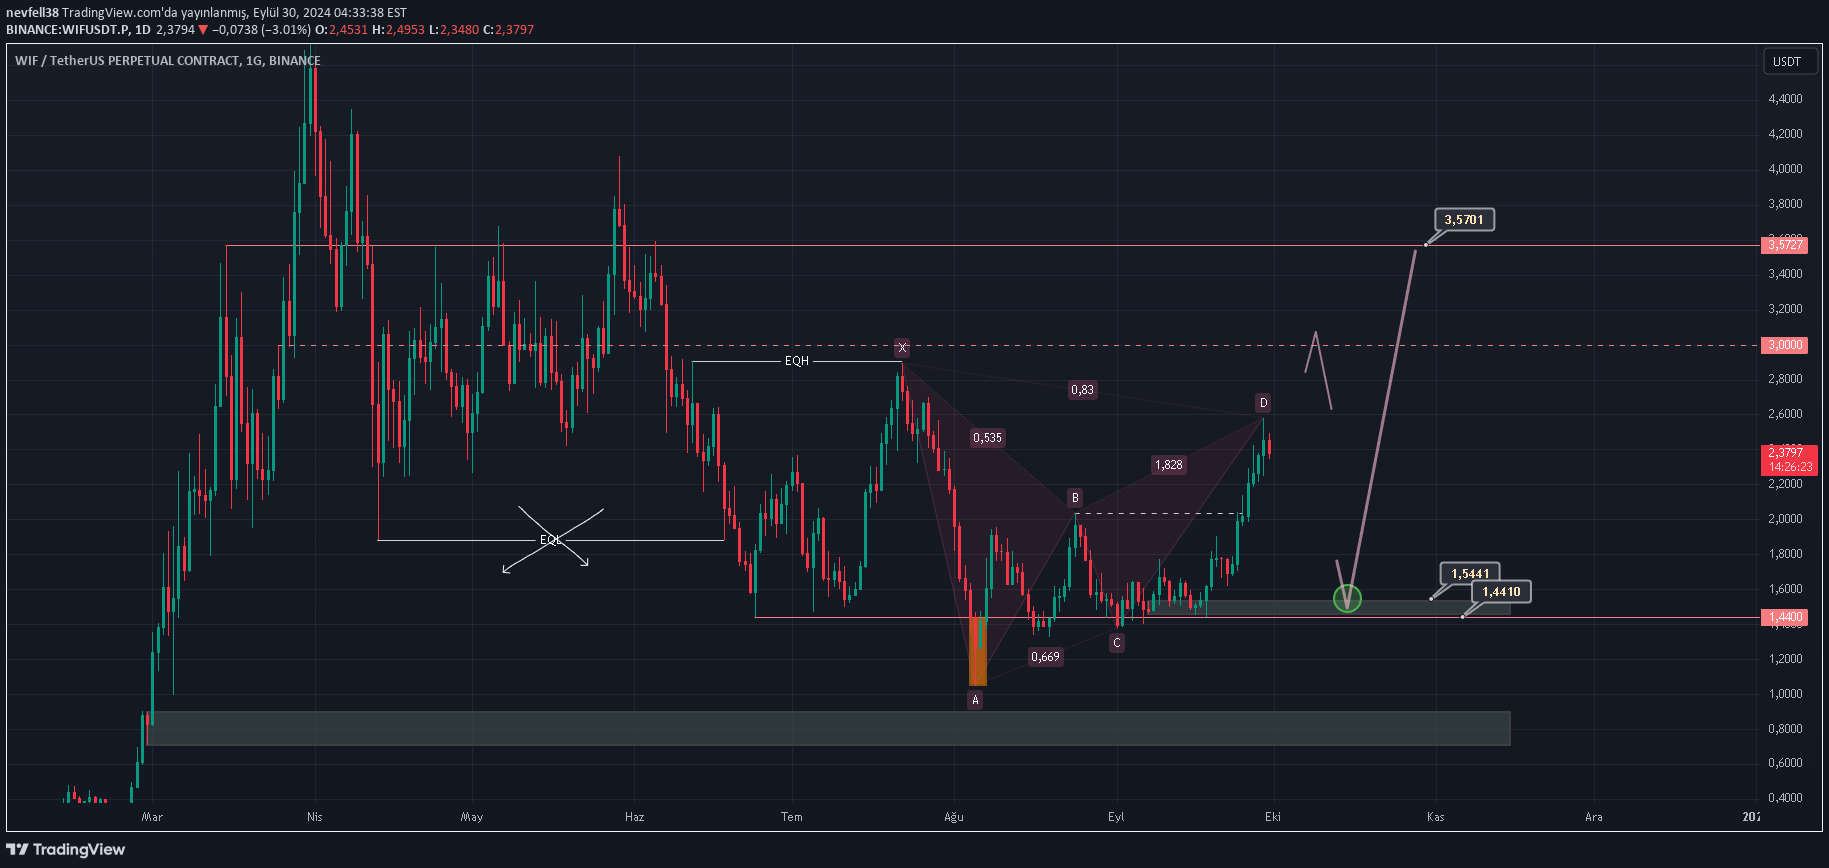
#WIF For Chart 1DWIF, after the above eqh purchase, you can wait for a return confirmation or you can wait for confirmation from the upper local peak. It is not appropriate to take a long trade outside the green circle at the moment.
Disclaimer
Any content and materials included in Sahmeto's website and official communication channels are a compilation of personal opinions and analyses and are not binding. They do not constitute any recommendation for buying, selling, entering or exiting the stock market and cryptocurrency market. Also, all news and analyses included in the website and channels are merely republished information from official and unofficial domestic and foreign sources, and it is obvious that users of the said content are responsible for following up and ensuring the authenticity and accuracy of the materials. Therefore, while disclaiming responsibility, it is declared that the responsibility for any decision-making, action, and potential profit and loss in the capital market and cryptocurrency market lies with the trader.