
mudusir
@t_mudusir

What symbols does the trader recommend buying?
Purchase History
پیام های تریدر
Filter
mudusir
BTC Weekly Analysis – Major Bearish Setup Forming?
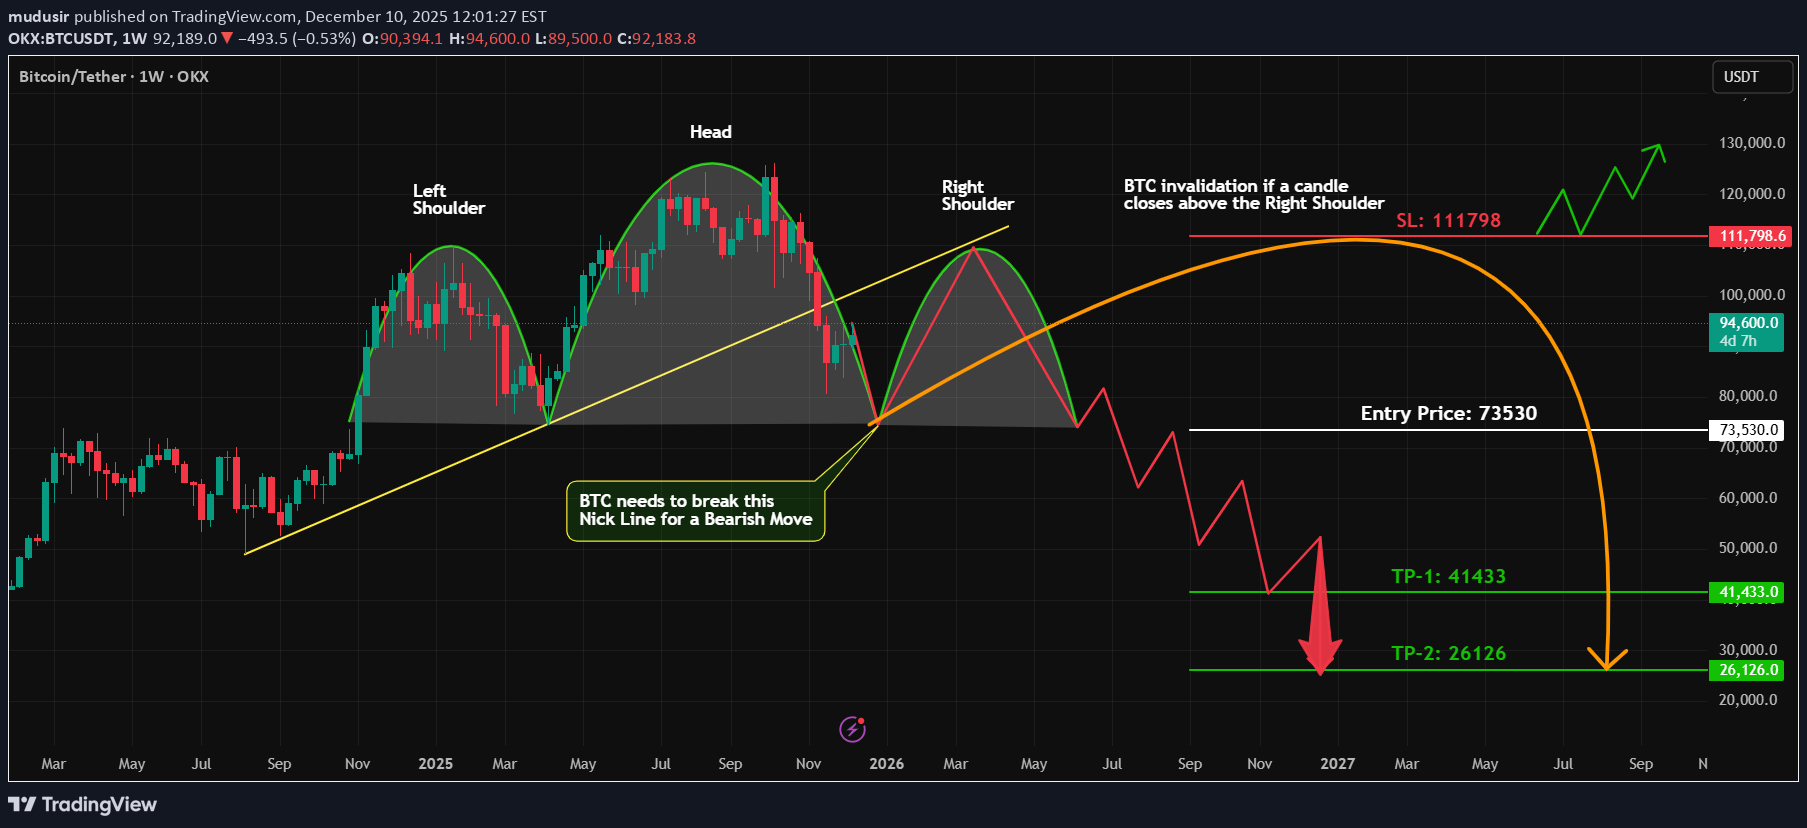
#BTC has broken below the key trendline and continues to hold in a bearish structure. On the weekly timeframe, the price action is showing a potential Head & Shoulders formation, and what makes this pattern even more significant is the strong bearish divergence appearing on the head of the structure. This combination of trendline break + bearish market structure + divergence strengthens the probability of a larger downside move. However, patience is key. Before taking any short position, I will wait for: Completion of the right shoulder A clear break below the neckline A clean retest of the neckline to confirm bearish continuation Only then will I look for a short entry with strict risk management and clear invalidation levels. If this setup plays out, #BTC could deliver a high-probability move on the weekly chart. Watching this closely. If you find this analysis helpful, hit LIKE and drop your thoughts in the comments. Follow for more advanced #BTC setups, market structure breakdowns, and confluence-based trading ideas! #BTC #Bitcoin #Crypto #TradingView #CryptoAnalysis #HeadAndShoulders #BearishDivergence #PriceAction #TrendlineBreak #WeeklyTimeframe #CryptoTrader #RiskManagement #BTCAnalysis #CryptoSetup
mudusir
پولکادات (DOT): آیا الگوی سر و شانه معکوس، قیمت را منفجر میکند؟ (تحلیل 4 ساعته)
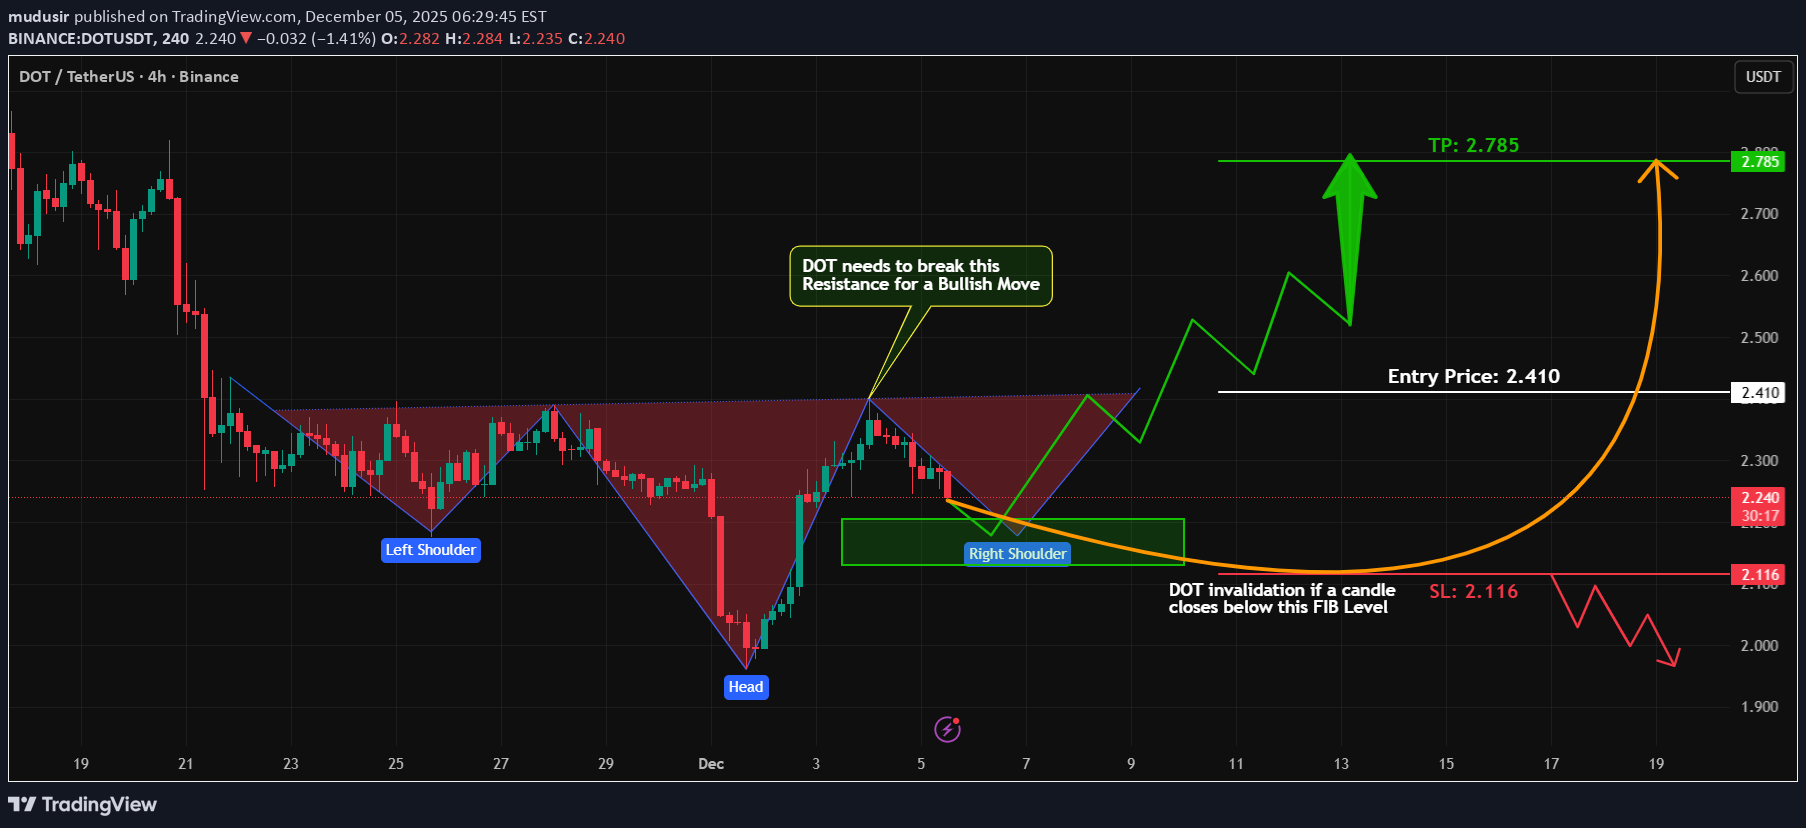
#Polkadot (#DOT) is showing a strong bullish reversal signal on the 4-hour timeframe, where the price is developing a clean Inverse Head & Shoulders pattern. Currently, #DOT is forming the right shoulder, indicating that buyers are stepping in and market structure is shifting toward the upside. Key Highlights Inverse H&S pattern active on 4H Right shoulder formation underway Breakout expected above the neckline + resistance zone High-probability setup for a trend reversal Focus on confirmation, not anticipation Trading Plan I will wait for: Breakout above the neckline/resistance Successful retest with bullish confirmation Long entry with strict risk management Targets will be based on measured move of the pattern and key supply zones. Risk Management Always trade with: Stop-loss below the right shoulder Strict position sizing Market structure validation What do you think? Do you expect #DOT to break out or reject the neckline? Share your thoughts in the comments! If you found this helpful, like, follow, and comment for more high-probability setups on BTC, ALTCOINS, FOREX & Indices. #DOT #Polkadot #Crypto #Altcoins #InverseHeadAndShoulders #ChartPattern #CryptoTrading #TechnicalAnalysis #4HChart #BullishReversal #PriceAction #TradingStrategy #LongSetup #BreakoutTrading
mudusir
سولانا در آستانه انفجار؟ نقشه راه معامله برای بازگشت قدرتمند SOL!
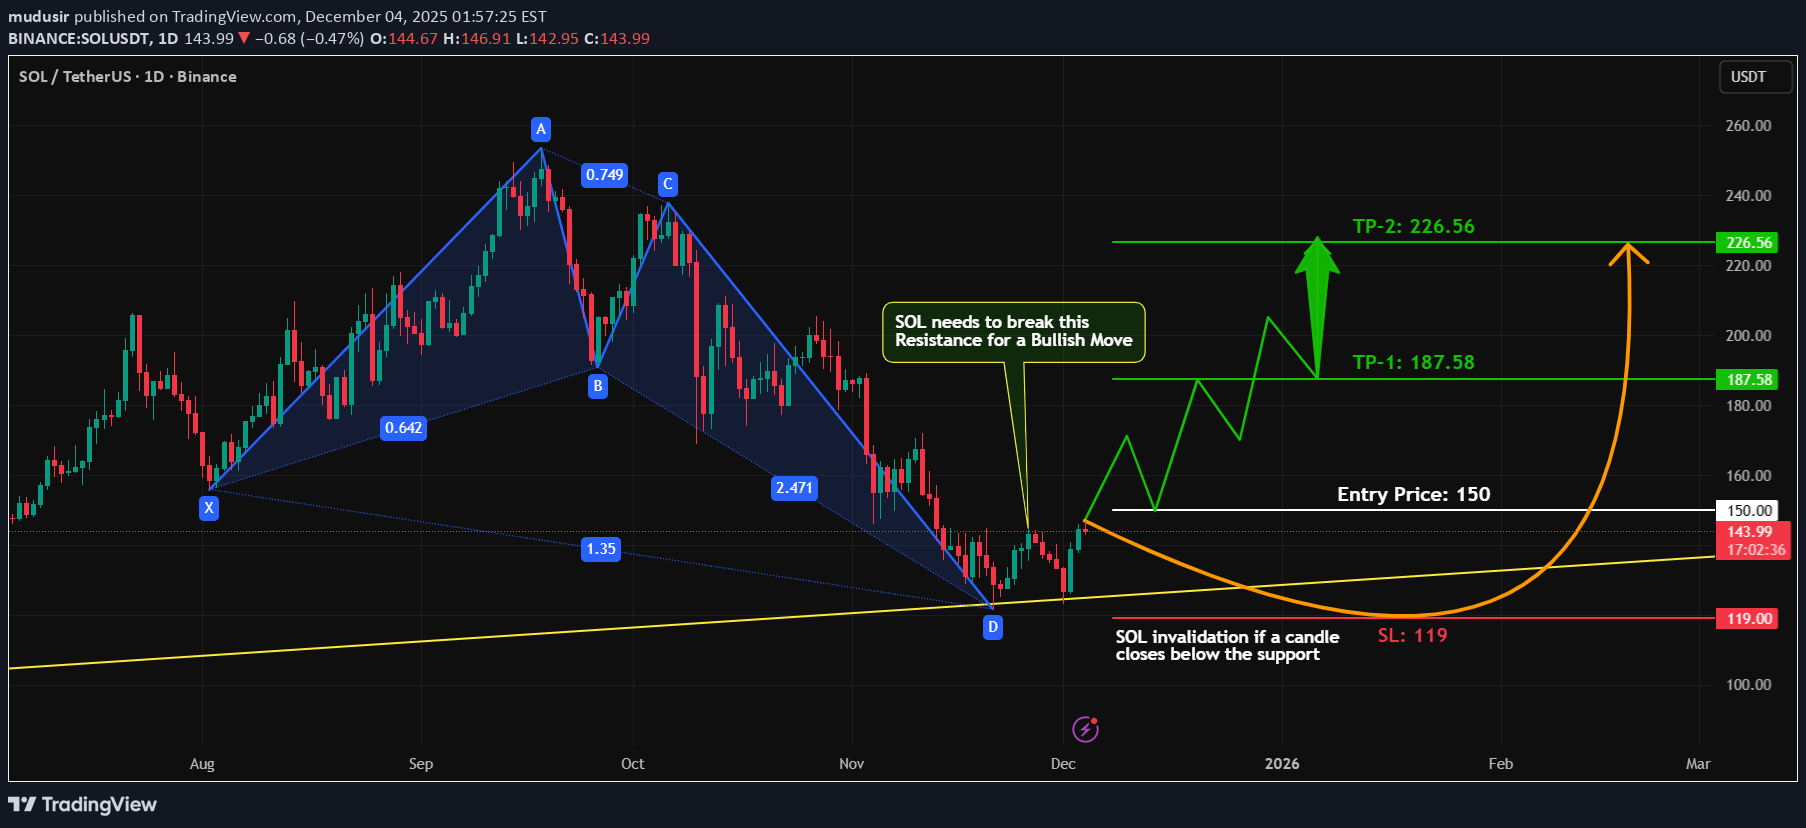
SOL (Solana) – Advanced Harmonic Completion + Trendline Confluence | Break & Retest Strategy #SOL remains within a broader downtrend on the higher timeframe, but the recent 1D structure is showing an important technical development. Price has completed a harmonic pattern directly on a major multi-touch trendline, creating a strong confluence zone with potential for a reversal. Despite the existing downtrend, there is no confirmed bearish continuation signal. Momentum is slowing down, suggesting that sellers may be losing strength. Technical Breakdown Harmonic Completion Zone (HCZ) Price has tapped a harmonic completion area aligning with a Fibonacci cluster, prior demand, and trendline support. This makes it a high-value level for reaction. Trendline Confluence #SOL continues to respect the ascending trendline. Current candles show corrective movement rather than impulsive sell pressure. Trading Strategy Bullish Plan: Wait for a clean breakout above resistance. Look for a retest into the breakout zone. Confirm long entries through bullish rejection or engulfing structure. Stop loss below structural lows. Target next liquidity pools with a minimum 1:2 R:R. This ensures entries are backed by confirmation rather than anticipation. Bearish Consideration: As long as resistance holds, the overall market remains in a downtrend. Failure to break the level may result in continuation to the downside. Summary Harmonic pattern completed at a strong confluence area. Trendline support remains respected. No bearish continuation signal at current levels. Bullish scenario only valid after breakout and retest. Structure confirmation is essential to avoid premature entries. #SOL #Solana #CryptoAnalysis #TechnicalAnalysis #HarmonicPattern #Trendline #MarketStructure #BreakAndRetest #PriceAction #CryptoTrading #TradingStrategy #Altcoins #CryptoChart #TradingView
mudusir
سیگنال ریزشی بیت کوین: 4 نشانه قوی برای سقوط BTC!
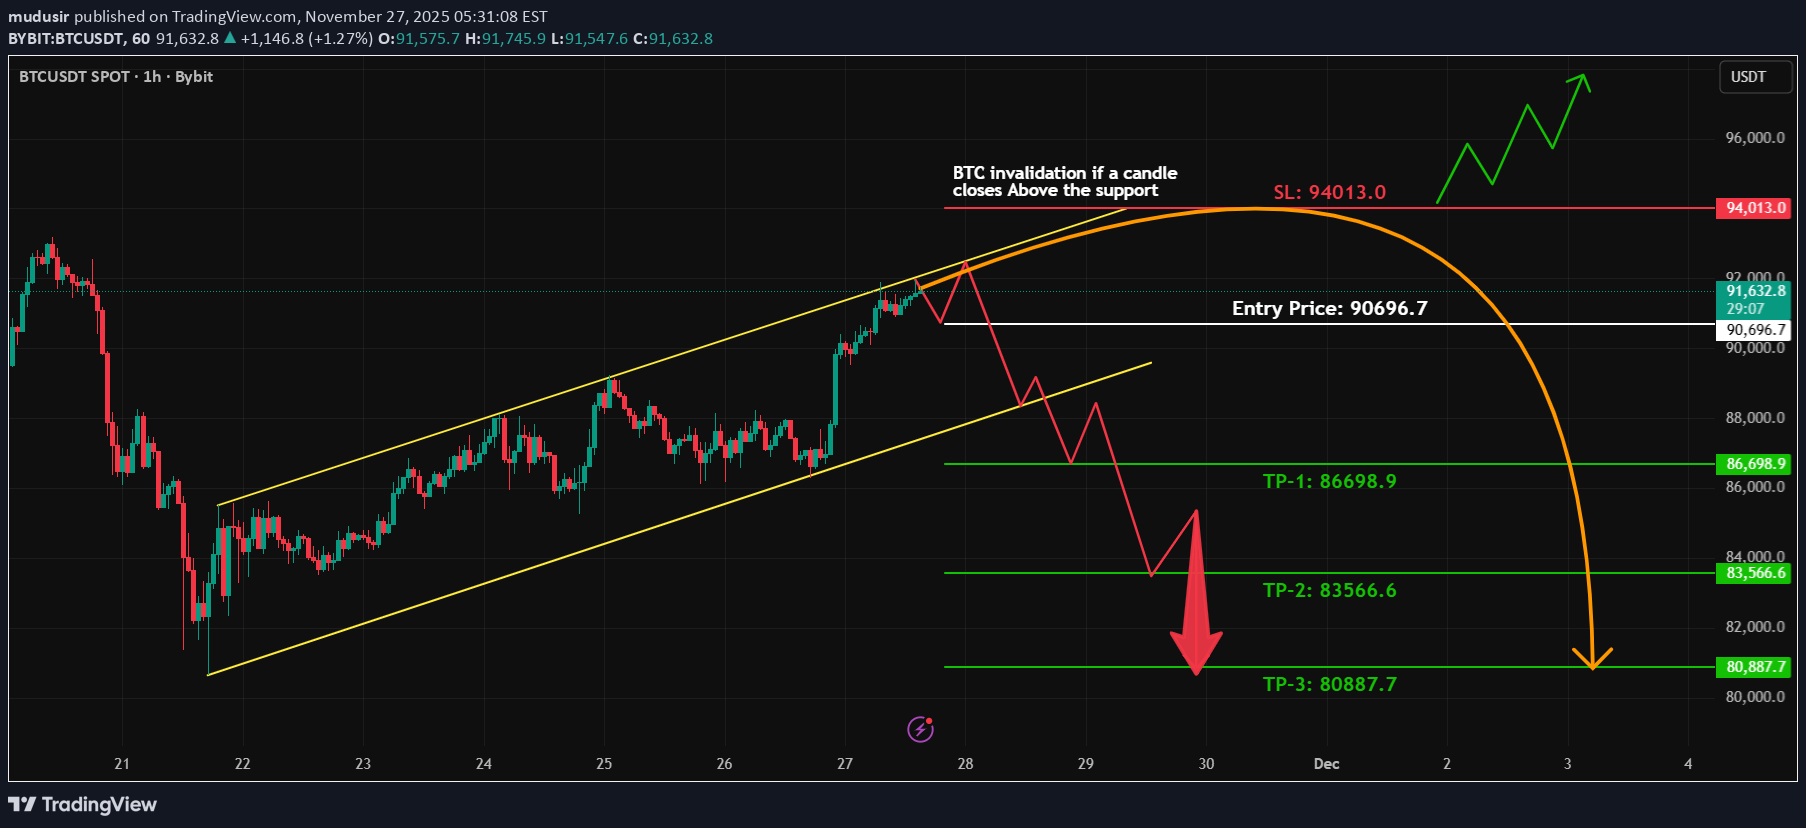
Price at Decision Zone – Bears Preparing for the Next Move After the recent downside move, Bitcoin printing Lower Highs (LHs) — a classic sign of fading bullish strength. #BTC is now testing the upper descending trendline, an area where price has consistently faced rejection. Bearish Confluences Building Up 1️⃣ Lower High Structure Market structure is shifting bearish as #BTC keeps forming LHs. 2️⃣ Trendline Retest Price is touching the upper trendline, a key rejection zone in this downtrend. 3️⃣ 30-Min Bearish Divergence Momentum is slowing down while price pushes up — a reliable early signal of weakness. 4️⃣ No Strong Bull Confirmation Yet For a real trend reversal, #BTC must reclaim 80,000 and show bullish divergence, which is currently absent. Trade Plan I will look for a short entry once #BTC breaks the minor intraday support level. ✔ Stop-loss: Above the most recent LH ✔ Targets: Local liquidity zones below ✔ Strict risk management—no chasing Bias With structure, divergence, and trendline all aligned, probability favors a bearish continuation unless bulls reclaim major levels. What’s your view? Will #BTC break lower or surprise with an unexpected bounce? 👍 LIKE for more setups 💬 COMMENT your bias ⭐ FOLLOW for premium BTC, GOLD & FX ideas #Bitcoin #BTCUSD #Crypto #TradingView #PriceAction #CryptoAnalysis #BTC #ShortSetup #BearishDivergence #TrendlineTrading #TechnicalAnalysisTrade is still valid, wait for the break the 90k point for the bearish movement.Trade is active.1st TP hit, u can move ur SL at break even point and also closed 50% trade in profit at 1st TP. and wait for the final TP.Our 50% trade is closed in profit, and 50% is closed at break even point.
mudusir
بیت کوین در اوج صعودی: تحلیل تکنیکال برای رسیدن به تارگت ۱۴۰ تا ۱۵۰ هزار دلار!
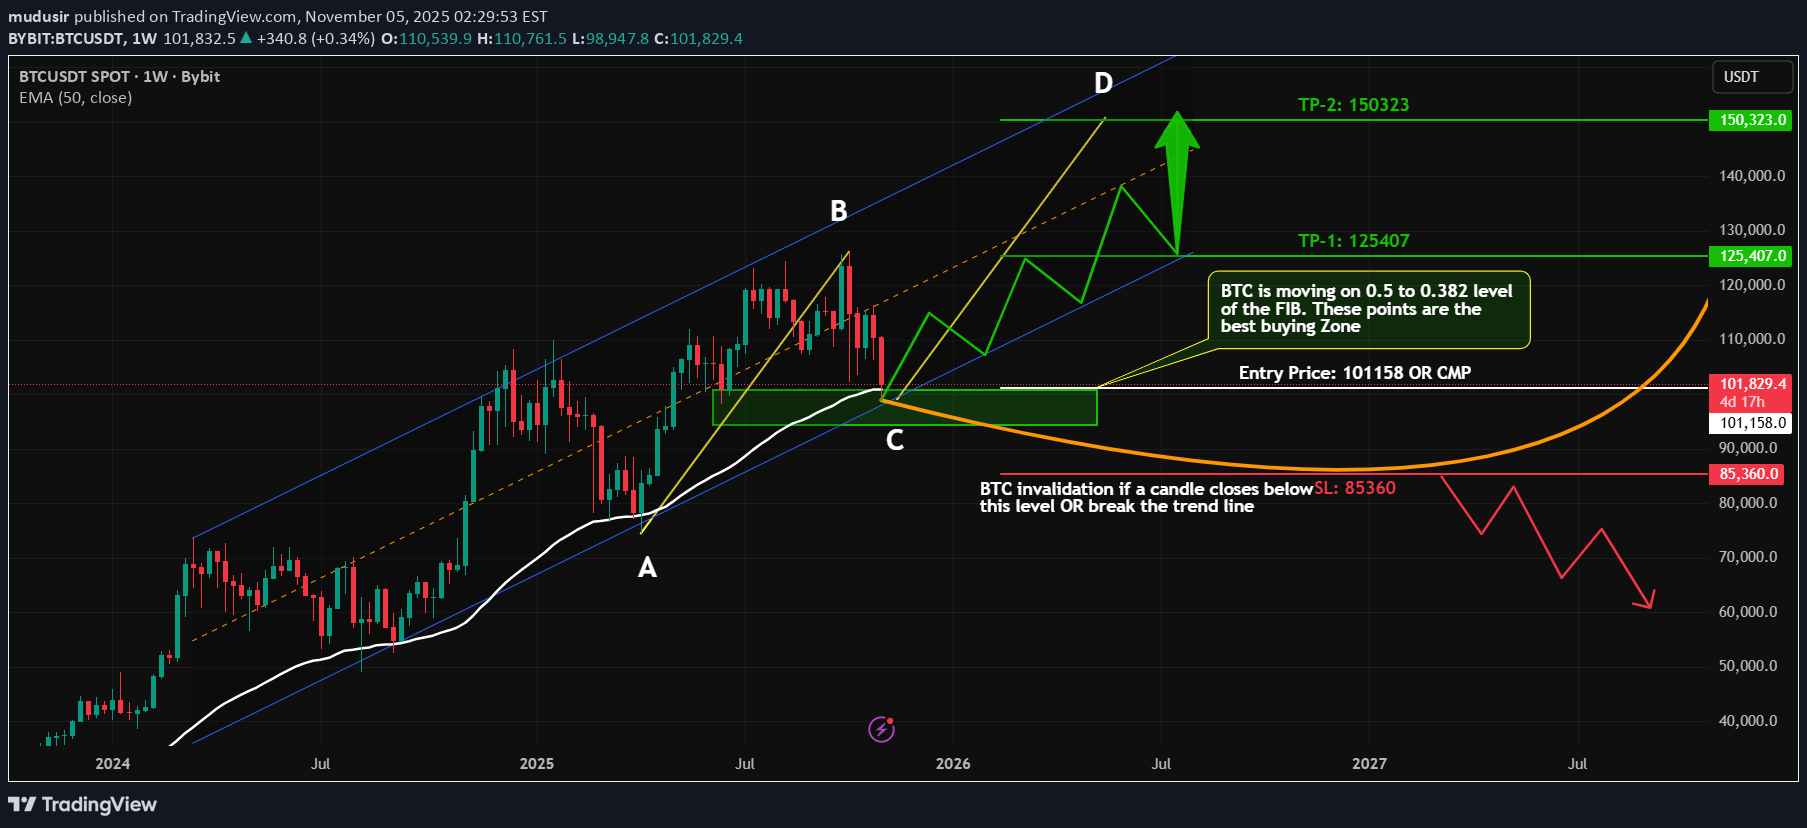
In the start of 2025 (10 Feb), I shared a #BTC analysis when Bitcoin was trading around 95K, and our buying zone was clearly mentioned between 86K – 79K. #BTC perfectly touched this zone and gave over 100% return! Our position is still active and in strong profit. Now, once again on the weekly timeframe, #BTC is showing a potential AB=CD pattern formation. Currently, #BTC is moving within the Fibonacci golden zone (0.382–0.5), testing the trend line, and testing the EMA 50, theses are strong technical confluence zones for a bullish continuation. Spot Trade Plan: We will accumulate #BTC at CMP (Current Market Price). Futures Trade Plan: For confirmation, we will wait for: A bullish candle on the 1D timeframe A bullish divergence on the 4H chart A clear breakout of the resistance zone Once confirmed, we’ll look for a long setup with proper risk management. Trend Outlook: #BTC remains in a strong uptrend, and the next potential target zone could be around 140K – 150K if bullish momentum continues. What’s your view on #BTC — are you bullish or expecting a deeper correction? Drop your thoughts below! #BTC #Bitcoin #Crypto #BTCUSD #CryptoAnalysis #TechnicalAnalysis #TradingView #Bullish #ABCDPattern #Fibonacci #Uptrend #EMA50
mudusir
هشدار جدی بیت کوین در تایم فریم 4 ساعته: آیا الگوی سر و شانه ریزش بزرگ را رقم میزند؟
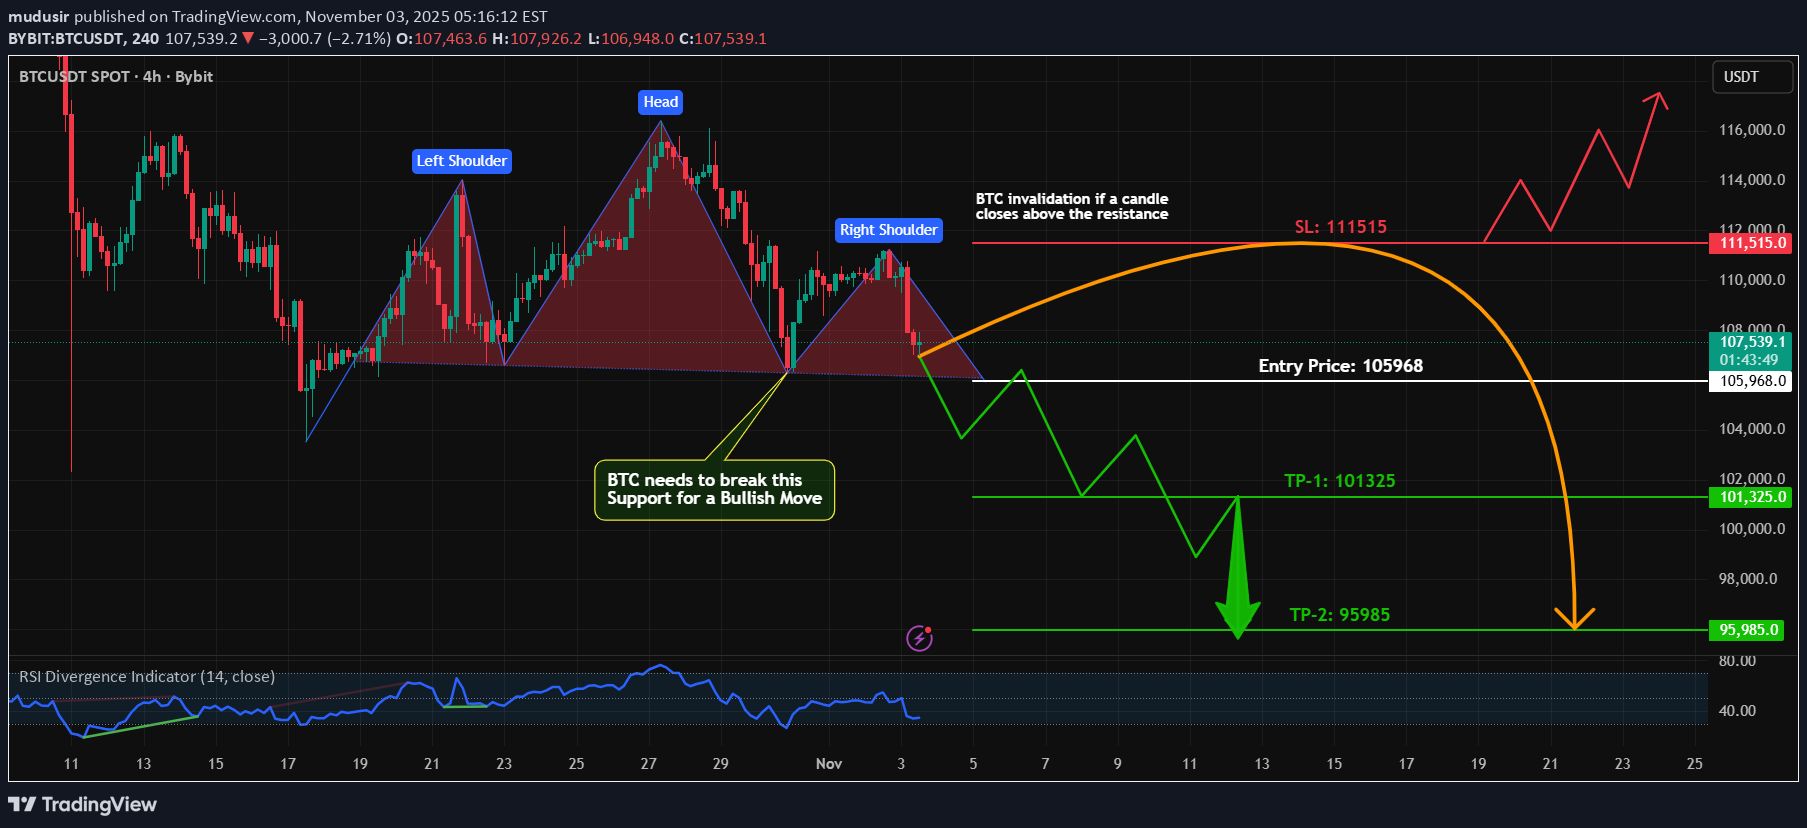
#Bitcoin is currently moving sideways, showing strong consolidation before the next major move. On the 4-hour timeframe, a Head & Shoulders pattern is clearly forming — a potential signal for an upcoming bearish reversal. Key Levels to Watch: Neckline / Support Zone: Keep an eye on this critical level — a confirmed break and retest below it could trigger a strong bearish move. Entry Plan: Wait for a clean breakout and retest before entering short. Risk Management: Always trade with proper SL and manage your position size carefully. Remember: Confirmation is key! Don’t rush — let the market show its direction. What are your thoughts — will #BTC break down or bounce from support again? Share your views below #BTC #Bitcoin #CryptoAnalysis #PriceAction #HeadAndShoulders #CryptoTrading #BTCUSDTrade is active.1st TP TP hit, move ur SL at break even point and wait for the final TP.Move ur SL at 104800 and wait for the final TP.Trade is closed at 104800 with profit.
mudusir
احتمال برگشت روند طلا: الگوی سقف دوقلو و آغاز اصلاح!
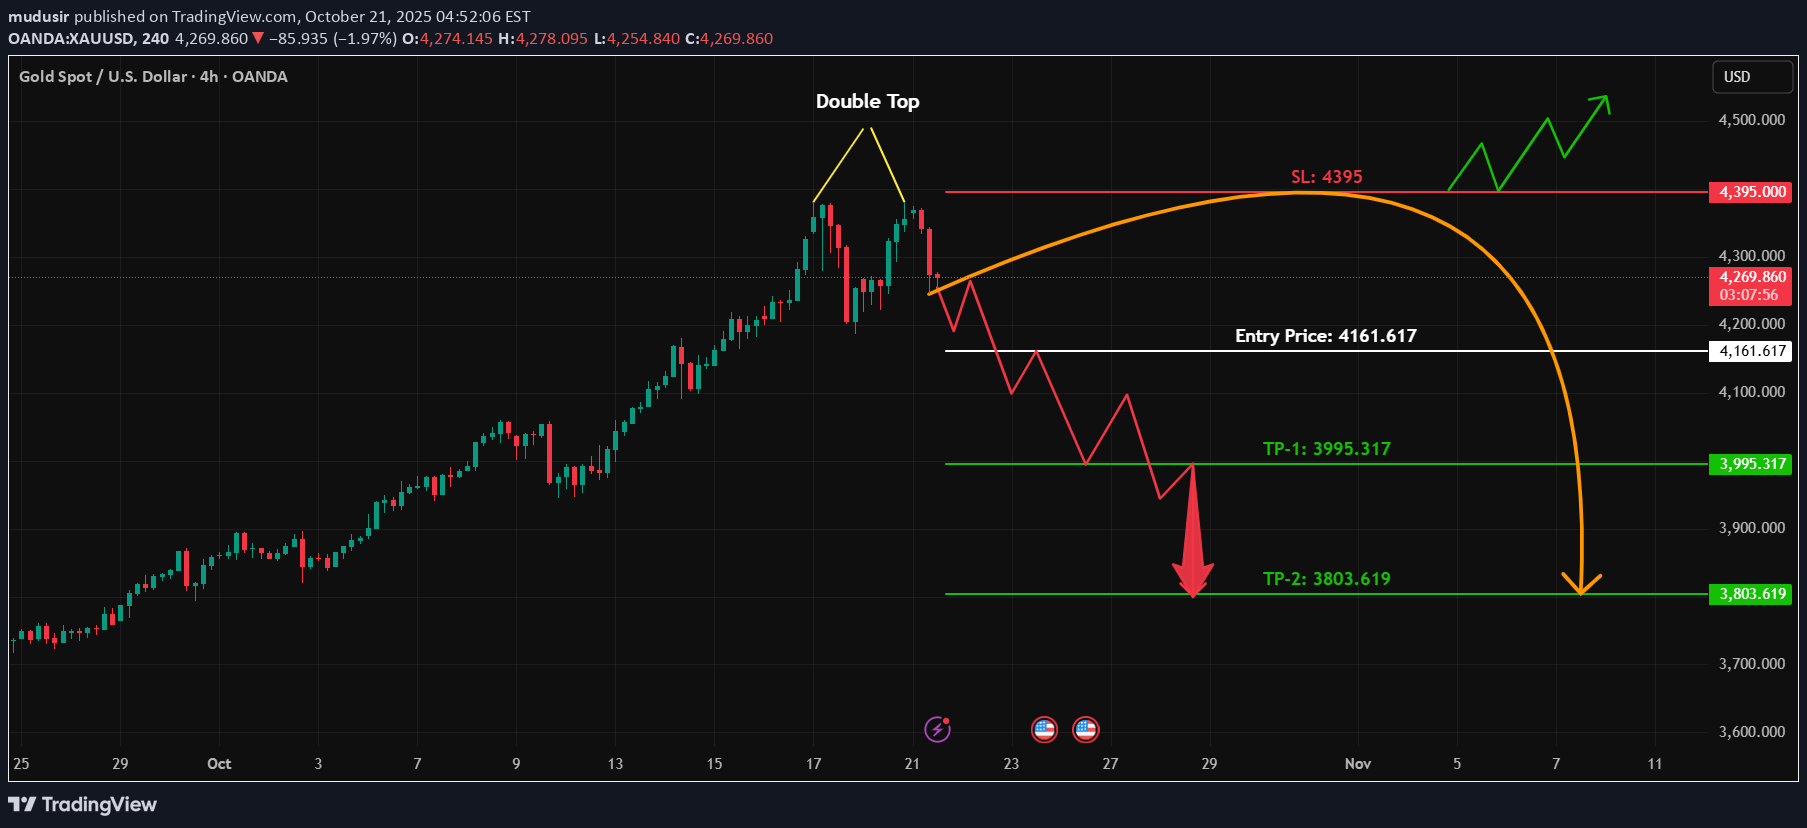
Weekly Outlook: #Gold has been moving aggressively in an uptrend, forming 9 consecutive green candles on the weekly timeframe — a strong bullish run! However, no trend moves in a straight line forever — markets always move in a zig-zag pattern. Current Scenario: Now, we are seeing signs of exhaustion — a potential Double Top pattern forming on the 4H timeframe, indicating possible bearish momentum ahead. #Gold might take a healthy correction to form Higher Lows (HLs) before continuing the next big move. Trading Plan: Watch for break of the support level (confirmation of trend reversal) On a confirmed break, we’ll look for a short setup Always apply proper risk management Key Notes: Don’t rush into early entries — wait for clear structure break This could be a high-probability setup for short-term traders What do you think? Will #Gold continue higher or start the correction phase? Share your thoughts below #GOLD #XAUUSD #PriceAction #DoubleTop #TechnicalAnalysis #TradingView #SwingTrade #TrendReversal #RiskManagement #SmartTradingTrade is activeMove ur SL at break even point and wait for the final TP.1st TP Hit, U can book 50% profit. and wait for final TPMove ur SL at 4057 and wait for final TP.This trade is closed at 4057 with profit.
mudusir
طلا: تکرار الگوی AB=CD در تایم فریم ۱ ساعته؛ آیا صعود ادامه دارد؟
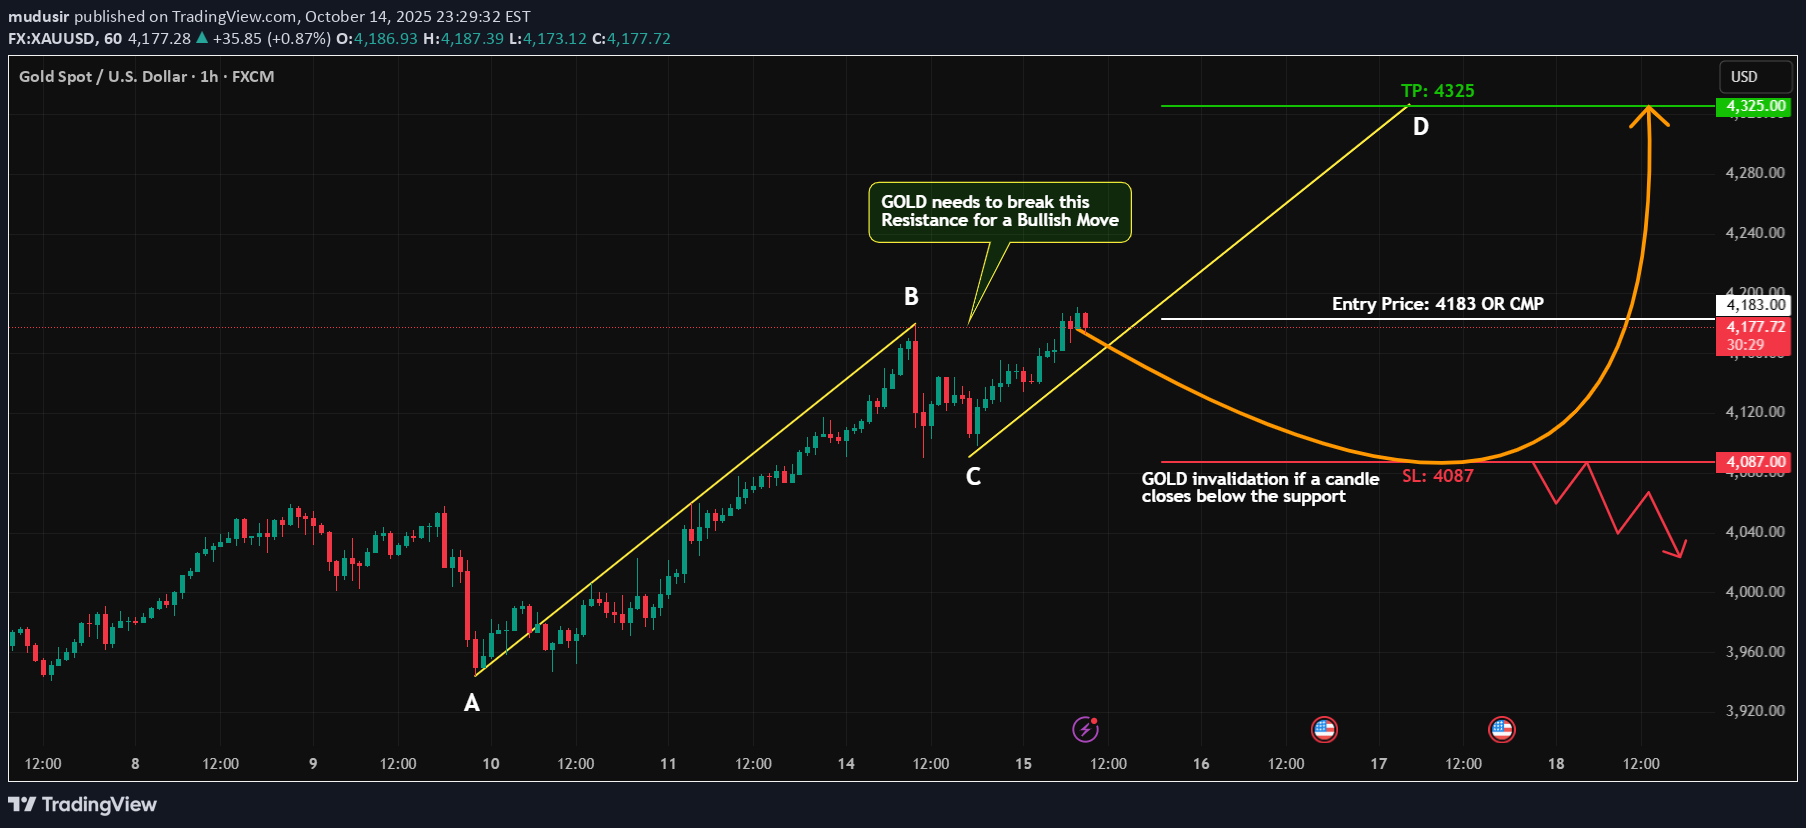
#GOLD is maintaining a strong bullish trend, showing impressive momentum across higher timeframes. Recently, it completed one AB=CD pattern, and now it's forming another fresh AB=CD structure on the 1-hour chart — a clear sign of continuation! Resistance level has been broken No bearish divergence or reversal signal Momentum remains in buyers’ favor Trade Plan: Entry: CMP Direction: Long Stop Loss: Below recent swing low Targets: Based on Fibonacci extensions Risk Management: Strict and disciplined The setup looks clean and technically strong — let's see if #GOLD continues its bullish rhythm! What do you think — will #GOLD maintain this momentum or face a quick pullback before the next leg up? Drop your thoughts below #GOLD #XAUUSD #ABCDpattern #HarmonicTrading #PriceAction #TradingSetup #BullishTrend #TechnicalAnalysis #SwingTradeTrade is activeTP Hit
mudusir
احتمال برگشت صعودی بیت کوین: الگوی هارمونیک چه میگوید؟

#Bitcoin has been moving in a downtrend, but the market structure is showing early signs of a potential reversal. On the 30-minute timeframe, #BTC is forming a harmonic pattern, which could trigger a strong bullish move once confirmed. On the 15-minute timeframe, I’m watching for two key confirmations: Bullish Divergence Break and Retest of the Resistance Level (highlighted on the chart) Once both conditions align, I’ll be looking to enter a long position on the retest, following proper risk management. Patience is key — no early entries until confirmation! What’s your view on this setup? Do you think #BTC will reverse soon or continue the downtrend? Drop your thoughts below! #BTC #Bitcoin #Crypto #HarmonicPattern #TechnicalAnalysis #TradingSetup #PriceAction #CryptoTrading #TrendReversalTrade is active.SL Hit
mudusir
احتمال انفجار قیمت BNB: آیا پرچم گاوی به سمت اوج تاریخی جدید میرود؟

#BNB is showing strong bullish momentum — it’s moving in a perfect uptrend with healthy volume supporting the move. Currently, #BNB is forming a Bullish Flag Pattern on the 4H timeframe, which often signals a continuation of the uptrend after a short consolidation. Trade Plan: Wait for a clean breakout above the flag structure. On breakout confirmation, take a long position with proper risk management. The breakout could lead us toward a new ATH (All-Time High) if momentum continues. Key Notes: Volume confirmation is crucial for a valid breakout. Watch for fakeouts near resistance levels. What’s your view on #BNB? Do you think it can reach a new ATH soon? Let’s discuss! #BNB #BNBUSD #Crypto #BullishFlag #TradingView #CryptoTrading #Binance #BNBAnalysis #Altcoins #PriceAction #Breakout #TechnicalAnalysis #CryptoBullRun
Disclaimer
Any content and materials included in Sahmeto's website and official communication channels are a compilation of personal opinions and analyses and are not binding. They do not constitute any recommendation for buying, selling, entering or exiting the stock market and cryptocurrency market. Also, all news and analyses included in the website and channels are merely republished information from official and unofficial domestic and foreign sources, and it is obvious that users of the said content are responsible for following up and ensuring the authenticity and accuracy of the materials. Therefore, while disclaiming responsibility, it is declared that the responsibility for any decision-making, action, and potential profit and loss in the capital market and cryptocurrency market lies with the trader.