
mr_forexbull
@t_mr_forexbull

What symbols does the trader recommend buying?
Purchase History
پیام های تریدر
Filter
mr_forexbull
Bitcoin Buy or Sell ??

Remember that buying Bitcoin now is very risky. There is a possibility of the above-mentioned triangle structure. So Bitcoin has almost reached the end of wave D. It is still too early to post shorts. Because the bearish market signal has not been observed yet. In terms of time analysis, Bitcoin's main uptrend will start after 2025.
mr_forexbull
Xauusd short

Long term: Xauusd is in big Diametric. At the moment, the bullish C wave has completed. Therefore, we expect the price to return to the $1,800 range in the new corrective wave(d). Short term: as indicated in the chart, any pullback to red support line can be a opportunity for a short position.
mr_forexbull
BTCUSD what's going on??
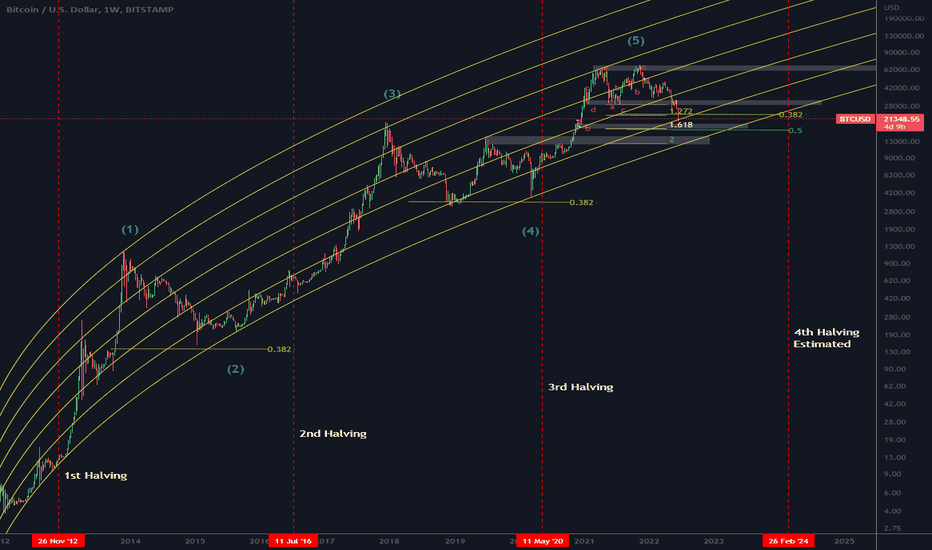
Bitcoin regression chart (Long-term) tips: 1- If the lowest price of bitcoin in this cycle consider about $ 14,000, there is a chance to reach this price until (Nov-Dec) 2022. So, do not rush to buy. 2- The maximum time for the downtrend of bitcoin, will be around March 2023. 3- Based on personal experience and past chart of Bitcoin, the probability of reaching the price of $ 14,000 is low and we will probably see an increase in buys at $ 17-20 k. 4- If a person buys bitcoin at a price below $ 25,000, it will most likely be in profit at 4th Halwing. 5- If you look at the previous ATHs, it is clear that after each cycle, the bitcoin ATH has decreased by one level. it is because of logarithmic price. its mean that the higher price, makes the lower growth rate anyways in the last cycle, ATH of bitcoin has decreased to the third line. So, we have to search the next bitcoin ATH in the fourth line level. 6- We can consider the whole history of Bitcoin (the last 12 years) as a major wave 1. So, we are now in wave 2 that there is no example of this correction in the past. Therefore, in this downtrend, holding altcoins will be so much risky than holding bitcoin. 7- To better understanding of this downtrend, it is recommended to refer to the Nasdaq Index ( NDX ) in 2000. The rich invest in time, the poor invest in money Pooya BahaeepoorRemember this is the first #Bitcoin correction as Wave 2. So, do not be surprised if it is the longest.
mr_forexbull
tron/usd ready for landing...

After analyzing the TRON, weakness in uptrend is observed. Due to the market momentum, there is a possibility that TRON will crash. but first, set a trigger for entry position and do not forget about SL trade with your choiceEverything you need is always in chart...
mr_forexbull
XRP/USD logarithmic regression potential

Ripple Behavioral Analysis compared to the past of the chart, follows a similar Doge/usd pattern. Ripple's logarithmic regression curve below shows that potential for a big move in the near future exist. So in this cycle, Ripple could even reach to $ 10-15. SL: x<0.70 $ in weekly good luck
Disclaimer
Any content and materials included in Sahmeto's website and official communication channels are a compilation of personal opinions and analyses and are not binding. They do not constitute any recommendation for buying, selling, entering or exiting the stock market and cryptocurrency market. Also, all news and analyses included in the website and channels are merely republished information from official and unofficial domestic and foreign sources, and it is obvious that users of the said content are responsible for following up and ensuring the authenticity and accuracy of the materials. Therefore, while disclaiming responsibility, it is declared that the responsibility for any decision-making, action, and potential profit and loss in the capital market and cryptocurrency market lies with the trader.