
mptrading74675
@t_mptrading74675

What symbols does the trader recommend buying?
Purchase History
پیام های تریدر
Filter
هشدار بزرگ: آیا نمودار بیت کوین فریبنده است؟ راز عملکرد متفاوت مایکرواستراتژی!
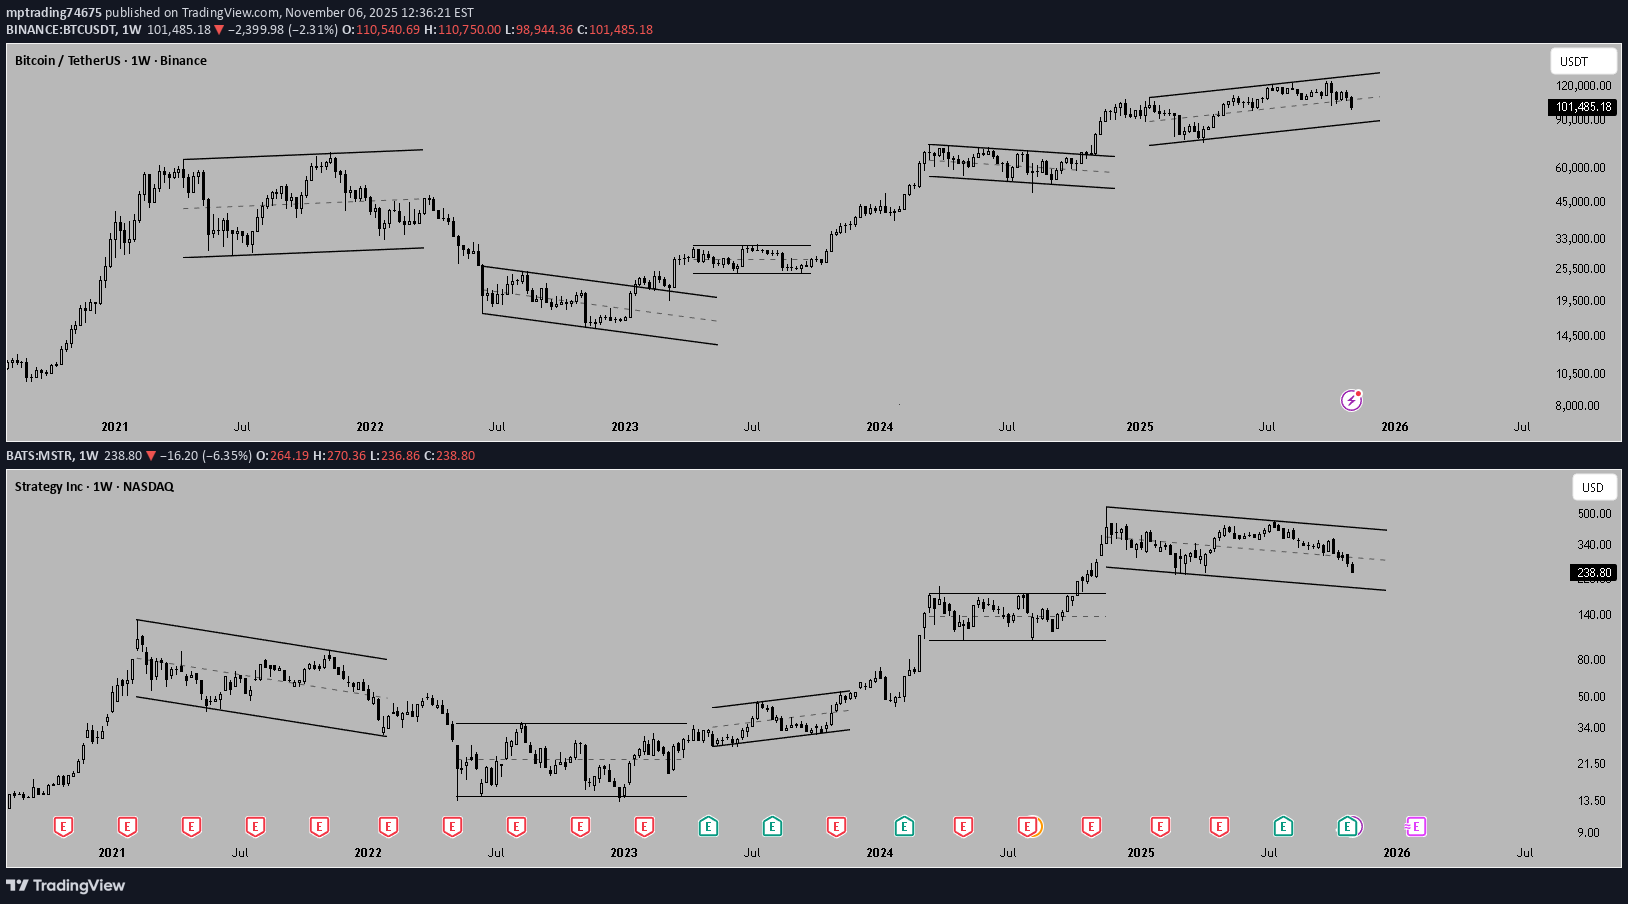
If you compare the charts of BTC and MSTR, you can see that at BTC tops, MSTR was already bearish or weaker than BTC. At bottoms, MSTR was bullish or stronger than BTC. The same applies to intermediate corrections in a bull market (there hasn't been a prolonged 2–3 year bear market so far to see what would happen in that case). Unfortunately, MSTR is showing a double top (Nov 2024 and Jul 2025) while BTC is making a higher high—hence a strong bearish divergence, signaling a high-probability correction in BTC. I still expect a drop in BTC.D (one of my last ideas), most likely when BTC retraces (bear trap), but we'll see. As always, I think it's a good idea to be prepared for both directions and scale out gradually.
حرکت نهایی دوجکوین: آماده صعود کوتاهمدت یا سقوط طولانیمدت؟
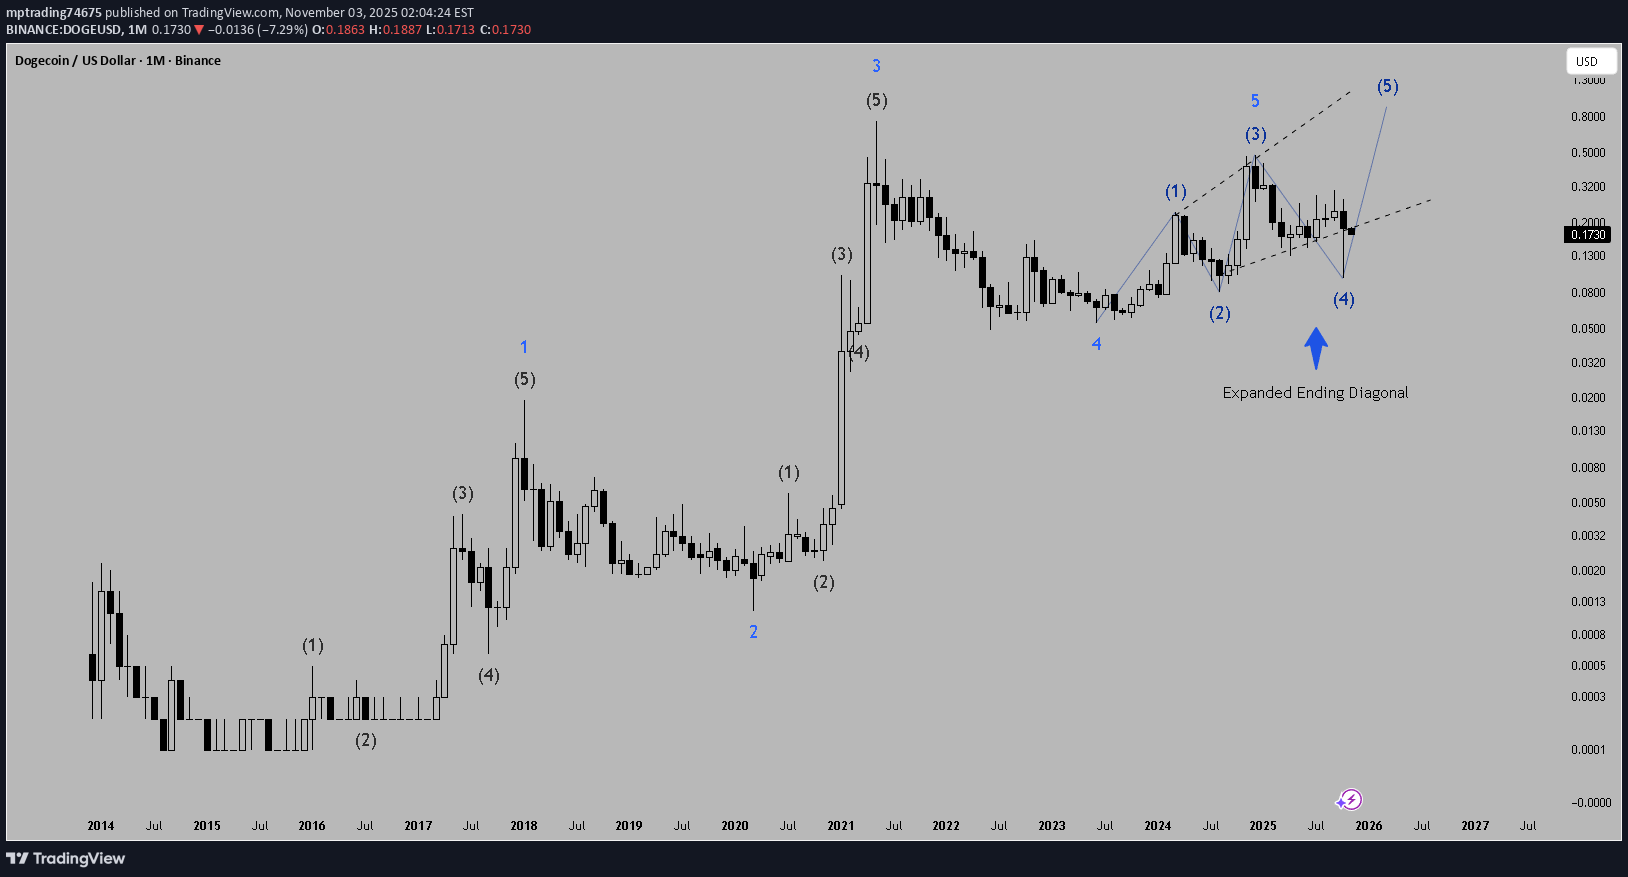
Dogecoin is potentially forming an expanded ending diagonal as Wave 5. The uptrend at the end of 2022 can't be Wave 1 because no clear five-wave impulse is countable. Regardless of my bullish stance, I would be wary and prepare for movement in either direction. Short-term, I'm bullish for the last Wave 5 of the diagonal. Long-term, I see a prolonged bear market coming.
Fractal: Dogecoin vs. ELON

This idea is speculative and shouldn’t be taken too seriously, but the resemblance between these two charts is striking. Both projects experienced two massive bull runs with a brief correction period between them, followed by a multi-year bear market. Both saw a volume spike exceeding 10 times the average volume. Dogecoin reversed with an inverse head-and-shoulders pattern, while ELON is potentially forming a triple bottom. ELON is currently considered ‘dead,’ much like Dogecoin was back then. I believe it doesn’t hurt to take a small position here—similar to the sentiment shared by influencers about Dogecoin before its massive rally.
XRP Breakout with Target at $4.80

XRP just broke out of a typical complex wave 4 Elliott wave formation by completing the last 2D-candle. Consider taking profits in steps as wave 5 is often surprisingly short and disappointing. A $5–6 target is possible if bullish momentum persists, but monitor for early reversal signs.
All-time Top reached for BTC

Looks like my previous wave count was invalidated. I actually assumed that 69 k was the top of wave 5 but it was only the top of wave 4 (expanding flat) and wave 5 ends at 73 k (strong top). If you did your sentiment analysis properly, you can notice that almost every influencer is bullish and claims that retail is bearish which is a sheer lie. They are doing this because retail learned that greed is a sign to sell, so they had to come up with this strategy. I read many many comments of people who follow crypto influencers and the majority is either laughing about this crash or happily buying more, etc. The fear and greed index is also still in greed. Regardless if it's not only based on sentiment, it's still a good contra indicator and works if used in combination with other indicators. The key level got rejected three times by wave 3, wave 4 and wave 5. It's a strong sign that it's over, at least for now but I doubt there will ever be a comeback except for a retrace. Short-term I think BTC could be close to a bottom for an abc-retrace.
Top of the bull trap reached

In my view, BTC has reached its top of the bear market rally, which smart money used to scale out (on-chain data). You can see how addresses between 0.1 and 10 BTC buy every dip they can (how whales told them to do) and addresses over 100 or 1000 decline although the price is lower now. It was easy money to be made if you entered at the bottom like me and ignored the misleading media and influencers. I missed the ultimate bottom at 17 k but I was right at 15 k and expected another leg down to 17 k. Now it's time to sell BTC and see what the rest of the market does. It's probably close to the top either. Other cryptos show a bit of relative strength at the moment but it's unclear for me how long that will last. I will make another idea on Solana and "Others" if I see something valuable. On the chart you see my rough wave count. It's not the only possible wave count but they all should come to an end here. It's the perfect spot to get out for those who missed the 69 k all time top which I got right as well. The sentiment flips between greed and extreme greed and new retail traders asking for advice if they should buy BTC because of the ETF. The sell-off volume yesterday was 40 billion. In addition the relative price strength declines at this very important key level. Too much risk to hold BTC any longer.
Perfect time to buy cryptos

After the fakedown yesterday (despite bad cpi numbers), my best educated guess is now that a local bottom / bottom is reached. Around 69 k I said that the top is reached which came true fortunately. I also said that this top will never be reached again but wasn't quite sure if a marginal higher high (80 k - 90 k) is still likely in the future. Unfortunately I can only trade step by step and for now I think it's a sweet spot for accumulating good cryptos. Evaluations are attractiv (production costs / average revenues of miners), btc is loosing downwards-momentum at a key level and forms a classic ending diagonal and the price of the s&p is convergent with btc and also indicates a bottom. Bearish sentiment is at its worst and the herd thinks they are in the minority. I already heard several times that "this time is different", even from well-known crypto influencers. A bigger correction to the upside is likely, maybe in form of an abc zig zag. After the correction I will re-analyze for a potential bull trap or further upside.
Ethereum is leading the way for alts

I assume, after this next downmove for the alts to cheaper prices, a long-term abc correction is due. The markets shows rejections from important levels all the way. Nothing new for anyone. Hopefully I'm not boring anyone with this idea.

XRP Solana Fractal with similar bearish sentiment

This fractal speaks for itself. The descending triangle is usually rather bearish but retail sentiment is at the bottom. I did my analyses on the s&p, bitcoin and alts and came to the conclusion that this is most likely the bottom. Some alts, including XRP have a few more percent to the downside. So in my opinion a good time to average in but a bad time to trade. I see bearish technical targets at around $ 0.25 but for me dca is the way to go here as I never fight the uptrend. Not unlikely to see XRP over a dollar by august and possibly new all time highs for BTC, ETH and BNB this year.
Disclaimer
Any content and materials included in Sahmeto's website and official communication channels are a compilation of personal opinions and analyses and are not binding. They do not constitute any recommendation for buying, selling, entering or exiting the stock market and cryptocurrency market. Also, all news and analyses included in the website and channels are merely republished information from official and unofficial domestic and foreign sources, and it is obvious that users of the said content are responsible for following up and ensuring the authenticity and accuracy of the materials. Therefore, while disclaiming responsibility, it is declared that the responsibility for any decision-making, action, and potential profit and loss in the capital market and cryptocurrency market lies with the trader.