
mike-b
@t_mike-b

What symbols does the trader recommend buying?
Purchase History
پیام های تریدر
Filter
mike-b
پیشبینی تکاندهنده طلا: آیا 4000 دلار آغاز صعود است یا سقوط قریبالوقوع؟
mike-b
طلا در آستانه اوج جدید: بعد از رسیدن به ۴۳۸۰ دلار، مقصد نهایی کجاست و اصلاح یکساله چه قیمتی را نشانه میرود؟
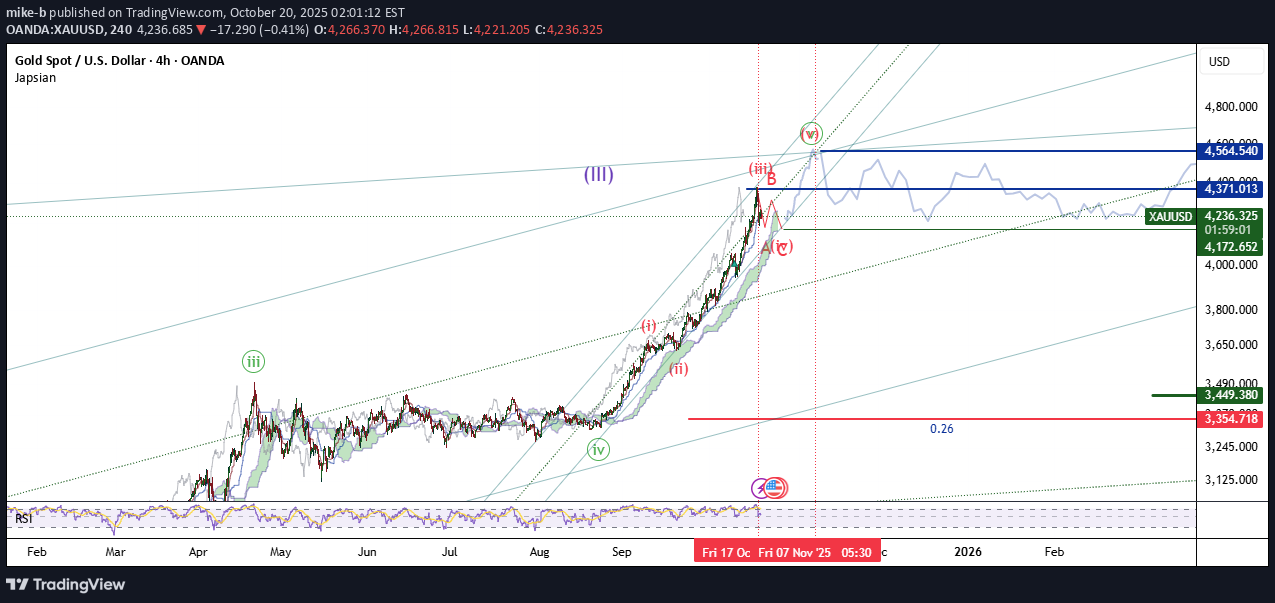
Based on my previous analyses, where I projected gold to rise from $2,900 toward $4,500, the price has now reached $4,380. However, this is not the end of the move. There is still a small upward leg remaining, likely targeting around $4,565 to complete this wave count. After that, gold is expected to enter a corrective phase lasting roughly one year, with a potential decline toward the $3,200–$3,120 range. For now, we’ll continue following this current wave until it completes, and then we’ll proceed with the next stages of the analysis.
mike-b
بیت کوین در آستانه سقوط؟ سطوح حیاتی پیش رو برای BTC/USDT
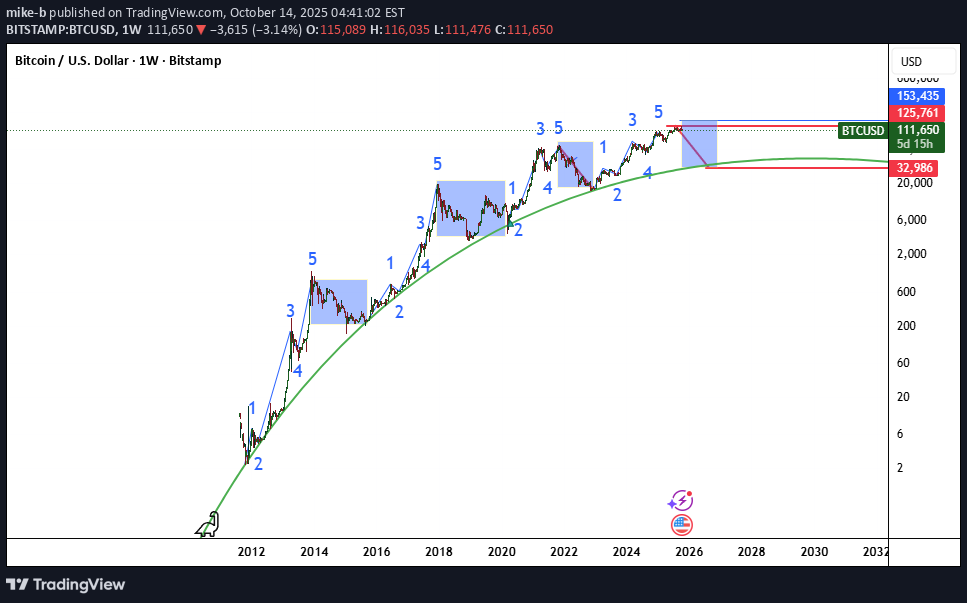
It seems that Bitcoin is showing a time-based price behavior, and considering the pattern of its growth across several previous waves, it may be setting up for a price correction toward the levels marked on the chart. In addition, if the price breaks above **$125,000**, the next major resistance that could trigger a deeper correction is around **$153,000**. After reaching that level, Bitcoin may enter a corrective phase toward the **$45,000–$60,000** range. However, if **$125,000** fails to break and the price pulls back toward **$94,000**, a **daily close below this level** could open the way for a move down toward the previously mentioned support zones.
mike-b

mike-b
XAUUSD

It seems that global gold has entered a complex corrective wave, and both in terms of time and price, we should wait for the waves to fully develop and complete their patterns, reaching the end of wave 4. After that, it would be possible to enter a buy position targeting the levels specified on the chart.
mike-b
NVIDIA

"It’s clear that this stock is currently in a strong upward wave and could advance toward wave 5 of 3, targeting the $1,090–$1,350 range. After reaching this zone, it may enter a corrective phase as wave 4, which could bring a pullback to the $150–$250 range. Following that, the stock is expected to resume its main wave 5 rally, with targets between $5,000 and $7,200."
mike-b
XAUUSD Daily

In the daily timeframe, I think global gold will touch the 3085 range, then decline to 2760, then re-enter the rising phase and reach a new target and peak of $4400.✅ “3420 has been touched. After completing the complex corrective structure as the 4th wave, it could move toward the target mentioned on the chart which is 4400-4450”
mike-b

I think global gold is currently touching the target that was mentioned several months ago, which is 2997, but the main resistance could be 3085, from which we can imagine a decline towards 2760. On a monthly time frame, there is a vague target that shows the number $6000, and most likely, if it happens correctly, we can see this happening in late 2029.
mike-b
KDA/USDT

It looks like it will experience a nice uptrend in the medium term and rise to the resistance levels shown in the picture.
mike-b
xauusd

In my opinion, gold can create a new upward wave from this range towards 2835 and a new peak can be made.
Disclaimer
Any content and materials included in Sahmeto's website and official communication channels are a compilation of personal opinions and analyses and are not binding. They do not constitute any recommendation for buying, selling, entering or exiting the stock market and cryptocurrency market. Also, all news and analyses included in the website and channels are merely republished information from official and unofficial domestic and foreign sources, and it is obvious that users of the said content are responsible for following up and ensuring the authenticity and accuracy of the materials. Therefore, while disclaiming responsibility, it is declared that the responsibility for any decision-making, action, and potential profit and loss in the capital market and cryptocurrency market lies with the trader.