
mehdi3663digital
@t_mehdi3663digital

What symbols does the trader recommend buying?
Purchase History
پیام های تریدر
Filter
mehdi3663digital
پایان موج 5 طلا؟ پیشبینی مهم پایانی بر اساس فیبوناچی و RSI (تحلیل XAUUSD ماهانه)
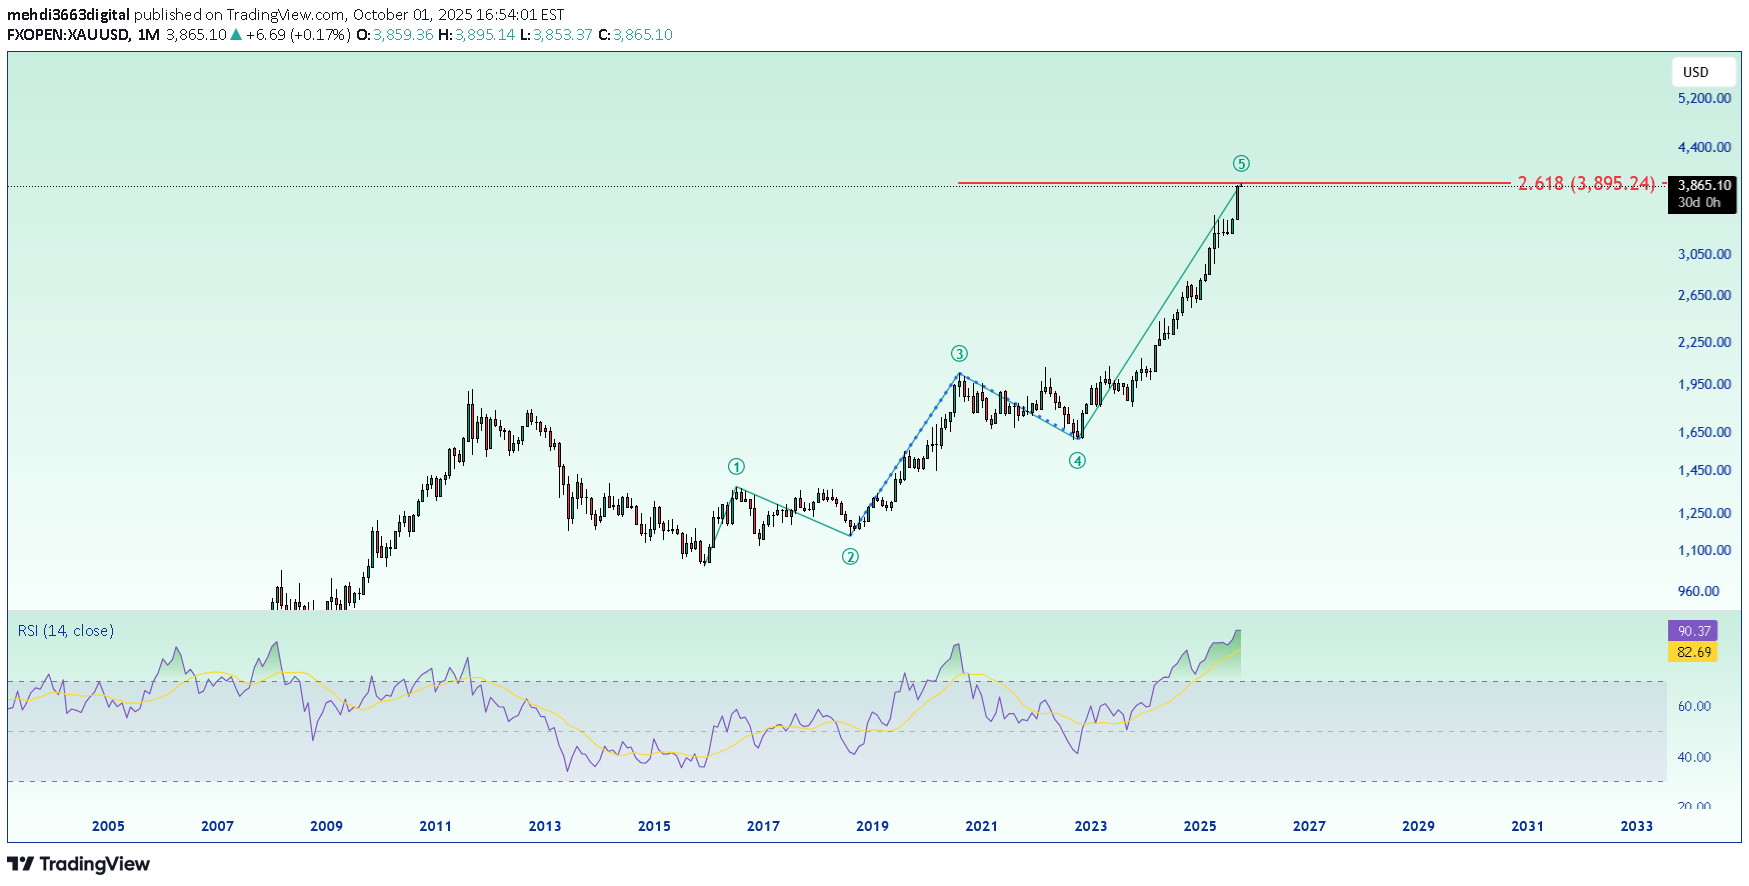
--- 🔹 Elliott Wave Structure The 1 to 5 waves are clearly counted on the chart. Gold is currently in wave 5 uptrend, reaching very close to the 2.618 Fibonacci extension (around $3895). This level can potentially mark the top of wave 5, since wave 5 often ends around the 1.618–2.618 extension of waves 1–3. --- 🔹 RSI (Relative Strength Index) RSI is around 90, which shows extreme overbought conditions. Historically, whenever RSI reached such levels (like in 2011 or 2020), a strong correction followed. This indicates the market is overheated and a pullback is highly probable. --- 🔹 Summary & Scenarios 1. Main Scenario (Correction): Wave 5 is likely complete or very close to completion. A larger corrective structure (A-B-C) may begin, which could last for years. Key support zones to watch: $3200–3300 $2700–2800 2. Alternative Scenario (Continuation – less likely): If strong bullish momentum holds above $3900, the next targets could extend toward $4200–$4400. However, based on RSI and Elliott count, this scenario is weaker. --- ✅ Conclusion: Gold is currently at all-time highs and in an extreme overbought zone. According to Elliott Wave theory, we are likely at the end of wave 5. A long-term correction is expected. For traders, the best strategy now is risk management and avoiding chasing buys at the top.
mehdi3663digital
GOLD H4 FORECAST

Gold is trading in a 4-hour ascending channel, which has fallen to 2708 after rising to 2759 dollars and faced selling pressure. Here, the demand for gold was again seen in the market and moved the price up to 2739. Currently, there is a possibility of sellers entering and correcting the price to the bottom of the ascending channel in the area of 2690. I expect price growth from there to see a new ceiling at $2,800.
mehdi3663digital
GOLD----- analysis

4 hour gold analysis Movement in the ascending channel has hit the ceiling of the channel From this area, it will most likely enter the correction phase. If the fall from the top of the channel is the same as last time, there is a possibility that it will reach the bottom of the channel and its targets are 2550--2498... This will take time because the time chart is high.
mehdi3663digital
GOLD ------H4

4 hours On Wednesday, we have CPI news... I think that gold will go up a bit first and then fall to 2455 and 2432 and from there the price will jump to 2525. This is just an analysis and it is a schematic diagram.....Do not trade based on this analysis
mehdi3663digital
GOLD......update analys

After breaking the upward trend line, gold reacted to the first resistance and fell to the previous low of 2470... according to our prediction, it moved exactly like the arrows in the drawing.
mehdi3663digital
BITCOIN .... WEEKLY ANALYS

Bitcoin has entered a wave of decline and correction on a weekly basis with its liquidity above its ceiling last year and has changed the medium-term trend and is now registering lower floors and lower ceilings. If this trend is maintained, the mid-term target will be $45,000
mehdi3663digital
GOLD..........WEEKLY

In the weekly time, gold was rising in a rising 5-wave, and the Elliott targets of this 5-wave based on Fibonacci patterns are at $2605 and $2670. In the chart, due to the divergence in oscillators and neutral candles in the last two weeks, there is a possibility of buyers retreating..... I checked that in the last 6 years, with the beginning of September, gold enters the correction and suffering phase... Probably the same thing will happen this year.... In times lower than weekly, there is still an upward buying and suffering trend, and after changing the structure, you can enter sell positions in the resistances.
mehdi3663digital
GOLD ......H4

In the 4-hour period, the last bottom of the rising wave is at 2432, and until this bottom is not broken, the trend is still bearish.... Gold's current support is 2494 and the upcoming resistances are 2515, 2525 and 2532, which are good points for intraday trading.
mehdi3663digital
GOLD..............MONTHLY ANALYS

In the monthly time, gold is in an ascending channel since 2005, which has now reached the ceiling of this channel. In the lower times, we are on the trigger, if the trend changes, we will enter a sell position for the big tube of 200 to 300 dollars. Dear friends, I emphasize that you should be patient until the debt trend changes to sell the target of 2000 pips.
mehdi3663digital
GOLD MARKET Analysis

After Powell's speech on Friday and his comments on interest rates, gold was welcomed by buyers and moved towards its previous ceiling. On Monday, the market continued to buy gold again and raised the price to 2527. Currently, the price is close to its historical ceiling. By carefully examining the chart, we can see that the price entered the resting phase in the form of a correction triangle in an ascending channel after an ascending rally, and then broke this area upwards with a powerful candle, and on returning to it, pulled back and faced the demand again. . Currently, gold is more inclined to rise. And buying in the support areas will be a good option. The target of this upward wave can be in the area of 2555 and 2570 dollars.
Disclaimer
Any content and materials included in Sahmeto's website and official communication channels are a compilation of personal opinions and analyses and are not binding. They do not constitute any recommendation for buying, selling, entering or exiting the stock market and cryptocurrency market. Also, all news and analyses included in the website and channels are merely republished information from official and unofficial domestic and foreign sources, and it is obvious that users of the said content are responsible for following up and ensuring the authenticity and accuracy of the materials. Therefore, while disclaiming responsibility, it is declared that the responsibility for any decision-making, action, and potential profit and loss in the capital market and cryptocurrency market lies with the trader.