Technical analysis by mehdi3663digital about Symbol PAXG: Sell recommendation (10/1/2025)

mehdi3663digital
پایان موج 5 طلا؟ پیشبینی مهم پایانی بر اساس فیبوناچی و RSI (تحلیل XAUUSD ماهانه)
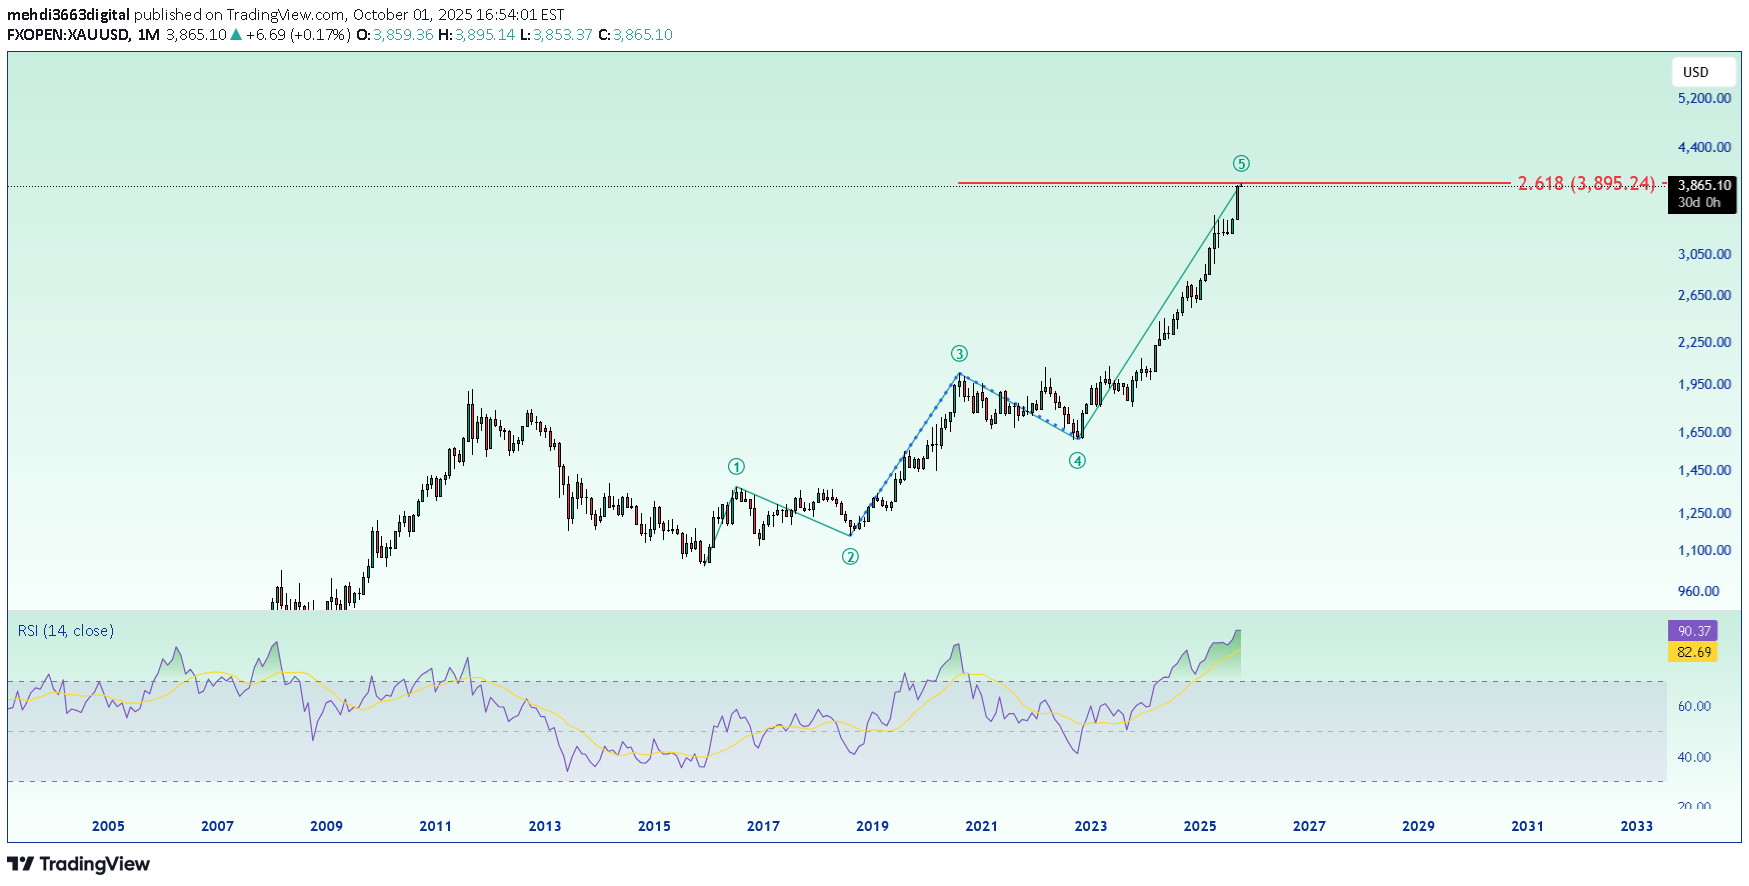
--- 🔹 Elliott Wave Structure The 1 to 5 waves are clearly counted on the chart. Gold is currently in wave 5 uptrend, reaching very close to the 2.618 Fibonacci extension (around $3895). This level can potentially mark the top of wave 5, since wave 5 often ends around the 1.618–2.618 extension of waves 1–3. --- 🔹 RSI (Relative Strength Index) RSI is around 90, which shows extreme overbought conditions. Historically, whenever RSI reached such levels (like in 2011 or 2020), a strong correction followed. This indicates the market is overheated and a pullback is highly probable. --- 🔹 Summary & Scenarios 1. Main Scenario (Correction): Wave 5 is likely complete or very close to completion. A larger corrective structure (A-B-C) may begin, which could last for years. Key support zones to watch: $3200–3300 $2700–2800 2. Alternative Scenario (Continuation – less likely): If strong bullish momentum holds above $3900, the next targets could extend toward $4200–$4400. However, based on RSI and Elliott count, this scenario is weaker. --- ✅ Conclusion: Gold is currently at all-time highs and in an extreme overbought zone. According to Elliott Wave theory, we are likely at the end of wave 5. A long-term correction is expected. For traders, the best strategy now is risk management and avoiding chasing buys at the top.