
martinxi5u4
@t_martinxi5u4

What symbols does the trader recommend buying?
Purchase History
پیام های تریدر
Filter
martinxi5u4
Anticipating Bitcoin’s Cycle Structure Into 2026
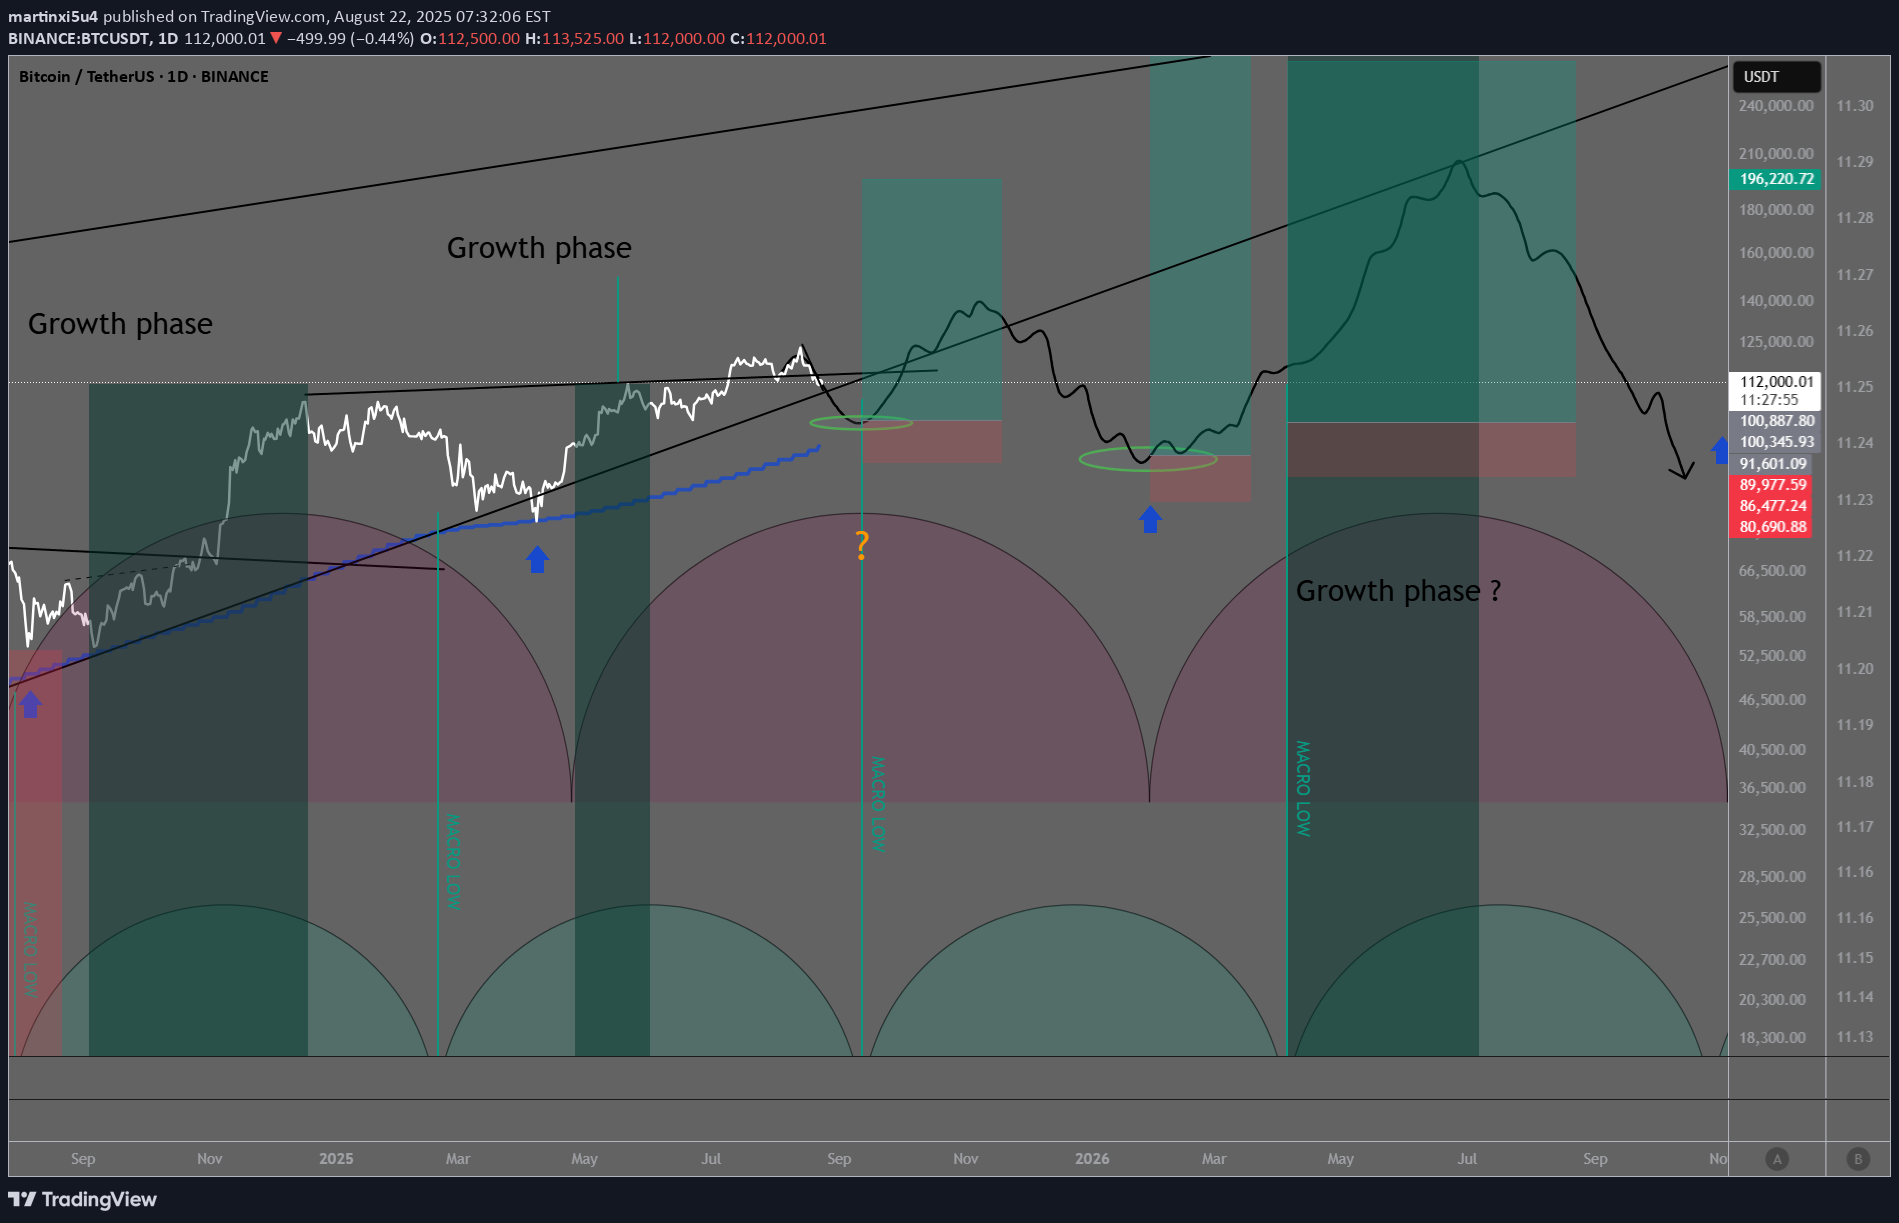
Building onto my previous work, this is how I anticipate the next year or so to play out cyclewise. I don't know about the levels, or how strong or weak the impulses will be. Example: the growth phase next summer can be super weak and be cancelled out, who knows. What I know is that, generally speaking, the impulses should be the strongest now moving into Christmas, but looking at the cycles, the weekly (strongest) cycle is to bottom in January, so because this is so close to Christmas, that might be a bummer to the blow-off top, suppressing it. Also, the macro cycle low is scheduled September 10–12th. This is also at the crest or highest high of the weekly cycle. This can also be a suppressor for an impulsive move. But overall, I am willing to go long September 6–12 time frame, where I believe I have the odds in my favour. And also from the weekly cycle low and in the growth phase in April 26, it is possible to play longs. Lastly, given that the whole bull run has happened on QT, and QE is likely to start at the signs of cracks in the markets, I think it's reasonable to think that the top might be suppressed down, and the bear market might be artificially kept higher than before, as new liquidity might be inserted to help the markets around Q1–2 2026. Shortly said: a smaller BTC top in 2025, and a smaller drawdown in the bear market in 2026.
martinxi5u4
BTC cycle overview
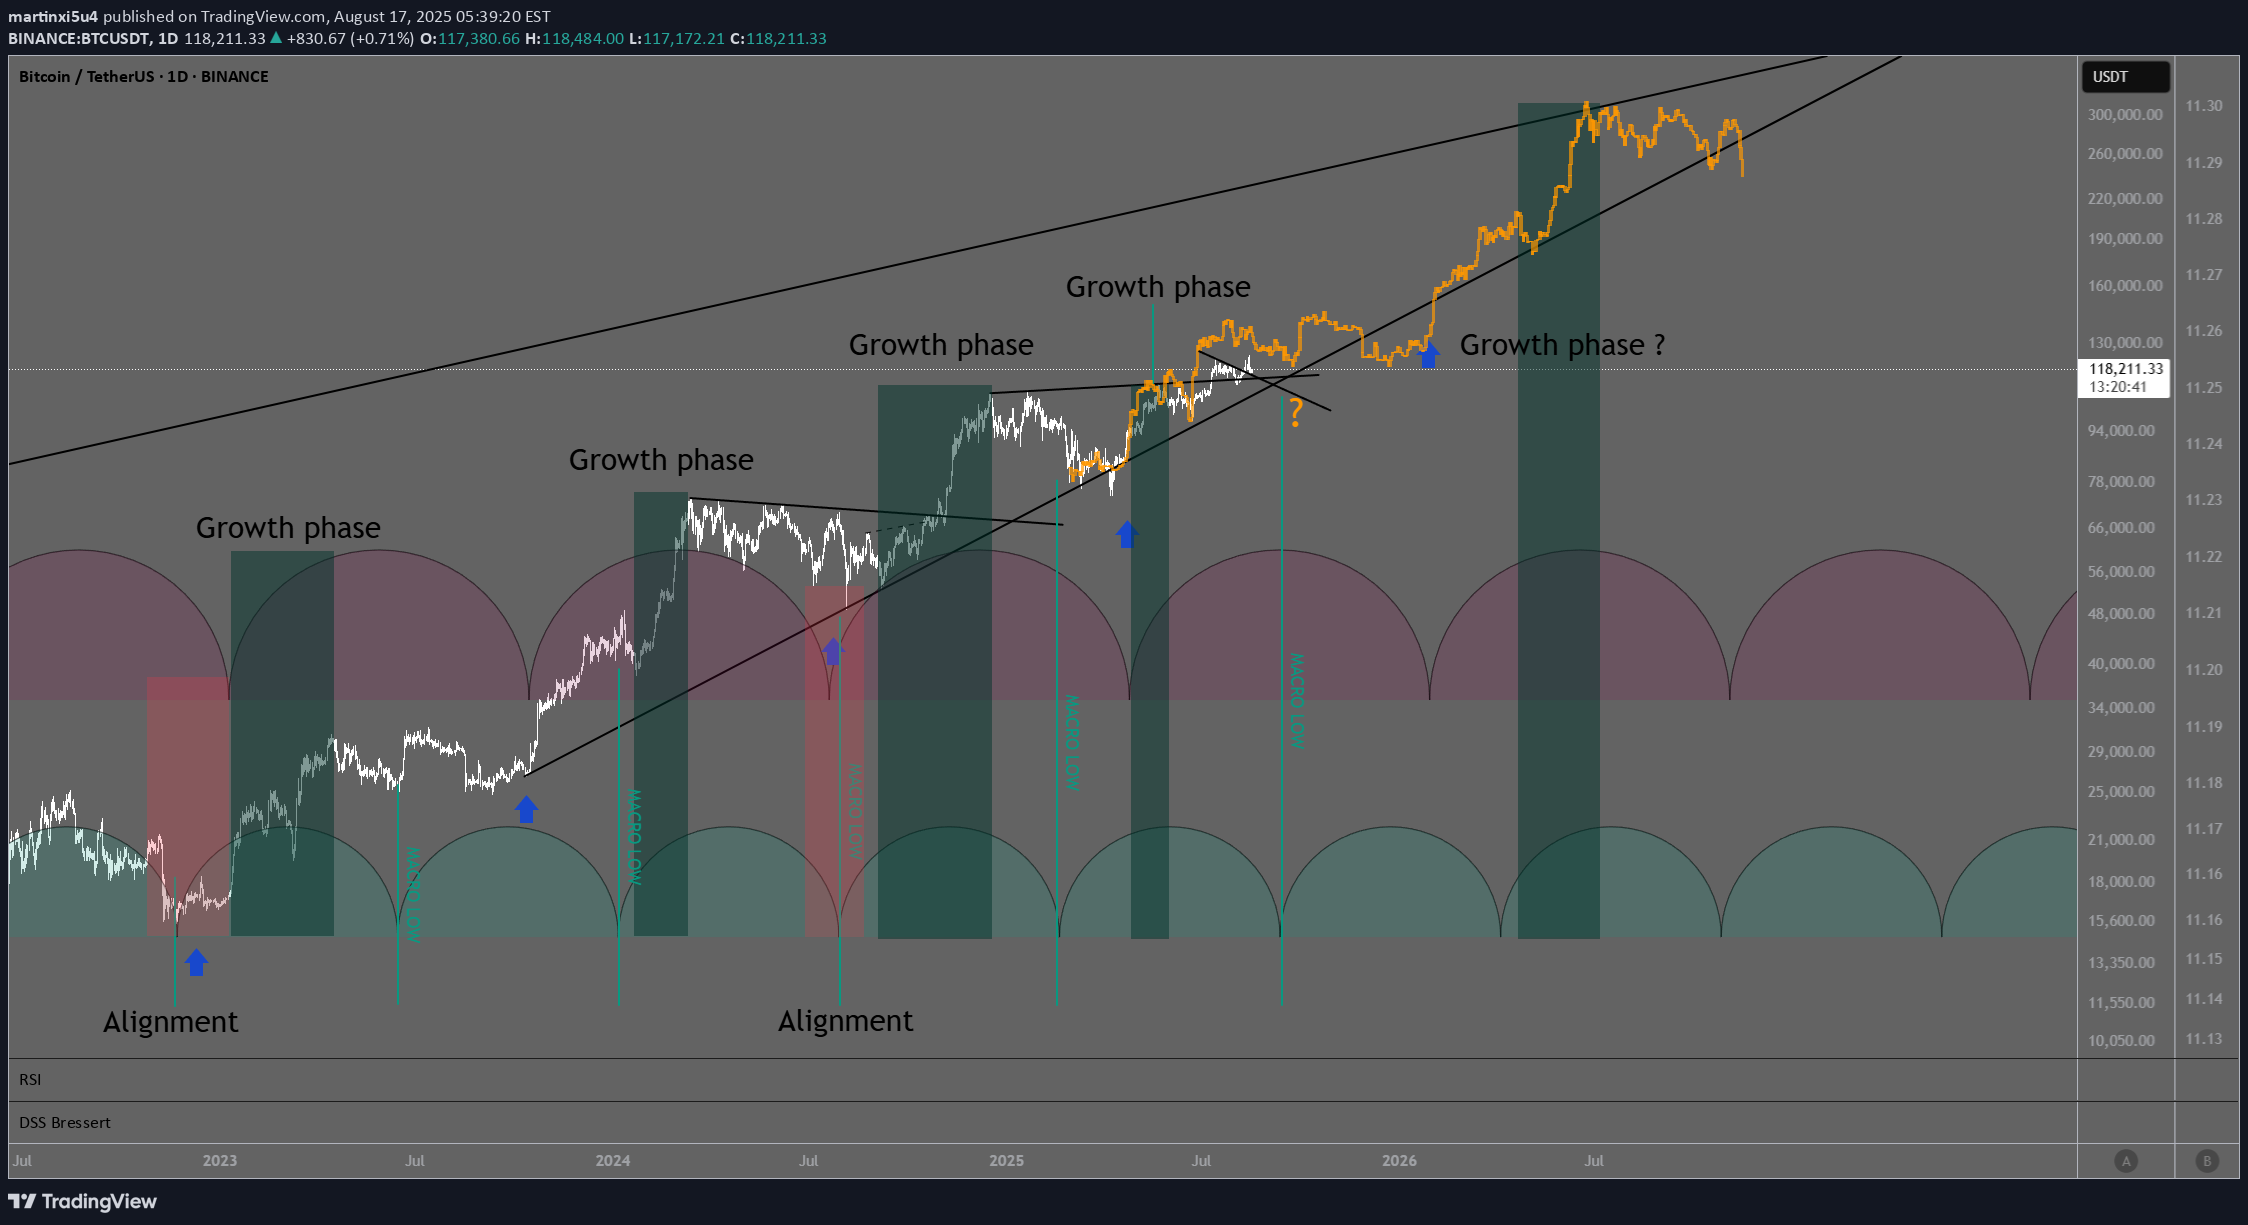
Looking through my charts in gold, BTC, and cycle influencers I have seen that everybody has an different count in the weekly cycles. I have overlaid the two popular cycles on top of each others, and believe to have found some interesting patterns. Shortly said the larger red timing cycle is the more dominant cycle, matching all the larger lows. But looking at the green timing cycle count macro lows can be observed. And when comparing the alignment of the two cycles interesting things can be seen. Example when the weekly cycle moves down and green cycle goes up, price move sideways, and when cycle lows align, big moves down occur. After the alignment lows, the cycle have moved simultaneously toward the cycle crests, and this have given BTC big volatile moves up. Growth phase happens when both cycles move align from low to crest, here there is a period where more volatile upside is observed, on the other side a volatile negative period can be seen when the cycle lows align, as seen with the FTX collapse that marked the last bear market bottom, and last summer where we was a +30% correction after the ATH before the halving. Looking forward a macro low can be seen mid September, and a larger weekly cycle low January 2026. This is not ideal for a big blow off top. But more of an curved choppy top unfortunately. Looking at the coming macro low and weekly cycle low in January which can be the end of the cycle, this can be looking very similarly to the start of the cycle ironically. Here we observe that the macro or green cycle bottoms right in the middle of the larger weekly cycle. The next where both cycle align is October 2026. Is this the next bear market low?
martinxi5u4
COINBASE GLOBAL - Technical Analysis
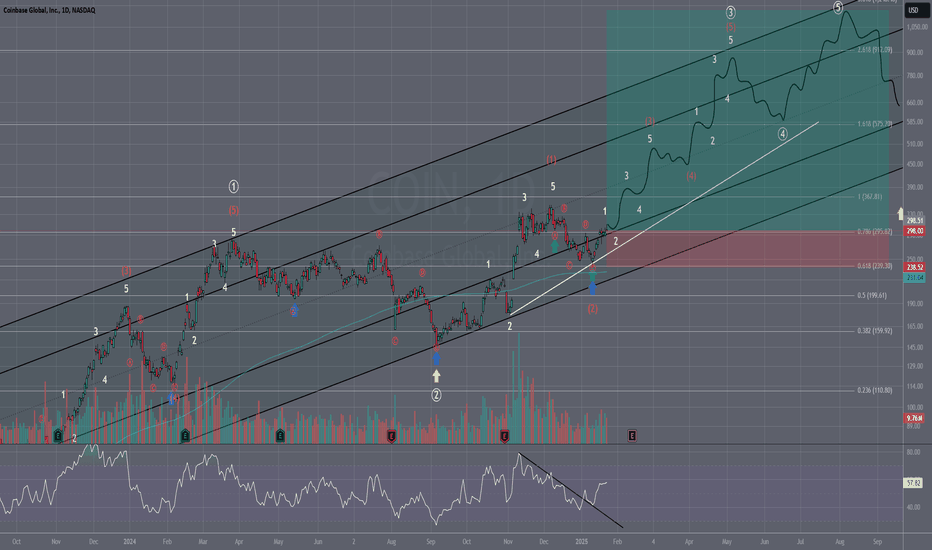
Key Observations: Elliott Wave Structure: COIN has been trading within a clear Elliott Wave pattern across the timeline shown. The chart displays a complete 5-wave impulse followed by a corrective phase. Currently, we are observing the development of another impulse wave which could be signaling the start of a new bullish cycle. Fibonacci Levels: The stock finds significant support and resistance at key Fibonacci levels. Notably, after touching the 0.618 Fibonacci retracement level at approximately $239.3, COIN shows signs of a bullish reversal, initiating the potential formation of a 3rd wave which often is the strongest and longest. Channel Trading: COIN has respected a rising channel, bouncing off the lower bounds and facing resistance at the upper. The interaction with these channel lines provides crucial entry and exit points. Technical Indicators: Volume: Trading volume appears to corroborate the wave counts, with spikes in buying volume at the start of impulse waves and increased selling pressure during corrective phases. RSI: The Relative Strength Index shows fluctuating momentum, with recent readings heading towards overbought territory, which aligns with our observation of the beginning of a potentially strong upward wave. Future Projections: If the bullish momentum continues, and COIN respects the Elliott wave pattern, the next significant resistance is expected at the 1.618 level around $575.70. However, a break below the current support at the 0.618 level could invalidate this bullish outlook and may lead to a retest of lower support levels. Trading Strategy: Long Position: Traders might consider taking a long position near the 0.618 Fib level with a stop-loss just below it. The target would be the 1.618 Fib level, aligning with the peak of the projected 3rd wave. Short Position: A break below the 0.618 Fibonacci level could be used as a signal to initiate a short position targeting the next key support level. Conclusion: COIN exhibits a strong technical structure that offers potential for both bullish and bearish trades depending on key levels. Monitoring these levels along with volume and RSI can provide valuable signals for entry and exit points.Invalidated idea
martinxi5u4
Getting ready to long gold next week (15.01.2025)

Preparing to long gold around Wednesday or Thursday next week, ideally at a WTO crossover. I believe we are in the end stages of this daily cycle, currently on day 19. Typically, a top occurs around day 20-21, followed by a few days of decline. Therefore, I will not immediately long the breakout we saw today.TP reached, looking out for more possiblities
martinxi5u4
Bitcoin: Elliott Wave and Fibonacci Analysis

Bitcoin recently completed a 7.5-month correction from Primary Wave 1 to Primary Wave 2. This lengthy consolidation phase has set the stage for a strong impulsive move in Primary Wave 3. It is unlikely that we are nearing the end of Wave 3 given the recent correction. Instead, Wave 3 appears to be in its middle stages, with significant upside potential. Key Fibonacci Targets for Wave 3 Based on the chart structure: 2.414 (~143,438 USD): A likely target for Wave 3 if momentum continues. 2.618 (~154,259 USD): A stronger extension for a typical Wave 3 in a bullish market. 3.618 (~207,304 USD): An extreme case if Wave 3 develops parabolically. Takeaway Wave 3 is typically the strongest and most impulsive, and the ongoing price action supports the idea of further upside. The correction in Wave 2 has provided the foundation for this move, and Fibonacci levels offer reliable targets to monitor. Focus on the wave count and Fibonacci levels for guidance! 🚀
martinxi5u4
Turbo/USD | Elliott Wave Analysis

This chart outlines an advanced Elliott Wave structure within a parallel channel. We've seen the first clear 5-wave impulse move (1-5) followed by corrective waves (A-B-C-D-E), retracing to the golden 0.786 Fib level (E)—an area of strong confluence. 📈 The price continues to respect the channel boundaries, suggesting a high-probability wave 3 extension forming on the local timeframe. The current setup offers potential for significant upside if the channel holds and momentum builds. Personally im looking for a local peak in the next weeks as (3), and a A-B-C correction before the HTF 3 wave peaks around mid february. Here a am planning to sell to realocate in the summer before the 5th of the 5th ending in september. Let me know your thoughts below! 💬
martinxi5u4
My prediction for BTC 2024-2025 (Cycle top prediction)

Insane prediction, but I want to post it to show that I stand behind it. Long story short, I believe BTC had an ICL (Intermediate Cycle Low) in the first week of September, which sets us up for a DCL (Daily Cycle Low) at the start of November (based on cycle theory). I believe we will break $100K this week, with a HCL (Half Cycle Low) around December 4th, an HCH (Half Cycle High) on December 20th, and a DCL just after New Year’s at $100K–$115K, followed by a final push to either $150K or $206K. I see it as a 50/50 chance between $150K and $206K by mid-February/March (as shown in the blue and orange drawings). After this, I believe we will have a 4-month consolidation down to 105-150k, before a final wave in late 2024, potentially reaching an equal or higher top around $250K.
martinxi5u4
Is LTC the Next Mid-Tier Breakout Star?

LTC just broke out of this wedge that has been forming over the last few years since 2022, and it is currently retesting the breakout. I am placing a long here with a stop loss at $77, but if you want to be safer, I recommend placing it closer to $61. I think LTC has a good chance to pump hard, similar to what we've seen with XRP, Stellar, ADA, and Solana (mid-tier coins between BTC and meme coins).Forgot to update. But LTC saw a 66% increase and hit TP in just 2 weeks.
martinxi5u4
TURBO Cup and Handle Formation

The current cup and handle formation on the logarithmic parabolic trend suggests we'll see a distribution and consolidation phase throughout October. After November 5, the handle is expected to meet the parabola. Measuring the depth of the cup projects a price target of 0.045, which aligns with the 0.786 Fib retracement and other confluence zones. In terms of timing, the handle indicates a breakout around November 14 ±, and we could hit 0.045 within 1-2 months post-breakout. Other key price targets based on the parabola: April: 0.146 May: 0.3 June: 0.62 July: 1.325 I'll be watching for a parabola breakdown or BTC.D breakdown to secure significant gains—catching the ultimate top isn't my priority.Invalidated
martinxi5u4
High probability that $BTC is at the top of its channel

There are conflicting opinions on whether BTC is in a new bullish trend or still stuck in the old downward-facing channel. Honestly, I don't think it matters. Both channels intersect today, and the price has wicked through both. From a shorting perspective, the orange channel represents the "worst case," while the purple one offers the highest downside potential for a short position. I plan to take profits around 55,300 as this seems the most likely next move. Of course, there's always a chance of a breakout and getting liquidated, which is why it's crucial to manage risk and never risk more than 2% of your total capital per trade. Good luck out there! 🫡 #BTC #Crypto #RiskManagement #ShortPositionBTC broke out. SL hit
Disclaimer
Any content and materials included in Sahmeto's website and official communication channels are a compilation of personal opinions and analyses and are not binding. They do not constitute any recommendation for buying, selling, entering or exiting the stock market and cryptocurrency market. Also, all news and analyses included in the website and channels are merely republished information from official and unofficial domestic and foreign sources, and it is obvious that users of the said content are responsible for following up and ensuring the authenticity and accuracy of the materials. Therefore, while disclaiming responsibility, it is declared that the responsibility for any decision-making, action, and potential profit and loss in the capital market and cryptocurrency market lies with the trader.